

Abstract
To allow robots to interact with humans via touch, new sensing concepts are needed that can detect a wide range of potential interactions and cover the body of a robot. In this paper, a skin-inspired multi-layer tactile sensing architecture is presented and characterized. The structure consists of stretchable piezoresistive strain-sensing layers over foam layers of different stiffness, allowing for both sufficient sensitivity and pressure range for human contacts. Strip-shaped sensors were used in this architecture to produce a deformation response proportional to pressure. The roles of the foam layers were elucidated by changing their stiffness and thickness, allowing the development of a geometric model to account for indenter interactions with the structure. The advantage of this architecture over other approaches is the ability to easily tune performance by adjusting the stiffness or thickness of the foams to tailor the response for different applications. Since viscoelastic materials were used, the temporal effects were also investigated.
Export citation and abstract BibTeX RIS
1. Introduction
The integration of tactile sensors is of interest for robots that may physically interact with humans. Requirements for a tactile skin can be drawn from pressures associated with human contact, as summarized in table 1. The values cover a substantial range, from operating a touchscreen at 5 kPa to delivering a punch at 800 kPa. For an electronic skin, it is challenging to maintain sufficient sensitivity at the most commonly encountered low forces while still providing measurements at high forces.
Table 1. Forces involved in human contact and calculated pressures based on assumed contact areas.
| Pressure (kPa)a | ||||
|---|---|---|---|---|
| Contact type | Force (N) | Finger (2 cm2) | Fist/Hand (20 cm2) | Source |
| Touching cell phone screen, typing on keyboard | 1–2 | 5–10 | — | [1, 2] |
| Grasping light rough object | 5 | 25 | 2.5 | [3] |
| Grasping light slippery object | 25 | 125 | 12.5 | [3] |
| Gripping (typical), per finger | 30–60 | 150–300 | — | [4] |
| Poking, pressing | 35–50 | 175–250 | 17.5–25 | [5, 6] |
| Strong pinching | 65–100 | 325–500 | — | [5] |
| Pulling, pushing (whole body) | 100–500 | — | 50–250 | [7, 8] |
| Gripping, whole hand | 250–550 | — | 125–275 | [5, 8] |
| Punching (novice boxer) | 1600 | — | 800 | [9] |
aForces were reported in the source references, and the corresponding pressures were calculated based on the given assumed sizes.
Efforts on tactile sensing have focused on sensor development [10]. Flexible and stretchable sensors have been demonstrated that are highly sensitive, accurate, and linear [11–21]. For recent elastomeric resistive tactile sensors, force ranges are on the order of 2–5 N and gauge factors (GFs) are 7–33, as summarized in [22]. Ultra-sensitive sensors typically have low upper limits (e.g. 5–10 kPa [21, 23, 24]), although some have reached the intermediate range in table 1 (140 kPa [25], 80 N [26]). Soft, porous materials [23, 24, 27, 28], including foams [24, 25, 29, 30], provide a straightforward way to increase sensitivity. Mechanical compliance enhances signals from both capacitive [24, 25] and resistive sensors [27, 29]. Recently, a sensing structure having soft and stiff foams side by side has been reported, with the soft foam providing higher sensitivity [31]. Another way to increase compliance is by adding spacers [32–34] or compressible microstructured surface features [35, 36] such as pyramids [36, 37], ridges [35, 38], and micropillars [39].
It has been difficult to prevent signal saturation at high pressure [40, 41]. Simply increasing the stiffness of the material increases the range at the cost of sensitivity [40]. Making use of two distinct sensing mechanisms can increase the force range [42], but the signal may then be non-monotonic, changing sign as the dominant mechanism changes. Other approaches to extending the force range have included adding surface texture [41], altering the sensor geometry [43, 44], and tailoring the sensing material, for example by adjusting the shape of embedded particles [45]. Thus, covering the entire potential force range in human–robot interactions remains a challenge.
To reduce the potential for harm during contact, robots can be covered with padding (figure 1(a)). However, relatively little work has been done to examine the performance of sensors over soft substrates such as foams. Rigid tactile sensors are usually placed under the padding to mechanically protect them, but this comes at a cost in terms of sensitivity and spatial resolution [46, 47], as well as the need to solve an inverse tactile transduction problem [48]. Embedding sensors in an elastic body has also been examined [49]. Stretchable sensors can be placed over the padding, but the signals are modulated by the compliant substrate (figures 1(b), (c)) [29]. For a strain sensor, this modulation is actually required, since the signal is due to the deformation of the padding under an applied load. There are advantages to placing an elastic sensor on a spongy surface, as described for a recently commercialized fingertip sensor: the larger deformations associated with both materials enables more energy to be absorbed during collisions and allows more time for the robot to alter its motion to prevent damage [50]. These combinations are also inexpensive to produce, have the ability to cover large and complex areas, have a lower rate of false positives, and lack sharp edges and 'dead spots' [51, 52].
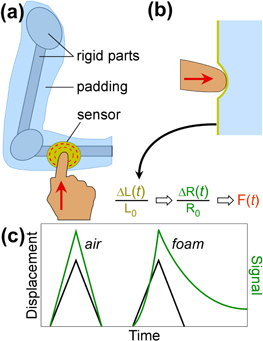
Figure 1. (a) Schematic of a strain sensor on a padded robot arm experiencing a touch. (b) The touch produces an indentation in the foam, leading to a strain in the sensor and thus a change in its resistance, from which the applied force can be inferred. (c) A sensor with a linear response to displacement will have a different response on foam, reflecting the viscoelastic mechanical properties of the foam.
Download figure:
Standard image High-resolution imageMammalian skin is multi-layered, with several sorts of mechanoreceptors, overlapping and located at different depths; tactile sensors are located at the surface (SA-I Merkel cells) for high resolution and deeper within it (SA-II Ruffini corpuscles) for more distributed sensation [53–57]. Yet, there has been little research on artificial multi-layered tactile sensors. Human skin is also stretchable and viscoelastic, experiencing relaxation, creep, and hysteresis [58]. Since skin provides a desirable tactile response, its characteristics suggest an architecture for electronic skins to mimic.
In this work, we present and characterize a compliant multi-layer sensing structure with both enhanced sensitivity at low pressure and a sufficient range to cover most of the forces encountered in table 1. Our multi-layer architecture employs two strata, each consisting of a skin-covered foam (figure 2(d)). We had previously reported on the performance of touch-sensing 'skins' made by applying piezoresistive films onto rubber membranes, which were then placed over various padding layers [29, 59]. Fabrication of the sensing skins is simple, consisting of spray-coating an aqueous mixture of exfoliated graphite (EG) and latex onto a latex membrane. We use EG/latex because it is paintable and has a reasonably high GF, but the focus of this work is the multi-layer architecture, for which other sensors could be used just as well. The construction of multi-layer structures is also straightforward, and this layering approach is advantageous because it allows one to separately optimize the sensing skins and the foams for particular applications.
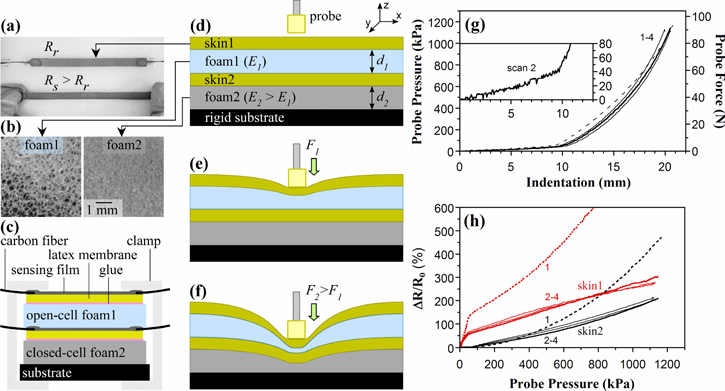
Figure 2. The multi-layer sensing system consists of a stack of skin+foam pairs ('strata'), with the foam stiffness (elastic modulus, E) increasing with depth. (a) Overhead photos of a sensing strip attached to a layer of soft foam and a second sensing strip being manually stretched. The stretched resistance Rs is greater than the relaxed resistance Rr. (b) Close-up photos of the soft open-cell foam 1 and the harder closed-cell foam 2. (c) Schematic of the multi-layer system. (d) A stack of two strata was used in this paper. (e) When light force is applied, the upper foam deforms. (f) When a larger force is applied, the soft upper foam is completely crushed and the bottom layer deforms, but it is able to sustain a larger force before being crushed. (g), (h) Performance of the 2-strata soft–hard system (foam pair A) under increasing indentation. The first scans are represented by dashed lines and the 2nd to 4th scans by solid lines; the line for scan 2 is heavier. Scan numbers are indicated. (g) Pressure (contact area 0.8 cm2) as a function of indentation. Inset: close-up showing pressures in the range of 0–80 kPa for the 2nd scan. (h) Normalized change in resistance of the two sensing skins versus pressure. The signal from the upper skin 1, over the soft foam, is shown in red, and the signal from the lower skin 2, over the hard foam, is in black.
Download figure:
Standard image High-resolution imageWhile many other tactile sensors have much higher sensitivity [19–21, 23, 25], the aim of this work was to investigate a new architecture that delivers a balanced combination of low pressure and high pressure performance in a simple and tailorable way. We have employed a piezoresistive film to demonstrate the feasibility of the sensing architecture, but we emphasize that the sensing architecture could in principle employ any stretchable 'soft' sensor [19–21].
2. Experimental methods
2.1. Sensing skin fabrication
Compliant piezoresistive strain-sensing skins (figure 2(a)) were made by blending conductive EG particles into a flexible matrix and coating the mixture onto a rubber membrane. The graphite (Asbury Graphite Mills, Inc.) exfoliation process [59], preparation of the composite [60], and spray-coating of the composite onto the latex membrane (ELE International, 0.3 mm thick) [29] have been reported previously. In summary, an EG dispersion was prepared from 10 g of EG prepared in a microwave oven, 1 liter of water, 7.5 g of surfactant (Triton X-100, Sigma-Aldrich), and thirty drops of antifoaming agent (SE-15, Sigma-Aldrich). To the 12.2 g of the dispersion was added 0.936 g of natural rubber latex (RD-407, ArtMolds). The coating pattern, a rectangle of 11 cm × 19.2 cm was formed by spraying over a template formed of painter's tape (ScotchBlue). A total of 10 layers were applied, air-drying for one minute between layers. The coated membrane was scissor cut along the 10.4 cm length into 24 strip-shaped pieces, each 0.8 cm wide. The resistance of the sensing strips was 2.37 ± 0.21 kΩ between the two edges. In this work the sensing layer was not covered by a protective coating, but we have shown that spraying an additional layer of mask-making latex over the surface can prevent damage due to rubbing [61].
The amount of EG in the sensing layer (25%) is above the percolation threshold, yet the layer remains stretchable. Under tensile strain, the distance between nanoparticles increases in the stretch direction, breaking some of the percolation pathways and resulting in an increase in resistance. The GF, defined as the relative change in resistance per unit strain, was 8 for these skins (section 1, supporting information (SI) is available online at stacks.iop.org/SMS/27/065005/mmedia) due to the inherent resistivity changes caused by disrupting percolation, compared with GF = 2 obtained from geometric effects. The skin's behavior, alone and on foam, was characterized in [29]. (The skins are compared with two commercially available compliant materials, carbon filled silicone and conductive fabric, in section 2, SI.)
Electrical connections to the composite sensing layer were formed with carbon fiber braids (The Composites Store, braided sleeves, 0.1'' diameter). Carbon fibers have a smaller diameter and are more flexible than fine multi-strand metal wire, and they have a low contact resistance to the composite, resulting in superior adhesion and good electrical contact. The braid was cut to the required length and two bundles of carbon fibers were pulled from it. A 1 cm length at the end of the bundle was spread out and laid over the strip. Drops of the EG suspension were applied by pipette onto the overlapping area and air dried. The carbon fibers were completely embedded in the latex/EG composite after applying 8 drops, forming a robust connection (section 3, SI). The carbon fiber was in turn connected to multi-strand Cu wire (Alpha Wire Corp., 26 AWG, PVC insulation) with heat shrink tubing (NTE Electronics, Inc. 1/16'', HS-ASST-10), applying hot air (Aoyue, 852 A++ repairing system) for 1 min. The total resistance of the strip, including the connections, was 2.43 ± 0.22 kΩ. The resistance of the connections was small compared to that of the sensing layer (3%).
2.2. Foams
Two foam combinations were used in this work. In foam pair A (figure 2(b)), the top foam was an open-cell poly(urethane-ether) (thickness d1 = 12.5 mm, 'standard medium foam', foamforyou.com, Foam N' More and Upholstery Inc., Clawson, MI), and the bottom one was an ethylene-vinyl acetate foam (d2 = 12.5 mm, BalanceFrom BFPM-01GY, puzzle exercise mat). In foam pair B, the top foam was an open-cell poly(urethane-ether) ('plush/soft foam', foamforyou.com, Foam N' More and Upholstery Inc., Clawson, MI), and the bottom one was a closed-cell nitrile rubber. In the soft–hard configuration with foam pair B, the thickness of the soft foam was d1 = 12 mm and the thickness of the hard foam was d2 = 19 mm. In the soft–soft configuration, the soft foam of pair B was used with d1 = 12 mm, d2 = 25 mm. In the hard–hard configuration, the hard foam of pair B was used with d1 = 9 mm, d2 = 19 mm.
Foam stiffness was characterized by indentation load deflection (ILD), obtained by measuring the load required to reduce the thickness of a 1 cm × 1 cm × 1 cm sample by 25%. The load was measured with the force transducer (Bose 3330 Series II), and ILD numbers were calculated as the ratio of loading to area (N cm−2). For foam pair A, the ILD of the top layer was 0.4 N cm−2, and that of the bottom layer was 6.3 N cm−2, meaning that the bottom layer was nearly 15 times stiffer. For foam pair B, the ILD of the soft foam was 0.14 N cm−2, and that of the hard foam was 13.34 N cm−2, meaning that the hard foam was nearly 100 times stiffer.
2.3. Indentation tests
The sensing strips were attached to the foams using adhesive (Krylon, Repositionable Spray Adhesive 7020) to keep them from moving during testing (figure 2(c)). The skin + foam strata were aligned so that the 8 mm wide strips were positioned directly over each other. The two strata were held together by clamping at the four corners to a rigid support. To prevent the clamp from penetrating into the soft foam, rigid plates were placed between the soft foam and the clamps.
Out-of-plane indentation tests were performed with a force transducer (Bose 3330 Series II) outfitted with a polytetrafluoroethylene probe with either a circular flat-bottom (dia. = 1, 2 and 4 cm) or a spherical shape (dia. = 0.95 cm). The force and indentation were obtained from the output of the transducer (2048 pts/30 s scan time). Pressure was calculated from the force and the probe cross-sectional area.
Sensor resistance was measured with a voltage divider circuit, with the sensor connected in series with a known, fixed resistor (5 kΩ). A voltage source (Hewlett-Packard 6236B triple output power supply) was used to apply a constant 5 V, and the voltage over the sensor was measured using a data acquisition system (NI USB-6009, 14 bit, at 5 kHz sampling rate). The two sets of measurements were synchronized by aligning the peaks of the signals, as previously described [29]. The resistance data were smoothed by averaging 20-point intervals.
Unless specified otherwise, the flat-bottom probe with a diameter of 1 cm was used in the indentation tests. Four cycles were performed sequentially at a constant speed of 4.5 mm s−1, separated by 5 min intervals.
2.4. Tensile tests
The same force transducer (Bose 3330 Series II) was used for tensile tests, and the same voltage divider circuit was used for recording the sensor signal. The sensing strips were held vertically, with one end being attached to the moving part of the transducer and the other end fixed (for details, see section 1, SI). Four scans were performed on each sensing strip, and results from the 2nd to 4th scans are shown in section 3.3. All the tests were repeated on another set of sensing strips; similar behavior was obtained.
2.5. Shape freezing
To freeze the membrane shape under load, a two-part epoxy resin and hardener (EpoxAcas, 30 g epoxy resin (650 part A), 3.6 g hardener (101 fast hardener part B)) was mixed and then poured onto the deformed surface around the probe. The epoxy became rigid after 4 h at room temperature.
3. Results and discussion
3.1. Response characterization
3.1.1. Response to indentation
As illustrated in figure 2(d), the multi-layer sensing system consisted of two layers of foam (figure 2(b)) having different stiffness, each surmounted by a strip-shaped sensing skin (figure 2(a)). Basic indentation tests were performed to obtain the mechanical and electrical responses. Figure 2(g) shows the pressure and force as a function of probe depth. (Unloading curves are shown in SI section 4.) Up to an indentation of 10 mm, nearly up to the d1 = 12.5 mm thickness of the upper soft foam layer (foam 1), the pressure increased linearly, to 38 kPa (3 N). The slope then increased as the probe began to deform the lower hard foam layer (foam 2). The maximum indentation was 20 mm, which is 80% of the 25 mm original total foam thickness and more than half-way into the d2 = 12.5 mm thickness of the lower hard foam. All four scans were similar, as evident from the overlapping curves. Thus, the membranes and foams did not exhibit mechanical first cycle memory effects. The noise (figure 2(g) inset) is due to the limited force resolution when the widest range setting is used for the force transducer (±3000 N). (With a 10 bit digitization of the signal, the force resolution was limited to approximately 3 N.)
The relative change in resistance of the two sensing skins is shown in figure 2(h) as a function of pressure. The resistance increases because electrical conduction is by percolation in the EG nanoparticle network, and some percolation paths are disrupted when the particles separate under strain. This is in contrast with materials whose resistance decreases with strain, such as conductive fabrics, in which the fibers in the weave make better electrical contact under stretching. However, it is important to note that conductive fabrics and other sensors can still be used in place of the EG sensing material, since the architectural principle does not depend upon whether the GF of the sensing material is positive or negative.
The signal was larger during the first scan (due to memory effects, section 3.3.1), and then it was similar in the remaining three scans. (See section 4 in the SI for a discussion of first cycle effects.) This behavior can be attributed to break-in during the first cycle in viscoelastic materials such as foams and elastomers, which is known as the Mullins effect [62] in filled rubbers. For skin 1 at low pressure (up to 38 kPa, 0–10 mm), the sensitivity was high and substantially linear (initial slope = 1.3%/kPa or 17.6%/N in the 2nd scan), and the relative change in resistance was an easily measurable 60%. The sensitivity then gradually decreased, and above a turnover region it became linear again (above 250 kPa, slope = 0.2%/kPa or 2.9%/N for scan 2). At 1125 kPa, the change in resistance was over 250%. The utility of a monotonic, bilinear relationship should be emphasized.
For skin 2, which was sandwiched between the foam layers, the output was almost zero at low pressure, since it remained unstrained while only the upper foam experienced compression. At the turnover point for skin 1, corresponding to the corner in the force–indentation curve, the resistance of skin 2 began to increase as the foam under it was indented. Its slope was similar to that of skin 1, since both signals followed the deformation of foam 2.
The piezoresistive latex/EG sensors respond to strain [29], so the resistance of the skins reflects the surface deformations of the foams. The higher sensitivity at low forces is due to deeply indenting the soft foam 1 without much pressure (figure 2(b)). The signal from skin 1 does not saturate after foam 1 is completely crushed because the membrane continues to stretch as indentation of foam 2 begins (figure 2(c)). Because foam 2 is stiffer, there is less strain per unit force, and thus a relatively smaller change in resistance. The similar slopes for the signals from the two skins indicates that they undergo similar net changes in strain once foam 2 starts to collapse.
Comparing sensitivity with other sensing systems is challenging because of the variety of metrics reported (V, N,%, Ω/Pa, A/Pa, %/Pa [10]). A conducting polymer array showed 0.1%/kPa up to 30 kPa [63] and a conductive network of carbon nanotubes on PDMS reported 360%/kPa to 0.1 N [64]. The difficulty of balancing sensitivity and range is demonstrated by these examples, as is the utility of our approach for achieving both (1.9%/kPa up to 31 kPa and 0.055%/kPa to 1.2 MPa). The sensitivity in our system could be further increased simply by using an even softer top foam.
The displacement resolution of the measurement setup was derived from the noise level of the signal. The resolution is commonly determined by using the root mean square (rms) noise of the signal [65]. We obtained the rms noise by taking the standard deviation of ΔR/R0 over a 5 s period with no indentation, and it was 0.0055. From the ΔR/R0 versus pressure and pressure versus indentation curves (figures 2(g), (h)), the displacement resolution in terms of variation in indentation was determined as 0.1 mm (i.e., the indentation level corresponds to the ΔR/R0 noise level of 0.0055). This is not a limit of the sensing system, but of the measurement system.
3.1.2. Effect of contact area
The contact area for human–robot interactions may be as small as a fingertip or as large as a hand. The effect of contact area on the sensing signal is thus examined here. In this system, strip-shaped sensors were used whose width w = 0.8 cm was less than the probe diameter d. We hypothesized that the piezoresistive signal would be independent of probe area if, for d > w, the strips are only strained at the probe edges, not underneath the probe (see section 3.2.3.1).
Three flat-bottom probes were used with diameters of 1, 2 and 4 cm (areas of 0.8, 3.1, and 12.6 cm2, respectively). Figure 3 shows results from the second to the fourth cycles. As expected, while larger probes generated larger forces at the same indentation (figure 3(a)), they produced the same pressures (figure 3(b)). Figure 3(c) shows the normalized change in resistance of skins 1 and 2 as a function of force; ΔR/R0 for both were greater when the contact area was larger. When plotted as a function of pressure, the electrical responses overlapped (figure 3(d)) for all three probes. These results indicate that the architecture can be used effectively as either an indentation sensor or a pressure sensor with strip-shaped sensors.
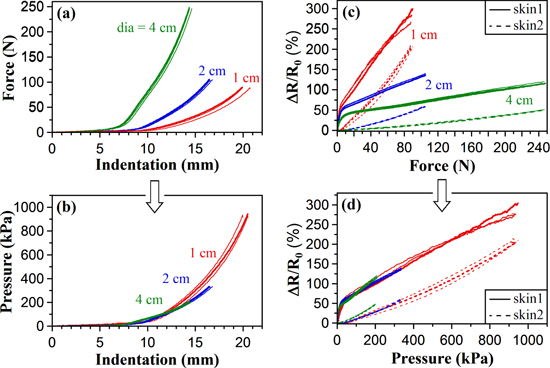
Figure 3. Effect of contact area. (a) Force versus indentation replotted as (b) pressure versus indentation for three probe sizes. (c) Corresponding normalized resistance change as a function of (c) force and (d) pressure for the two sensing skins. (scans 2–4, foam pair A)
Download figure:
Standard image High-resolution imageIt may seem surprising that a strain sensor can be used as a pressure sensor. This is a consequence of w < d, making the sensing system quasi-one dimensional (1D) so that the strip is always deformed by just the two edges of the probe (see sections 3.2.2 and 3.2.3), and also of the sensor's stretchability.
3.2. Understanding the sensor response
In this section the reasons for the behaviors observed above are examined. First, the postulated roles of the foams are confirmed. Next, the deformed shapes of the membranes and foams are examined. Finally, the foam behaviors are modeled.
3.2.1. Comparison with other configurations
The question may be raised, is it necessary to have foams of different stiffness, or can two strata with the same foam stiffness achieve a similar result? In order to determine the benefit of using a combination of foam stiffnesses (soft–hard), three other foam combinations were examined (figure 4(a)): two layers of the soft open-cell foam (soft–soft, d1 = 12.5 mm, d2 = 12.5 mm), two layers of the stiff closed-cell foam (hard–hard, d1 = 12.5 mm, d2 = 12.5 mm), and a thin layer of soft foam with no second foam (soft–rigid, d1 = 12.5 mm).

Figure 4. Comparison of the performance of four configurations. (a) Schematic representations of the three new configurations. (b) Pressure as a function of indentation. (c) Relative change in resistance as a function of pressure from the upper (solid line) and lower (dashed line) skins. (Foams from pair A.)
Download figure:
Standard image High-resolution imageThe pressure versus indentation curve for the soft–rigid system (figure 4(b), light blue) followed the one for the soft–hard system (red) to an indentation of almost 10 mm (the thickness of the foam), but then shot up rapidly as the probe made contact with the rigid substrate. The signal from skin 1 over soft–rigid, shown in figure 4(c), had a high initial slope, like those of the soft–soft and soft–hard systems, but it then saturated once the thin layer of foam was crushed, for a maximum ΔR/R0 of 90%. As expected, this system demonstrated relatively high sensitivity but low range. The response of skin 2 was small across the entire range (<20%) since it rested directly on the rigid substrate and experienced negligible strain.
The pressure–indentation curve for the soft–soft system (dark blue) also followed the one for the soft–hard system to an indentation of almost 10 mm, but then instead of increasing, the pressure remained low. The signal also initially followed that of the soft–hard system, but the higher sensitivity range was extended. Skin 2 began responding when the second foam layer began to deform (above 37 kPa).
The force–indentation curve for the hard–hard system (green) was similar to that of the soft–hard system, but shifted leftward toward the origin because the indenter touched the harder foam surface immediately. The initial slope of the skin 1 signal was, as expected, substantially lower than that of soft–hard due to the much smaller strain under the same force. The signal from skin 2 was smaller than from skin 1, and also smaller than the signal from skin 2 in the soft–hard system, since the high stiffness of the overlying foam in the hard–hard system induced a smaller strain in this sandwiched skin.
Comparing the various curves, the behavior of the soft–hard system combined the sensitivity of the soft foam and the wide range of the hard one. The indentation tests were repeated on duplicate sensing skins (section 7, SI). The curve shapes and the distinct behaviors were repeated, although the amplitudes varied, mainly due to the different loading histories of the skins, whose viscoelastic behavior has been widely recognized [66, 67] (see section 3.3.1).
These experiments confirm that a soft–hard combination is required and that the force range for each layer is determined by its thickness. By adjusting the absolute and relative thicknesses and stiffnesses of the foam layers, one can adjust the slopes and corner of the bilinear curve. A combination of foams is therefore a good approach to prevent the padding thickness on a robot from becoming unwieldy. Although the concept for enhancing the performance of the sensing system has been demonstrated using two layers, it is possible to use additional layers or even employ a continuous stiffness gradient.
3.2.2. Deformed shape from sensor-indenter interaction
Section 3.1.2 showed that the sensor response was independent of probe area, suggesting that at a given indentation the net strain of the sensing skin was the same, since the GF is almost constant with strain. In order to validate this hypothesis, the deformations of latex membranes over a soft foam (from pair A) under an applied indentation were 'frozen' using epoxy. Since epoxy soaks into foam, a square latex membrane was used instead of strips; we assumed the deformation, although somewhat different, would nevertheless provide insight.
Membranes deformed around flat-bottomed probes of 1 and 4 cm diameter are shown in figure 5. (For further discussion of the deformation, see SI, section 6.) Since the membrane area in contact with the probe bottom remains flat, the curved edges were compared by overlaying the images. The shapes were found to be equivalent (figure 5(c)). This accounts for the piezoresistive signals (figure 3(d)) being the same.
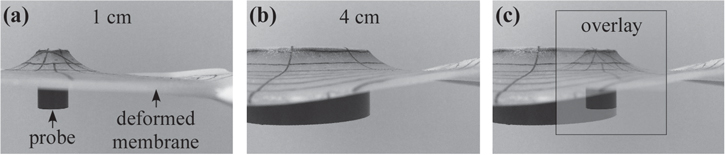
Figure 5. Deformed shape around indenter probes with diameters of (a) 1 cm and (b) 4 cm. (c) Overlay of the two images.
Download figure:
Standard image High-resolution image3.2.3. Modeling
In order to design the sensing architecture for obtaining a desired performance, it is necessary to understand the signal versus pressure result in figure 3(d) and the responses of the different foam systems in figure 4. Since the resulting strain in the skin depends on how the interaction between the indenter and the foam affects the shape of the foam surface, we begin by modeling that shape.
3.2.3.1. Determination of surface shape
The shapes of the deformed foams were determined using photographs taken at a series of indentations (figure 6). For this work, foam combination B was used with the spherical probe (0.95 cm dia.).
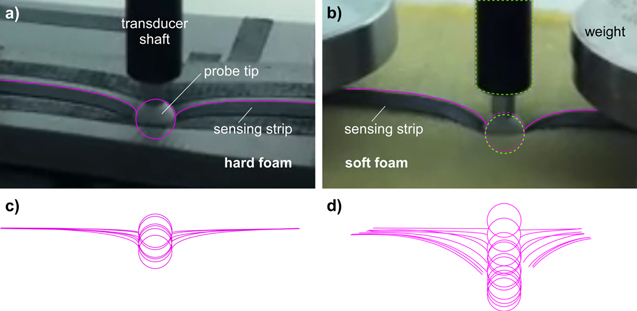
Figure 6. Photographs were taken at various stages during indentation of the (a) hard–hard and (b) soft–soft systems. The deformed strip shapes were fit visually (pink lines). For indentations so deep that the probe tip disappeared from view, the known position of the probe tip relative to the probe shaft (green) was used. (c), (d) Overlaid positions of the probe tip and the surface contours at different indentations. The deeper surface contours in (d) are incomplete because parts of the strip disappeared from the view of the camera.
Download figure:
Standard image High-resolution imageOnce the surface was traced, these curves were fit to a function. For elastic bodies under line (knife-edge) loading, derived for bodies that are large compared with the contact area, the theoretical decrease in stress intensity with distance x from the knife-edge goes as 1/x [68]. We therefore used

where the outer edge of the probe is at x0, A is the indentation at x0, and f(x) is the indentation of the foam at a distance x distal from x0. At the edge, x = 0 and f(x) = A. Far from the edge, f(x) = 0. Using a value of x0 = 0.4 cm provided the best fit to the experimental curve shape for both foams: their surface shapes were similar at the same indentation. It also fit the shape of the membranes shown in figure 5, confirming that the foam deformation determines the sensor strain.
3.2.3.2. Hard foam surface strain model
The second step in the modeling was to obtain the strain associated with the shape change. For simplicity we assumed that there was no strain under the probe tip itself, as illustrated in figures 7(a), (b), i.e. the probe merely pushes the surface under it downward. The deformation is symmetric around the probe, so only a half-space was considered. The total strain ε at an indentation δ = 1 was determined by summing the strains along the curve of equation (1), resulting in an increase in arc length Δh = 0.3. The strain occurred entirely within a distance of x = 3 cm from the edge of the probe. A linear relationship was postulated between strain ε and indentation δ (figure 8(a)):

where L0 is the original sensor length (5 cm measured from the center of the probe).
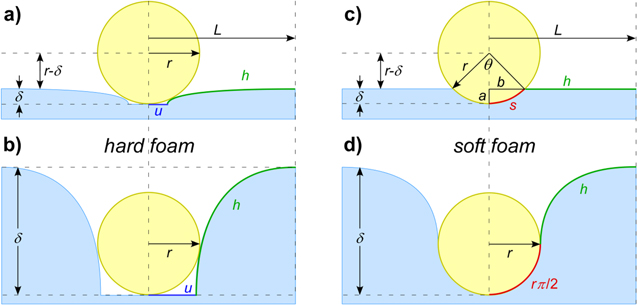
Figure 7. Surface strain model for hard (a), (b) and soft (c), (d) foams. Illustration of hard foam cases when (a) δ < r and (b) δ > r. (c) For soft foam, when the indentation δ is less than the probe radius r, the surface deforms by wrapping around the spherical indenter. (d) When δ > r, the surface beyond the indenter is also pulled downward.
Download figure:
Standard image High-resolution image
Figure 8. Model strain (red) for the hard foam as a function of (a) displacement (indentation) and (b) force, compared with the experimentally observed change in resistance (black).
Download figure:
Standard image High-resolution imageThe third step was to relate the strain to the force. The measured displacement–force relationship for the hard foam was employed to display the model strain as a function of force. The model is compared to the experimental signal in figure 8(b), where the maximum values were matched across the two axes. Prior work [29] on the sensing skins had shown that ΔR/R0 is proportional to uniaxial strain, as expected for a constant GF. For these strips GF = 8 (SI section 1), so a normalized resistance change of 44 corresponds to a strain of 5.5%, close to the 6% predicted by the model. The agreement of the model and experimental curve shapes was excellent given the simplicity of the model and the fact that it had one fitting parameter, x0.
3.2.3.3. Soft foam surface strain model
Applying the hard foam model to the soft foam results, the fit was not as good, as shown by the red curves ('1/x') in figure 9: the experimental data ('exp') had a steeper initial rise and a more defined corner. (The noise in the experimental curves was due to the limited force resolution when using a large force range on the transducer.)

Figure 9. Model strains for the soft foam as a function of (a) displacement and (b) force, compared with the experimentally observed change in resistance (black). The red lines represents the simple 1/x model, the blue lines a model that takes into account deformation around the probe tip.
Download figure:
Standard image High-resolution imageA revised model was therefore explored, based on the observation (figure 6(d)) that for indentations of the probe up to half the probe radius, there was little downward motion of the surrounding surface. It appeared that the foam was conformal around the tip and only with greater indentations showed the 1/x behavior. The soft foam model is illustrated in figures 7(c), (d). For this case, a separate treatment is required for indentations less than and greater than the radius.
3.2.3.3.1. Indentation less than the probe radius, δ < r
When the displacement δ is small the deformation of the soft foam can be treated as occurring solely around the indenter, which has radius r (figure 7(c)). By symmetry we considered the half plane. The length along the surface is approximated by the sum of two pieces: a linear segment h between the probe and the edge of the strip at L, and an arc s around the indenter. The strain ε is then given by

where L is the length of the sensor. When the displacement is less than the probe radius, using the definition of the arc length,

Next find θ by relating it to the height of s and the radius r,

where a = δ. Substituting,

Next find h.

Again use geometry to find b:

Then, substituting and simplifying,

The strain is then given by:
3.2.3.3.2. Indentation greater than probe radius, δ ≥ r
The foam wraps around the indenter for half the radius and is pushed downward the remaining fraction, δ − r, as shown in figure 7(d). The segment s has a constant length of rπ/2. The shape of the segment h is again given by equation (1). The strain is then given by:
This prediction of this model is shown by the blue lines ('def+1/x') in figure 9, and it provided a good shape fit. The soft and hard foam models are identical above 5 mm, but the soft–soft foam undergoes greater strain at small indentations.
3.2.3.4. Two-layer modeling
3.2.3.4.1. Analytical model
The strain for the soft–hard model is the sum of the strains in the soft and hard foams. This is equal to the strain in the soft foam when the indentation is less than the soft foam thickness, and the maximum strain in the soft foam plus the strain in the hard foam when the indentation is greater. The predicted surface strains for the three foam configurations are shown as a function of indentation in figure 10(a), together with the experimental signals. Since the strain–indentation curves were the same for the soft and hard foams for δ > r, the soft–hard model was identical to the soft–soft model, as shown by the overlayed solid red and blue curves in figure 10(a). However, this model did not account for the behavior. The soft–hard signal deviated from model above 12 mm (the location of the interface), showing an unexpected increase in sensitivity. The soft–hard system behaved (black curve) as if, after a total indentation of 10 mm, the strain at the surface of the hard foam was twice as great as usual, i.e., as if the hard foam stiffness was reduced. The SI (sections 7 and 8, SI) shows that this change in slope of the skin 1 signal also occurred at the interface of a hard–hard system, suggesting that the interface is responsible. The behaviors of the three systems are shown as a function of force in figure 10(b).
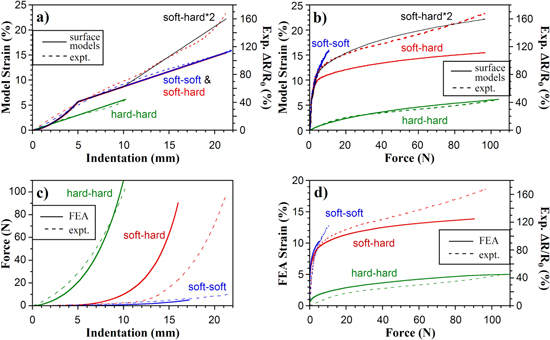
Figure 10. (c) Strain versus indentation from 1/x surface shape models (solid lines) compared with the experimental results (dashed lines). (d) Strain versus force using 1/x model and experimental force versus indentation curves. (a) Force versus displacement curves from FEA simulations of three configurations (solid lines): soft–hard, hard–hard, and soft–soft compared with the experimental results (dashed lines). (b) Strain versus force FEA results.
Download figure:
Standard image High-resolution image3.2.3.4.2. Finite element analysis (FEA)
Taking another approach, an axisymmetric two dimensional FEA model (SolidWorks, Dassault Systèmes) was used to model three of the configurations. The top layer thickness was set to 10 mm and the bottom layer thickness to 20 mm. The material behavior was assumed to be hyperelastic and incompressible under biaxial compressive stress and described by the Mooney–Rivlin model.
The force versus displacement curves predicted by the model at the top surface are compared with the experimental curves in figure 10(c). Again, the behaviors matched fairly well for the soft–soft and hard–hard pairs, but the predicted force for the soft–hard combination was higher than that from the experiment. Strain on the top surface versus force was also obtained from the FEA simulation (figure 10(d)). The model again showed reasonable agreement for the soft–soft and hard–hard configurations, but the predicted slope of the signal was too low for the soft–hard configuration because of the over-prediction of the stiffness. Again, the hard foam in this configuration behaved as if it were softer. Thus, neither the FEA method nor the surface model could account for the soft–hard behavior, possibly because they did not account for interfacial effects.
3.3. Temporal effects
Now that the quasi-static behavior of the skins on the foams has been examined for a base-case time interval and loading rate, we turn to an examination of temporal effects. Human–robot interactions may occur at different time scales (e.g., a robot bumps into a hard object at high speed or experiences repeated touches at short time intervals). Due to the viscoelasticity of the sensing membranes and the foams, the response of the sensing structure will be rate and history-dependent. This is not fatal: even sensors with very long relaxation time constants can be successfully applied in robotics [69, 70].
3.3.1. Memory effects
In the previous sections, ΔR/R0 was presented, where R0 was the resistance at the beginning of each cycle. Here we directly examine the voltage drop Vs over skin 1 in the soft–hard system, which was in a voltage divider circuit (section 2.3). The sensor had never been strained before and had an initial voltage reading V0.
Figure 11 shows the voltage in response to a first indentation of 22.5 mm followed by two smaller indentations of 17 mm. There was an immediate increase in the voltage when the probe indented the surface. After the probe left the surface in the first cycle, the voltage initially dropped rapidly, but it did not return to the original baseline V0, instead gradually settling at a new, higher baseline V'0. After the next indentations, the voltage again returned to the new baseline V'0, at the same rate as for the first indentation. (We have previously fit the recovery response using a generalized Maxwell model with two time constants; see SI for [29].) After the baseline shift, the subsequent cycles were relatively stable. The higher baseline resistance after the first cycle explains the smaller signals ΔR/R0 in later scans seen in figure 2(h).

Figure 11. Voltage over skin 1 in a soft–hard system (foam pair B) during indentations to the indicated depths (spherical probe 0.95 cm dia., 4.5 mm s−1).
Download figure:
Standard image High-resolution imageAll three signals had comparable amplitudes above the new baseline. This result suggests that memory effects could be substantially mitigated by using the resistance baseline after an event as R0, rather than the one before it (see SI, section 9), although such an approach may not be practical in some real-time applications. Alternatively, prior work has shown that empirical models based on sensor characterization can be developed for viscoelastic materials, allowing accurate estimates of applied pressure [67].
3.3.2. Effect of time interval
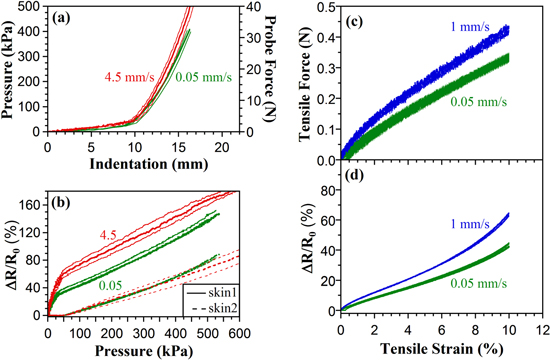
Because of the relaxation time (figure 11), the time interval between loading events changes the signal amplitude. Four consecutive indentation loading cycles with short to long intervals between cycles were performed on the multi-layer sensing system. To examine the response of the sensing membrane alone, tensile tests were also performed with varying time intervals.
Figure 12(a) shows pressure as a function of probe indentation for the second to the fourth cycles. The mechanical responses were independent of the interval: the results overlap. Figure 12(b) shows the corresponding signals from the two sensing skins. The signals from skin 1 for time intervals of 2–10 min were almost the same, but for the shorter time interval of 30 s the signal from skin 1 was lower. The region of the skin 1 curve that was affected by the time interval was the high-slope region (which decreased from 1.6 to 1.2%/kPa) at pressures less than 50 kPa, associated with the compression of foam 1. The slopes associated with foam 2, for both skins 1 and 2, were unaffected by the time interval, suggesting that the time interval dependence arises from foam 1.

Figure 12. Effect of interval time between loading cycles. (a) Pressure versus probe indentation for the soft–hard system (foam pair A, 4.5 mm s−1). (b) Normalized change in resistance of the two sensing skins versus indentation pressure. (c), (d) Tensile tests on a stand-alone sensing skin (1 mm s−1). (c) Tensile force versus tensile strain. (d) Normalized change in resistance of the two sensing skins versus tensile strain.
Download figure:
Standard image High-resolution imageFigure 12(c) shows force as a function of strain in the tensile tests on the sensing skin alone. All the curves overlapped, showing that the mechanical recovery is faster than the shortest interval (15 s). Figure 12(d) shows the piezoresistive responses. These curves did not stop overlapping until 15 s. Thus, the soft foam is the main contributor to recovery effects in this system and the behavior of the sensing skin on a foam is dominated by the foam to which it is attached.
3.3.3. Effect of loading rate
Loading rates would likewise be expected to affect the response. Loading rates were therefore compared for both the soft–hard system and the sensing skin alone. Four cycles were performed at each rate, with time intervals between cycles of 5 min.
The faster loading rate resulted in a slightly higher pressure on the multi-layer system (figure 13(a)) and a correspondingly larger signal from skin 1 (figure 13(b)). Just as in figure 12(b), the part of the curve responsible for the dependence was the low pressure region corresponding to the compression of foam 1. Above 50 kPa, associated with compression of foam 2, there was no change in slope with rate, and the slope was similar for skin 2.
Figure 13. The effect of loading speed during indentation of the multi-layer system (2nd to 4th scans). (a) Pressure and force versus probe indentation. (b) Normalized change in resistance of the two sensing skins versus pressure. In a stand-alone membrane, (c) tensile force and (d) normalized change in resistance versus tensile strain.
Download figure:
Standard image High-resolution image
The responses of a stand-alone skin are shown in figures 13(c) and (d). The mechanical stiffness was greater at the higher rate, as was the ΔR/R0 signal. Interestingly, the performance of a compliant sensor on a foam may be less rate dependent than it would be alone, as evidenced in figure 13(b) by the nearly identical curves at the two loading rates for skin 2.
4. Conclusions
Compliant sensing skins face the challenge of achieving both reasonably high sensitivity and a sufficiently large sensing range. The multi-layer foam system investigated in detail in this paper offers a simple solution by splitting the two goals so that each is handled by a different stratum. The upper stratum, having a softer foam, provides higher sensitivity at light touch, while the bottom stratum, having a stiffer foam, extends the range. This approach allows the sensitivity and range to be separately tailored for a given application: by tuning the stiffness and thickness of the foam layers, the pressure versus indentation curve and the associated resistance versus pressure curve can be manipulated. This simple sensing concept is remarkably effective. The benefit of the multi-layer approach was validated by comparison with three other foam stiffness combinations. Due to the quasi-1D shape of the piezoresistive strain-sensing skins, their stretchability, and their placement on foam, they behaved as pressure sensors.
The compliant components of the multi-layer sensing structures are all inherently viscoelastic, rendering the signal time- and history-dependent. First-cycle effects were due to a long-term shift in the baseline resistance of the skin after the first touch. Memory effects were primarily contributed by the soft open-cell foam. Even with these viscoelastic properties, the simplicity of the design and the ability to tailor the response to the pressure ranges of interest make the multi-layer approach attractive for robot tactile skins that cover the robot body.
Acknowledgments
Funding for this research was provided by NSF through the National Robotics Initiative (NRI) under award number IIS1317913.