
Abstract
The vibrations of mechanical systems and structures are often a combination of periodic and random motions. Emerging interest to exploit nonlinearities in vibration energy harvesting systems for charging microelectronics may be challenged by such reality due to the potential to transition between favorable and unfavorable dynamic regimes for DC power delivery. Therefore, a need exists to devise an optimization method whereby charging power from nonlinear energy harvesters remains maximized when excitation conditions are neither purely harmonic nor purely random, which have been the attention of past research. This study meets the need by building from an analytical approach that characterizes the dynamic response of nonlinear energy harvesting platforms subjected to combined harmonic and stochastic base accelerations. Here, analytical expressions are formulated and validated to optimize charging power while the influences of the relative proportions of excitation types are concurrently assessed. It is found that about a 2 times deviation in optimal resistive loads can reduce the charging power by 20% when the system is more prominently driven by harmonic base accelerations, whereas a greater proportion of stochastic excitation results in a 11% reduction in power for the same resistance deviation. In addition, the results reveal that when the frequency of a predominantly harmonic excitation deviates by 50% from optimal conditions the charging power reduces by 70%, whereas the same frequency deviation for a more stochastically dominated excitation reduce total DC power by only 20%. These results underscore the need for maximizing direct current power delivery for nonlinear energy harvesting systems in practical operating environments.
Export citation and abstract BibTeX RIS
1. Introduction
The acceleration of interest to deploy wireless sensors for structural health monitoring applications has stimulated a need to realize sustainable device platforms for self-sufficient monitoring [1–3]. The few milliwatts required for sensor operation [2, 4] suggest that electric power resources other than traditional batteries may be adequate to meet the relatively minor, albeit functionally critical, demand. This has propelled interest to harvest ambient vibration energy found in the monitored structure environment as a novel resource to sustain the wireless devices and eliminate the requirements for regular battery replacement [5–7]. Vibration energy harvesting using piezoelectric elements has demonstrated advantages of high energy density favorable for the small scale ambient energy available and opportunity to collocate the harvester with the compact wireless sensors [8, 9]. Electrical power output from linear piezoelectric vibration energy harvesters is dependent upon the electromechanical coupling [10], resistive load [11, 12], and rectification circuit design [13, 14]. As a result, attention has turned to optimizing the performance of linear vibration energy harvesters [15–18]. Because the large power output from linear harvesters is associated with narrow band resonance phenomena, optimization studies often obtain insight on steady state harvester operation.
In fact, realistic vibrations of structures and systems to be monitored contain combinations of harmonic and stochastic kinetic energies [19–21]. Due to the linearity of certain classes of energy harvesters, predictions of device performance under such complex excitation scenarios are easily achieved using principles of linear superposition. On the other hand, the narrow band frequency sensitivities of linearly resonant energy harvesters has motivated studies of energy harvesters using stiffness nonlinearities that provide broader frequency bandwidth for large electric power generation [22–24]. For nonlinear device platforms, superposition does not immediately hold. This is partly explained by the fact that non-unique dynamic responses may be achieved for the same excitation conditions, according to the sensitivity to initial conditions. Of the stiffness nonlinearities considered, energy harvesters with bistable nonlinearities may undergo large amplitude snap-through responses that are favorable for ambient vibration energy harvesting [25–28]. Yet, the non-uniqueness of electromechanical responses more greatly challenges the theoretical prediction of nonlinear energy harvester dynamic behaviors than for the linear counterparts [29]. Consequently, rigorous theoretical efforts have been undertaken to uncover best practices of deploying these nonlinear harvester platforms. Specifically, alternating current (AC) power outputs from nonlinear energy harvesters are revealed to be substantially governed by the harmonic excitation frequency and amplitude [30] as well as by the load resistance under harmonic [31] or random excitations [32, 33].
Yet, the practical implementation of nonlinear energy harvesters requires consideration of direct current (DC) power delivery to the wireless sensors, in which case the nonlinearities of the rectification circuitry cannot be neglected. To shed light on this complex yet critical operating scenario, the authors proposed and validated an analytical approach that facilitates predictions of the electromechanical responses and DC power generation from nonlinear energy harvesters driven by combinations of harmonic and stochastic base accelerations [34]. In the work [34], the passive diode bridge rectifier is considered to be coupled with the nonlinear energy harvesting system. While simple in composition, the nonlinear characteristics of the standard bridge rectifier are typical of more advanced circuits [35–37] that use full-wave rectification as a first stage to general power conditioning. Parametric studies using the analysis were undertaken in [34], while first insights into the sensitivities of nonlinear energy harvesters to sustain DC power delivery were obtained from model exercises.
Despite the emerging model formulation, a clear omission of understanding remains on the optimality of deploying nonlinear energy harvesters in combined harmonic and stochastic excitation environments [34]. On the other hand, researchers have considered a sub-set of such problems by attention to nonlinear energy harvesters subjected to pure harmonic excitations optimized for AC power delivery [38]. Yet, because the prior work [34] revealed considerable influences of the combined excitation form in governing the overall electromechanical dynamics and because the inclusion of rectification circuitry for DC power is well-known to strongly influence piezoelectric energy harvester behaviors [11, 15], a need remains to illuminate how to optimize nonlinear piezoelectric energy harvesters deployed in practical operating environments where arbitrary combinations of harmonic and stochastic base accelerations are realized.
To close this knowledge gap, this research builds beyond the authors' analytical framework [34] to devise optimization schemes for maximum DC power delivery from nonlinear piezoelectric energy harvesters subjected to harmonic and stochastic excitation. Through such investigations, this work creates new insight on how nonlinear vibration energy harvesters may be effectively utilized for practical DC power generation despite concerns pertaining to non-unique dynamic behaviors. The following section introduces the experimental setup that provides motivating evidence of the need to optimize such nonlinear harvesters when the excitations deviates from conditions of pure harmonic excitation. Then, the analytical framework is briefly surveyed, after which the methods of DC power optimization are established. Comparisons among analytical, numerical simulation, and experimental results verify and validate the new theoretical optimization approach. Then, studies are undertaken to broadly assess the design and deployment sensitivities of optimal nonlinear energy harvesters to combined excitations. The major findings are summarized in the last section.
2. Experimental platform construction and motivation results
Here, the experimental setup is introduced and preliminary experimental results are provided to motivate the subsequent analytical optimization formulation.
2.1. Experimental platform overview
As shown in figure 1, the nonlinear vibration energy harvester is constructed by a piezoelectric cantilever beam (Midé Technology, PPA-2014) with steel extensions at the free end. The cantilever is clamped to an aluminum mount that is fixed to an electrodynamic shaker. The steel extensions at the beam end are acted on by a pair of neodymium magnets that apply attractive forces to oppose the direction of linear elastic forces [39]. This kind of magnetoelastic structure has been shown to exemplify a broad range of nonlinear behaviors, especially those associated with softening and bistable nonlinearities [39–41]. By tuning the distance between the magnet centers to be Δ = 7.775 mm and by adjusting the distance from the beam tip to the plane of the magnet top surface to be δ = 3.28 mm, the harvester beam is acted upon in a way to induce bistability. More general nonlinearities induced by the magnetic forces are studied in section 4.4. The length of the piezoelectric cantilever with extension is L = 60.4 mm, while the mass of the steel extension is mt = 9 g. As shown by the schematic in figure 1(b), a standard diode bridge circuit, constructed by four diodes (1N4148), is connected to the piezoelectric beam electrodes. The bridge rectifies the AC voltage  from the piezoelectric beam to a DC voltage
  across the resistive load R and smoothing capacitor Cr.
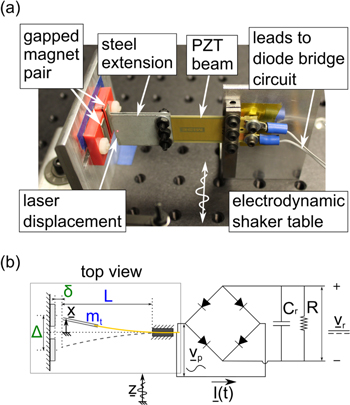
Figure 1. (a) Photograph of nonlinear energy harvester platform and (b) corresponding schematics with diode bridge rectifier circuit.
Download figure:
Standard image High-resolution imageThe beam tip and electrodynamic shaker table absolute displacements are measured by laser displacement sensors (Micro-Epsilon ILD-1420). An accelerometer (PCB Piezotronics 333B40) is used to measure the shaker table acceleration. The external base excitations are applied by electrodynamic shaker and table (APS Dynamics 400) which is driven by an amplifier (Crown XLS 2500). The strength of base acceleration excitation is quantified by the base acceleration amplitude (for the harmonic excitation component) and standard deviation of the white noise (for the stochastic excitation component). The excitation signals are constructed by adding normally-distributed voltage, band-pass filtered between 3 and 90 Hz, with a prescribed harmonic voltage. Data from all channels are collected at sampling rate 4096 Hz and low-pass filtered at 100 Hz.
2.2. Representative data revealing need to create DC power optimization approach
Preliminary experiments are conducted to assess the significance of uncovering optimal conditions for energy harvesting in combined excitation environments. Three different load resistances are considered R = {10, 150, 1000} kΩ, which span over 2 order of magnitude around the optimum resistance value, as later examined in section 4.2. The smoothing capacitor is Cr = 10 μF, which is sufficiently large to minimize the DC voltage ripple to a negligible amount. To investigate one of the more promising stiffness nonlinearities explored for vibration energy harvesting albeit with the challenge of non-unique response [28, 29], the magnets are tuned such that the nonlinear harvester is in a symmetric bistable configuration. The distance between the two statically stable equilibria is 2.3 mm, while the linear natural frequencies around either equilibrium configuration are both 25 Hz, ensuring the symmetry of the structure. While this preliminary assessment considers bistable nonlinearity in the energy harvesting system, additional nonlinearities are scrutinized in section 4.4.
The preliminary experimental results are shown in figure 2. First, pure harmonic excitation is applied with harmonic base acceleration amplitude a = 4 m s−2. The frequency is slowly varied at a rate of 0.1 Hz s−1 from  = (5, 35) Hz, from low to high values and then from high to low. According to the experiment results shown in figure 2(a) by the solid curves, under pure harmonic excitation the change in the load resistance does not greatly influence the amplitude of the beam displacement, except for the varied frequency band in which the larger amplitude snap-through responses are achieved. Specifically, for the resistances R = {10, 150, 1000} kΩ, the lower cutoff frequencies of snap-through branches are all about 10 Hz, while the upper cutoff frequencies are 22.25 Hz, 18.75 Hz, and 22 Hz, respectively. On the other hand, the DC power generation is plainly dependent on the selection of load resistance, as seen in figure 2(b). Indeed, for pure harmonic excitation, this fact is known for the broad class of smooth stiffness nonlinearities leading to monostable or bistable energy harvesters [38]. In figure 2(b), for the resistances R = {10, 150, 1000} kΩ, the maximum DC powers are 0.83 mW, 1.20 mW, and 0.60 mW, respectively. Note that the resistance change from 10 to 150 kΩ increases peak DC power by about 50%, while the resistance change from 150 to 1000 kΩ decreases the peak DC power by 50%. It is also worth emphasizing that the best load resistance selection for DC power corresponds to a reduction in the frequency bandwidth of the large amplitude of the nonlinear harvester response, as previously uncovered for AC power generation from nonlinear energy harvesters [30].

Figure 2. Experimental measurement of (a) beam tip displacement and (b) corresponding DC power generation, under harmonic excitation (solid lines) with base acceleration amplitude  = 4 m s−2, or combined harmonic and stochastic excitation (shapes) with harmonic base acceleration amplitude
  = 4 m s−2 and noise standard deviation
  = 3 m s−2. Three levels of resistance are chosen R = {10, 150, 1000} kΩ.
Download figure:
Standard image High-resolution imageThen, a case of combined harmonic and stochastic base acceleration is considered. The standard deviation of an additive white noise acceleration is  = 3 m s−2, which adds to the harmonic base acceleration amplitude
  = 4 m s−2. The data points in figure 2 are the corresponding experimental measurements for the combined excitation case. The experimental results reveal that the mechanical response is relatively robust to change in resistance since the mean displacement amplitudes are less sensitive to change in resistance than for the case of pure harmonic base acceleration. In contrast, the DC power demonstrates clear dependence on the resistance value. According to figure 2(b), under such combined excitation the maximum DC power increases by about 2.8 times from 0.31 to 0.87 mW as resistance changes from 10 to 150 kΩ, while the DC power reduces by about half from 0.87 to 0.42 mW when resistance changes from 150 to 1000 kΩ. Interestingly, the peak DC power under the combined excitation is not strongly dependent upon the frequency of the harmonic excitation component. In each case of load resistance, the peak power is achieved around 18 Hz, which compares to the linear natural frequency of 25 Hz that may be ordinarily anticipated to be an optimal working condition in vibration energy harvesting applications.
The results in figure 2 are exemplary of the nuances and non-intuitive aspects of DC power delivery that are observed throughout this investigation. There are consequently clear needs to optimize the design and deployment of nonlinear energy harvesters subjected to combined harmonic and stochastic excitations. The following theoretical formulation builds up such an approach for optimization.
3. Nonlinear vibration energy harvester model and optimization
The optimization technique devised in this research builds beyond the nonlinear vibration energy harvester model previously proposed by the authors [34]. The following section 3.1 reviews the essential components of the analytical model framework needed to yield expressions for the optimization undertaking. The optimization method is then presented in section 3.2.
3.1. Review of nonlinear energy harvesting system analysis for arbitrary harmonic and random excitations
The assumptions of the analysis are that the beam deflects in the same period of oscillation as the sinusoidal component of base acceleration, that the beam deflection is only in the lowest order vibration mode, that the influences of the magnetic forces and large beam stretching are reduced to the linear and cubic nonlinear terms resulting from a Taylor series expansion, and that the diode bridge rectifier is perfect [34]. Consequently, the non-dimensional governing equations are


Here, x denotes the generalized non-dimensional beam tip displacement relative to the non-dimensional motion z of the base, the positive direction of which is indicated in figure 1(b); vp and vr are the non-dimensional AC and DC voltages, respectively, before and after the diode bridge rectification; and p is the loading parameter which characterizes the negative linear stiffnesses induced by the attractive magnet pair so that p < 1 indicates that the harvester is monostable, while p > 1 indicates that the harvester is bistable [27, 39, 42]. In addition, η is the loss factor associated with viscous damping influences; β is the coefficient of cubic nonlinearity; γ is the ratio of smoothing capacitance to the piezoelectric capacitance; ρ is the ratio of mechanical to electrical time constants; while κ and θ are respectively the electromechanical coupling coefficients. The notation ()' indicates differentiation with respect to non-dimensional time τ.
The non-dimensional base acceleration is a combination of harmonic and stochastic components

where w(τ) is a Gaussian white noise process with

The normalized standard deviation of the noise base acceleration component is σ. The normalized harmonic base acceleration amplitude is a, while ω is the angular frequency of excitation that is normalized with respect to linear natural frequency ω0, such that the absolute angular excitation frequency of the base acceleration is  The corresponding absolute harmonic base acceleration amplitude and standard deviation are denoted by
  and
and  respectively.
To solve the nonlinear governing equation (1), a linearization approach is used by introducing an equivalent equation

Two parameters are introduced: the equivalent linear natural frequency ωe and displacement offset ε. The error  between equations (1a) and (4) is minimized in a mean-square sense.
The equivalent linear system governed by equation (4) is therefore assumed to approximately respond to the harmonic and stochastic base acceleration components in a way analogous to linear superposition by the sum of harmonic and stochastic terms. Using subscripts h and r to respectively denote responses due to harmonic and random excitation components, the total beam displacement, AC voltage across the piezoelectric electrodes, and DC voltage on the load resistance are then


The harmonic components of beam tip displacement and AC voltage are expressed using low order Fourier series expansions.


A constant term k is required in the beam tip displacement equation (6) to represent displacement bias when the beam oscillates around a local stable equilibrium configuration. The DC voltage  is assumed to be constant. The components of responses due to white noise have zero-mean,
  By using the assumed total mechanical responses as shown in equation (5a), minimizing the mean square error due to linearization results in expressions for
  and ε
and ε

Then, the equations (1b), (1c), and (4) are solved in a way that couples together the harmonic and stochastic components of the response via (8). A complete description of the undertaking of such analytical approach is described in [34].
For the harmonic component, the derivation results in expressions for the AC voltage across the piezoelectric electrodes  the DC voltage, and DC power given by


using an auxiliary phase  Together, the responses of equations (10)–(12) are substituted into equation (4) for the case of harmonic base acceleration
  Consequently, a cubic polynomial in terms of n2 is obtained

where
and
By equation (8), ωe is also a function of the mean-square displacement  that is induced by the stochastic excitation component. By virtue of the nonlinearity of the energy harvester and in the rectification circuitry, an empirical approach is devised to determine the relationships among mean-square displacement
  and the piezoelectric AC voltage
  and rectified DC voltage
  The final results of mean-squared AC and DC voltage outputs yields the expressions (15) and (16), respectively.


Then, equation (4) is again considered for the stochastic base acceleration  and stochastic response terms from equation (5). A secondary linearization is thus undertaken according to an equivalent system

Minimizing the mean-square error between equations (4) and (17) leads to the expression for the new, squared equivalent natural frequency 

Then, the mean-square displacement  due to white noise base excitation is

Collectively the overall nonlinear vibration energy harvester electromechanical responses under combined harmonic and stochastic base acceleration are determined by simultaneously solving the coupled nonlinear algebraic equations, equations (8), (13), and (19) that nonlinearly couple together influences of the harmonic and random response components via the equivalent natural frequency. The resulting total responses of the energy harvesting system may then be determined by equation (5).
The total DC power output across the load resistance is therefore

This effective superposition principle is uniquely enabled by the combination of harmonic and stochastic linearization methods deployed in the recent analytical formulation of the nonlinear energy harvesting structure and circuit [34]. Yet, the prior study did not establish optimization methods that may elucidate approaches for maximum DC power extraction from a given combination of harmonic base acceleration and white noise excitation. The approach presented in this research closes this critical gap in technical understanding and model development.
3.2. Total DC power optimization approach
The expression for total DC power generation equation (20) is the sum of harmonic and stochastic portions. In this section, the derivation given in section 3.1 as reviewed from [34] is greatly built beyond to formulate the approach to optimize the total DC power.
Because the analytical technique is established on linearization and an equivalent method of superposition, the optimization begins by optimizing the DC power components individually with respect to either the harmonic or stochastic base acceleration components. The traditional method to identify extrema of a function is used for the optimal load resistance of the DC power components:


The electromechanical coupling is presumed to be sufficiently small such that the structural dynamics are weakly dependent on change in electrical resistance, which is an assumption adopted by other researchers in the field [11]. This leads to expressions of optimal load resistance


Similar results for the optimal resistance due to harmonic excitation, equation (23), have also been obtained previously for linear vibration energy harvesters with DC [11, 43] and AC [15] power outputs, using the same assumption regarding negligible electromechanical coupling effects. Yet, the determination of optimal resistance for either pure stochastic or combined harmonic and stochastic base accelerations have not been obtained for nonlinear energy harvesters. Note that based on the limiting case expressions equations (23) and (24), the resistance  optimized for pure harmonic excitation is frequency dependent, while the optimal resistance for stochastic excitation component
  is independent of excitation characteristics. The constant coefficient in equation (24) is obtained by the operations equation (22) acting on the empirically derived expression of random DC power due to stochastic excitation component of base acceleration [34]. Consequently, an expression of optimal resistance that bridges these two qualitatively distinct limiting cases is required when excitations contain both harmonic and stochastic contributions.
Yet, a direct derivation of overall optimal resistance is not feasible for the general case of harmonic and stochastic base accelerations because a recursive relationship is obtained due to the nonlinearly coupled nonlinear algebraic equations (8), (13), and (19). Thus, to obtain an expression of optimal resistance for the general case of combined excitations, the analysis is exercised in 3 kΩ increments of load resistance, 1 Hz increments of harmonic excitation frequency, and 0.3 increments of noise standard deviation to harmonic base acceleration amplitude ratio. Then, the total DC power is determined, while the corresponding load resistance is varied over the range R = (100, 250) kΩ. The harmonic excitation frequency range considers the bandwidth sufficiently around the nonlinearly resonant state  = (11, 18) Hz that induces non-unique dynamic behaviors for pure harmonic excitation as shown in figure 2. The ratio of noise standard deviation to harmonic base acceleration amplitude is varied across
  = (0, 3). The remaining system parameter values used to generate the analytical data points in figure 3 are shown in table 1.

Figure 3. Predicted optimal resistance from individual analysis (shapes) and empirically determined expression equation (25) (curves) as functions of base excitation noise standard deviation to harmonic base acceleration amplitude ratio for different harmonic excitation frequencies, 
Download figure:
Standard image High-resolution imageTable 1. Non-dimensional parameters used in the simulations and analysis.
| Parameter | η | β | κ | p | θ | γ | ρ |
|---|---|---|---|---|---|---|---|
| Value | 0.08 | 0.45 | 0.006 | 1.6 | 14.56 | 104.17 | 0.46 |
Then, it is presumed that a weighted combination of the two values of optimal load resistance, equations (23) and (24), collectively make up the load resistance value that optimizes the total DC power in the general case or arbitrary, persistent base accelerations. A logistic function is found to fit the analytical results using the least number of fitting variables. Although several classes of functions may be employed to characterize a function variation from one extreme parameter value to another, the logistic function is employed in this research due to preliminary observations that it faithfully characterizes the variation of the function values in the range of parameters that are between extreme values. Therefore, the optimal load resistance for combined harmonic and stochastic base accelerations driving the nonlinear energy harvester is obtained to be

Shown in figure 3 are the fitting results, where equation (25) is presented by the curves for different harmonic excitation frequencies. The analytically predicted optimal resistances are the data points. As observed in figure 3, the optimal resistance clearly depends on the ratio of the noise standard deviation to the harmonic base acceleration amplitude  and the more noise-dominated excitation scenario
  ≥ 3 is frequency independent. The coefficients of determination for the cases as shown in figure 3 for different harmonic excitation frequency
  in integer values from 11 to 18 Hz are respectively {0.97, 0.98, 0.97, 0.96, 0.90, 0.76, 0.87, 0.81}. This emphasizes the accuracy of equation (25) under a wide variety of relevant general cases and frequencies of the combined excitation. It is possible that the specific coefficients identified in the logistic function fit equation (25) may change when considering more strongly coupled nonlinear energy harvesters. Yet, due to the widespread examination of weakly coupled energy harvesting structures and merits of such less costly materials [14], the results obtained in the following investigations using equation (25) for weakly coupled energy harvesting systems may find broad application.
From a firm grasp of vibration energy harvesting principles, the excitation ratio  cannot be optimized because an ever-increasing value of
  would intuitively improve the total DC power generation, albeit at the practical fatiguing and possible failure of the energy harvesting beam. In addition, the influence on maximum power generation due to electromechanical coupling coefficient is documented for linear and nonlinear vibration energy harvesters by Wickenheiser and Garcia [18], Wickenheiser [44], and Panyam et al [30, 38]. These authors have revealed that for weakly coupled system only one condition for maximum AC or DC power generation may be realized, while more strongly coupled harvesters exhibit two such local maxima of power. Because such background is known, in this study the electromechanical coupling coefficients κ and θ are not considered for optimization. Instead, focus is placed on optimizing the DC load resistance and relative harmonic excitation parameters that result in maximum DC power output from the nonlinear energy harvester under combined harmonic and stochastic excitations.
4. Results and discussion
4.1. Case study validation for optimization approach
As revealed from the case study experimental results of section 2.2, there is apparent need to optimize the total DC power output from nonlinear vibration energy harvesters subjected to combined harmonic and stochastic excitations. Here, using the model presented in section 3, analytical results are validated against the case study experimental measurements. Direct numerical simulations of non-dimensional governing equation (1) are likewise undertaken for verification purposes. The non-dimensional parameter values used for simulation and analysis are provided in table 1, and are identified from the experimental setup according to the system identification procedures reported in [34]. The simulations are conducted by using fourth-order Runge–Kutta numerical integration. The initial values for the state variables are normally distributed random numbers within one order of magnitude of the statically stable equilibria. In order to obtain statistically sufficient data for harmonic and stochastic excitations, the simulations elapse over 600 periods of the harmonic excitation frequency.
The analytical and simulation results are determined first for a case of pure harmonic excitation with base acceleration amplitude is  = 4 m s−2. As directly comparable to the experimental measurements in figure 2, the analytical and simulation results in figure 4 are in qualitative and quantitative agreement with the data. The amplitudes of harvester beam displacement are shown in figures 4(a) and (c) while the DC power is given in figures 4(b) and (d). Simulation results are in figures 4(a) and (b) with the open data points, while the analytical predictions are in figures 4(c) and (d) using the solid curves. The change of load resistance is seen to govern the DC power of the simulation and analytical findings in the same ways as those observed in the experiments. These factors include the frequency dependence of the peak DC power, the changing frequency bandwidth of the large amplitude snap-through responses for peak power, and the influence of load resistance on the peak DC power.

Figure 4. Simulation results of (a) beam tip displacement amplitude (b) total DC power, under harmonic excitation (hollow data points) with base acceleration amplitude  = 4 m s−2; or combined harmonic and stochastic excitation (filled data points) with harmonic base acceleration amplitude
  = 4 m s−2 and noise standard deviation
  = 3 m s−2. (c) and (d) Corresponding analytical results, for pure harmonic (solid lines) and combined harmonic and stochastic (dashed lines) excitations.
Download figure:
Standard image High-resolution imageYet, to consider the more important case of combined harmonic and stochastic base acceleration, the results of simulations and analysis that correspond to the case of noise standard deviation  = 3 m s−2 and harmonic base acceleration amplitude
  = 4 m s−2 are shown in figure 4, respectively, by the closed data points and dashed curves. Each numerical simulation data point in figures 4(a) and (b) for the combined excitation case is the mean value of 16 simulations. The trend that an optimal resistance may be determined for maximum DC power is also revealed by the simulation and analytical results, in figures 4(b) and (d) respectively, as those observed in the measurements figure 2(b). On the other hand, the analysis predicts coexistent results in the frequency band between about 17 and 25 Hz due to the theoretical formulation that considers a quasi-decoupling of harmonic and stochastic electromechanical responses. The simulations and measurements do not reveal such coexistence because the presented results are means of a large number of time sequences at each harmonic excitation frequency considered. Thus, the analysis suggests a range of DC power from low to high values that the total resulting DC power may be found; indeed, the absolute results from simulations and experiments are found to occur in this range. Despite this discrepancy that is merely associated with the limitations of an analytical formulation formulated upon such a nonlinear superposition approach, the overall influences of change in excitation characteristics and load resistance on the total DC power as predicted by the analysis are likewise observed in the simulations and measurements. This verification and validation propels the subsequent contrast among the comprehensive results to test the efficacy of the optimization approach.
4.2. Exploring optimal resistance for maximum total DC power
According to the results shown in figures 2 and 4, the optimal resistance for peak total DC power appears to fall in the range R = (10, 1000) kΩ, while the large amplitude snap-through responses that induce such power occur in the frequency range  = (11, 18) Hz in the combined excitation case. Consequently, the attention of the investigations of this section turn to these parameter regimes to examine the utility of the optimization approach to correctly identify working conditions for peak total DC power.
When the amplitude of harmonic base acceleration is  = 4 m s−2 and there is no stochastic contribution to the excitation, the analytical predictions for DC power are given in figure 5(a). The optimal resistance for a given harmonic excitation frequency is shown by the dotted–dashed curve. The frequency dependence of the optimal resistance is clear due to the reduction of the optimal selection for increasing harmonic excitation frequency in the range for which the large amplitude snap-through dynamics occur. This trend is likewise found for the contour of DC power predicted by the analysis in figure 5(a). Quantitatively, the optimal resistance changes from 226.7 to 134.7 kΩ, which is about 40% difference, as the harmonic frequency changes from 11 to 18 Hz. Putting it in perspective, the use of the optimum resistance for 11 Hz excitation should the excitation frequency be 18 Hz leads to a reduction DC power of about 4.6% when compared to the peak that could be achieved.

Figure 5. Analytical prediction of DC power generation when the nonlinear harvester is subjected to (a) pure harmonic excitation with harmonic base acceleration amplitude  m s−2, (b) purely random excitation (
 > 100) at 16 Hz, and (c) comparable harmonic and stochastic excitation components with harmonic base acceleration amplitude
  = 4 m s−2 at 18 Hz. The optimal resistance selections are shown by the curves in each contour, and all results correspond to load parameter p = 1.6.
Download figure:
Standard image High-resolution imageWhen the nonlinear harvester is subjected to nearly pure stochastic excitations ( > 100), the analytical predictions are given in figure 5(b). The derived optimal resistance
  is shown as the dashed line. Clearly the optimal resistance selections are frequency independent for this base acceleration scenario, as revealed through both the analytical contour and the optimal resistance curve. It is seen in figure 5(b) that the optimal resistance values are found around 152.2 kΩ. For sake of benchmarking, a deviation from this resistance value by about one-half when the noise standard deviation is around 5 m s−2 may result in a DC power reduction of nearly 6.4%.
For the case of combined base acceleration with comparable harmonic and stochastic components at the harmonic base acceleration amplitude  = 4 m s−2 and frequency
  = 18 Hz, figure 5(c) shows the analytical predictions for total DC power by the contour shading. The optimal resistance curve is here given by the solid curve. It is seen that with small proportions of noise with respect to the harmonic excitation, the DC power is maximized for a load resistance selection close to the value optimized for the 18 Hz excitation frequency case in figure 5(a). Likewise, for greater relative amount of noise excitation, such as
  > 3, the optimum resistance selection trends to the same value shown for the pure stochastic base acceleration results in figure 5(b). These trends from the contour of analytical predictions in figure 5(c) are closely mapped by the optimal resistance curve, equation (27). Yet, when the relative proportions of harmonic and stochastic base acceleration are similar, the total DC power is strongly tailored by both change in the ratio
  For example, when the ratio of noise standard deviation to harmonic base acceleration amplitude is about
  = 1.75, the maximum DC power output decreases by over 50% compared to the case of pure harmonic excitation: a change from about 1.1 to 0.45 mW. When the ratio
  increases above the range 1.75, the total DC power climbs back up and continues to increase for
  > 3 since greater and greater energy drives the nonlinear harvester under such more extreme cases.
Based on the expression for  the optimal resistance changes from 134.7 to 152.2 kΩ across the range of excitations shown in figure 5(c), which is about a 13% deviation. To further investigate the evolution of optimal resistance with respect to varying ratio of noise standard deviation to harmonic base acceleration amplitude, the analytical results shown in figure 6 corresponding to the same excitation conditions as those for figure 5(c), except for the harmonic excitation frequency
  = 12 Hz. The smoothing capacitance is chosen to be twice the value as used for results in figure 5(c), which results in a doubling of the value for γ. Based on the expression for
  from equation (25), the optimal resistance changes from 207 to 86.35 kΩ across the range of excitations shown in figure 6, which is nearly 240% deviation. To quantify the influence of such evolution of optimal resistance, for
  = 0 a 240% deviation in resistance from optimal value may reduce the peak total DC power by 20%. A similar resistance deviation away from optimal when
  = 3 causes a 11% power reduction. These results emphasize the importance of carefully characterizing the contribution of stochastic excitation in the overall base excitation to appropriately choose the load resistance for optimal DC power delivery from nonlinear energy harvesters.

Figure 6. Analytical prediction of DC power generation when the nonlinear harvester is subjected comparable harmonic and stochastic excitation components with harmonic base acceleration amplitude  = 4 m s−2 at 16 Hz. The optimal resistance selections are shown by the curves in the contour, and results here are correspond to load parameter p = 1.6, and ratio of smoothing capacitance to the piezoelectric capacitance γ = 208.33.
Download figure:
Standard image High-resolution imageTo validate these analytical predictions and optimal resistance trends, experiments are conducted using the same range of excitation and circuit parameters as those for figure 5. Figure 7(a) shows the experimental measurements for pure harmonic excitation, which is to be compared with the results of figure 5(a). The influences of the load resistance and harmonic excitation frequency on the peak DC power observed in the data indeed agree with the same trends found from analysis. Similar agreement between trends in figure 7(b) and the analytical predictions of figure 5(b). In these cases of pure stochastic base acceleration, the independence of load resistance needed to maximize DC power is plainly observed. Yet, the analysis underpredicts the power generated when the standard deviation of the white noise is large, such as for  > 2 m s−2. This may be the result of the finite duration (30 s) of experiments with each noise standard deviation level that may not encompass sufficiently long time to determine a genuine mean result comparable with analysis. It may also be due to inherent challenges of linearization approaches to predict responses of nonlinear oscillators under cases of very large noise excitations [45]. These deficiencies should be considered alongside the overall agreement between analysis and experiments, respectively in figures 5(b) and 7(b), that a frequency-independent optimal resistance occurs when the base acceleration is dominated by white noise.
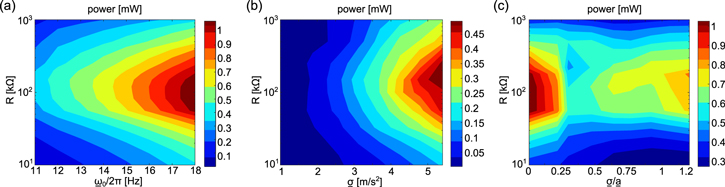
Figure 7. The experimental measurements of DC power generation when nonlinear harvester is subjected to (a) pure harmonic excitation with harmonic base acceleration amplitude  = 4 m s−2 (b) purely random excitation (
 > 100) at 16 Hz, and (c) comparable harmonic and stochastic excitation components with harmonic base acceleration amplitude
  = 4 m s−2 at 18 Hz.
Download figure:
Standard image High-resolution imageThen figure 7(c) shows experimental results for the more general excitation scenario that includes harmonic base acceleration with amplitude  = 4 m s−2 at 18 Hz and a varied standard deviation of the stochastic base acceleration component. According to the experimental results shown in figure 7(c), the peak total DC power occurs for a smaller load resistance selection when the ratio
  = 0 than when the ratio
  is more dominated by the white noise contribution. This agrees with the analytical result of figure 5(c). Due to the distinctions between influences of noise predicted analytically and seen experimentally, in figures 5(b) and 7(b), the range of the noise standard deviation to harmonic base acceleration ratio
  in figure 7(c) does not agree quantitatively with the range in figure 5(c). On the other hand, the qualitative agreement in trends is evident between the analytical predictions and experimental measurements. This includes the trend that the peak power is reduced by nearly 50% when small standard deviations of white noise are introduced, such that
  < 1 yet
  ≠ 0. These results emphasize the significance of optimality for deploying nonlinear vibration energy harvesters in practical excitation environments.
The analytical results in figure 5 and experimental measurements in figure 7 thoroughly consider the broad range of excitation conditions having combinations of harmonic and stochastic base excitation components. The results reveal that the optimal load resistance is clearly influenced by the specific combination of harmonic and stochastic base excitation characteristics. As a result, an optimal resistance for DC power delivery selected for one combination of excitation components may be different if the balance of excitation components is varied. Based on the results obtained by the analysis in figure 5 and more detailed experimental undertaking via figure 7, the optimal load resistance for the preliminary case of experiments shown in figure 2 is around R = 150 kΩ, which is the value used for the exemplary, motivating case study of section 2.2.
The experimentally measured time series of DC voltage and instantaneous DC power for three selections of the load resistance R = {10, 120, 500} kΩ further underscore the significance of optimal resistance selections and sensitivity of the nonlinear energy harvester power generation on the relative proportion of harmonic and stochastic base accelerations. For the results shown in figure 8, 30 s long time windows are shown during which the ratio of noise standard deviation to harmonic base acceleration amplitude is incremented through the levels  = {0, 0.3, 0.65, 0.925, 1.2}, all the while the base acceleration amplitude and frequency are respectively
  = 4 m s−2 and
  = 18 Hz.
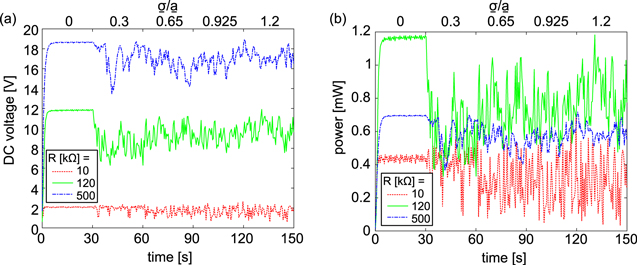
Figure 8. Experimental measured time series of (a) DC voltage and (b) DC power across three resistance R = {10, 120, 500} kΩ, under combined harmonic and stochastic excitation with harmonic base acceleration amplitude  = 4 m s−2 at 18 Hz.
Download figure:
Standard image High-resolution imageAccording to time series results shown in figure 8(a), the DC voltage increases as resistance value increase, a well-known characteristic of linear and nonlinear piezoelectric energy harvesters [12, 46]. The corresponding DC power, shown in figure 8(b), demonstrates a clear dependence upon the load resistance as well as an optimal selection in between low and high values. Specifically, the resistance R = 120 kΩ delivers around 50% or greater total DC power, depending on the excitation condition ratio  Importantly, when ratio of noise standard deviation to harmonic base acceleration amplitude is
  = 0.3, the DC voltage and power undergo sudden drops that are exaggerated for the optimal resistance case R = 120 kΩ. Specifically, the average DC power decreases by over 50% in the transition from
  = 0 to
  = 0.3. In addition, the influence of change of the load resistance on the DC power is less dramatic for
  = 0.3, which agrees with the analytical predictions in figure 5(c) where the corresponding phenomenon occurs near
  = 1.75. In total, the time series results in figure 8 reveal that the qualities of combined harmonic and stochastic base accelerations are strongly influential to the optimization of the nonlinear energy harvester and must be rigorously assessed to successfully predict the achievable DC power prior to deploying such devices in practice.
4.3. Harmonic excitation frequency influences on maximum DC power
As found from the analytical, simulation, and experimental results given in figures 2, 4, 5, and 7, the DC power is frequency dependent when the harvester is subjected to the general combination of excitation forms. Recall that experimental results with combined excitations in figure 2 reveal that peak DC power is achieved with a harmonic excitation frequency 18 Hz instead of the linear natural frequency 25 Hz, which also correspond to the frequency of peak displacement amplitude. To investigate such nuanced sensitivities of the harmonic excitation frequency used within the combined excitation, the insights of previous studies are leveraged here. Specifically, in related work on the structural dynamics of post-buckled beams, the authors found that the change in mean-square displacement due to change of stochastic excitation contributions to a combined harmonic and stochastic base acceleration form may be correlated with the frequency of peak response amplitude [47]. Inspired by these suggestions on purely structural dynamics, here the DC power from analysis and measurements are shown along with the nonlinear harvester mean-square displacement in figure 9. The nonlinear vibration energy harvester is subjected to excitations with harmonic base acceleration amplitude  = 4 m s−2 and one of a set of ratios of noise standard deviation to harmonic base acceleration amplitude
  = {0, 0.4, 0.75, 1}. The analytical results are shown in figures 9(a) and (c) while experimental measurements are shown in figures 9(b) and (d). In all results, the load resistance is R = 150 kΩ. The total DC powers in figures 9(a) and (b) show a clear dependence of peak power generation on the harmonic excitation frequency and noise standard deviation. Despite the analytically predicted coexistence of responses in figure 9(a), the ranges of high to low DC powers that are predicted for any given harmonic excitation frequency indeed include the experimentally measured value of the peak total DC power in figure 9(b).

Figure 9. Analytical results of (a) DC power output across resistance R = 150 kΩ, and (c) beam tip mean-square displacement, under excitation with harmonic base acceleration amplitude  = 4 m s−2, and (b), (d) corresponding experimental measurements.
Download figure:
Standard image High-resolution imageThe mean-square beam displacements in figures 9(c) and (d) are shown by the solid curves in the case of pure harmonic base acceleration. The coexistence of dynamics under such conditions is evident by multiple curves for a given harmonic excitation frequency in both analytical predictions and experimental measurements, which are moreover in good quantitative agreement. As recognized in [47], figures 9(c) and (d) also shows that the mean-square beam displacement is approximately equal to the squared stable equilibria distance  as measured from the unstable equilibrium, when the ratio is
  = 0 and when the harmonic excitation frequency is sufficiently away from the nonlinear resonant features. For cases of the combined excitation, the mean-square beam displacement and DC power outputs are closely correlated as shown in figure 9. Specifically, when the harmonic excitation frequency is closer to the extremes of the plotted range, such as around 5 or 35 Hz, the DC powers are relatively small, while the mean-squared displacements are smaller in value than the squared stable equilibria distance k2, regardless of the noise standard deviation. Yet, both the analytical and experimental results in figure 9 show that when the harmonic excitation frequencies approach values to maximize the DC power, the mean-square displacement amplitudes are also maximized. Specifically, considering all of the results in figure 9, one finds that the harmonic base acceleration frequency at which the DC power is optimized in the case of combined excitation is near to the frequency at which mean-square beam displacement amplitude exceed the squared stable equilibria distance k2. Relating the observed trends to the corresponding analytical expressions, building from the authors' previous finding [47], the harmonic excitation frequency conditions for optimizing DC power are extracted from

Using equations (8), (19), and (26), one obtains

Considering about the relationship equation (18),  setting equation (27) is equal to
  as functions of displacement amplitude n. The zero intersection of that curve gives the values for n and
  which correspond to the greatest DC power output. Finally, using the determined value for n and
  to solve equation (17) one can obtain the optimal frequency range across which DC power will be maximized when the harvester is subjected to arbitrary combinations of harmonic and stochastic excitation.
Using this method of extracting upper and lower bounds of harmonic excitation frequency for which the DC power may be maximized, simulations are conducted to obtain the DC power as functions of the frequency and ratio  as compared to the analytical predictions of optimal harmonic frequency. Figure 10 presents the result of the simulations by the shades of the contour while the white solid curves are the analytical predictions obtained using the method described above. The results in figure 10 provide thorough evidence that the optimal harmonic excitation frequency shift from about 15 to 25 Hz as the ratio of noise standard deviation to harmonic base acceleration amplitude increases from 0.4 to 2.15. The boundaries on the optimal harmonic frequency of the combined excitation predicted analytically are in good agreement with the simulation trends. The influences of frequency in the harmonic excitation component and standard deviation of noise on the DC power are indeed significant. To quantify these influences, when the ratio of noise standard deviation to amplitude of harmonic base acceleration is
  = 0.6 the DC power output may reduce by about 70% due to a deviation of optimal excitation frequency by about 50%. Yet, when the ratio is
  = 1.85, thus exciting the nonlinear harvester by more stochastic contribution than harmonic, a 50% deviation from the optimal working frequency only reduces the DC power generation by about 20%. In other words, according to the simulation and analytical results in figure 10, as the noise excitation standard deviation increases beyond the amplitude of the harmonic base acceleration so that
  > 1, the overall DC power increases and becomes less sensitive to change in the harmonic excitation frequency.
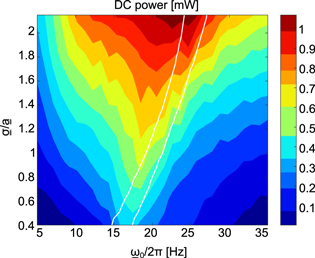
Figure 10. Simulation results of DC power output across resistance R = 150 kΩ, under excitation with harmonic base acceleration amplitude  = 4 m s−2. Analytically predicted optimal frequencies from harmonic excitation component are indicated by white solid curves.
Download figure:
Standard image High-resolution image4.4. Influences of nonlinearity type on total DC power generation
The results in the preceding sections explicitly give attention to the case of nonlinearity induced by the load parameter p = 1.6 which is associated with bistability in the vibration energy harvester. Yet, the results of the optimized load resistances in equations (23)–(25) do not suggest a connection to the nonlinearity type towards maximizing the total DC power delivered, whether caused by pure harmonic, pure stochastic, or a combined base acceleration form. This independence of nonlinearity may be non-intuitive, so as to motivate a close investigation of the role of the load parameter p on the peak DC power delivered from load-optimized nonlinear energy harvesters. By broadening the assessment and optimization undertaking to study a wider range of nonlinearities from monostable to bistable, the outcomes of this section 4.4 may illuminate principles for many other researchers that consider such energy harvesting systems in various contexts and applications [27, 28, 32, 48].
Figure 11 presents the analytically predicted results of DC power shown in the top row for the case of p = 0.8 which is a monostable nonlinear harvester configuration, while the bottom row results are for p = 2.4 which is a more severely post-buckled configuration than that considered previously so that the statically stable equilibria are more distant: when p = 1.6 and p = 2.4 distance between two stable equilibrium are 2.3 mm and 3.5 mm, respectively. In the top row, as anticipated according to the independence of the optimal load resistance on the load parameter p, the peak DC power is achieved for the same selection of R at each excitation condition as that required when p = 1.6, like the results shown in figure 5. On the other hand, the absolute power quantities in figure 11(a) for the pure harmonic case are less than those achieved in figure 5(a) when the harvester is bistable. Yet, the DC power generated by the monostable harvester in figure 11(b) as induced from pure stochastic excitation is the same as that achieved for the bistable platform in figure 5(b). This agrees with prior reports that pure stochastic excitation on nonlinear energy harvesters results in AC power levels that are independent of the nonlinearity type [33, 49]. In figure 11(c), the dependence of the optimal load resistance on the ratio  is the same as that for the bistable harvester platform in figure 5(c), although the overall generated DC power under such combined excitation is less for the monostable harvester than for the bistable configuration with p = 1.6 in figure 11(c).

Figure 11. Analytical prediction of DC power generation when the nonlinear harvester is subjected to (a), (d) pure harmonic excitation with harmonic base acceleration amplitude  = 4 m s−2, (b), (e) purely random excitation (
 > 100) at 16 Hz, and (c), (f) comparable harmonic and stochastic excitation components with harmonic base acceleration amplitude
  = 4 m s−2 at 18 Hz. The optimal resistance selections are shown by the curves in each contour. Results in (a)–(c) correspond to load parameter p = 0.8, results in (d)–(f) correspond to load parameter p = 2.4.
Download figure:
Standard image High-resolution image
These trends are extended to the analytical results shown in the bottom row of figure 11 when p = 2.4, so that a bistable harvester with more greatly spaced stable equilibria is considered. The sudden transition of shading hue in the bottom row of figures 11(d) and (f) indicate transitions from the large amplitude snap-through response to the other coexisting dynamic since the larger amplitude snap-through dynamic is not predicted to occur. The same characteristics of optimal load resistance changes as functions of the excitation conditions reported above for p = 0.8 and 1.6 are similarly observed for p = 2.4. In addition, the same absolute total DC power in figure 11(e) is predicted as those seen for the other nonlinearities in figures 5(b) and 11(b). Yet, a fully new trends is uncovered for the optimal power conditions in figure 11(f) using the more greatly post-buckled bistable harvester. Specifically, the optimal load resistance at low excitation ratios  is not the predicted value, because the harvester is not predicted to undergo snap-through when the ratio
  is approximately less than 1. Indeed, sufficient additive noise is required to stimulate the harvester to snap-through and generate large power if the optimal resistance selection from equation (25) is utilized. In fact, the results of figure 11(f) indicate that load resistances off from the analytically predicted values should be selected for the more greatly buckled bistable harvester so that the electromechanical coupling (via electrical damping phenomena [38]) does not inhibit the achievement of the large amplitude dynamic responses. The nuanced characteristics of the DC power generated by nonlinear energy harvesters subjected to combinations of harmonic and stochastic base acceleration underscore the significance of leveraging both the optimization approach and validated analytical model to guide attention to design and deployment practices assured to deliver the required charging power in applications.
5. Conclusion
This research builds from an analytical framework to create an optimization approach for total DC power delivery from nonlinear vibration energy harvesters subjected to combined harmonic and stochastic base accelerations. An expression is established to relate the system characteristics to the optimal load resistance. The excitation dependence and independence of the expression is tested under the limiting cases of pure harmonic or stochastic excitation, as well as with respect to the form of nonlinearity. Through simulation and experimental efforts, the optimization approach is verified and validated over the wide operational range of combined base acceleration forms. The optimal load resistance is shown to depend on the harmonic excitation frequency in a combined excitation form, while the total DC power is dependent on myriad factors: all excitation conditions, load resistance, and nonlinearity type. The best selection of load resistance is found to be strongly correlated to the noise standard deviation to harmonic base acceleration amplitude ratio, which may cause reduction of optimum power by 20% under harmonic dominated excitations if the resistance is chosen to be the optimal value achieved for noise dominated case. On the other hand, using the optimal resistance achieved for harmonic dominated case can cause 11% power reduction under noise dominated excitations. In addition, the noise standard deviation for the combined harmonic and stochastic excitation is found to be influential for the optimal harmonic excitation frequency, namely increase noise level leads to larger optimal harmonic excitation frequency where maximum DC power output occur. The results also reveal that when the frequency of a predominantly harmonic excitation deviates by 50% from optimal conditions the charging power reduces by 70%, whereas the same frequency deviation for a more stochastically dominated excitation reduce total DC power by only 20%. Results from this research effectively access the optimal design and excitation criteria for maximum DC power output from nonlinear harvesters when subjected to ambient excitations, which provides useful guidance for practical implementation of nonlinear vibration energy harvesters.
Acknowledgments
This research is supported in part by the National Science Foundation under Award No. 1661572, in part by The Ohio State University Center for Automotive Research, and in part by the Midé Technology Corp.