
Abstract
Besides being the worlds' most important fertilizer precursor, ammonia could play an important role as hydrogen carrier in a decarbonized future. The efficient production and decomposition (or cracking) of ammonia are essential to this end. An electricity-driven technology of interest for both these processes are non-thermal plasmas. Plasma processes have the advantage of activating—even inert—molecules and initiating chemical reactions through electron collisions, rather than through conventional heating. However, a complete set of low-energy cross section data is not available for the electron collisions with ammonia (NH3) and its radicals, amidogen (NH2) and imidogen (NH). Here, we used the ab initio R-matrix method to determine theoretical cross sections for the low-energy electron collision processes with NH3, NH2, and NH. Additionally, we explored the contribution of the different processes towards dissociation (especially from electronic excited states). Where possible, we compared our theoretical cross section data with experimental data and/or previous recommendations. Lastly, our own recommended cross section data for the electron collisions are presented. Use of this complete set of electron collision data should contribute to a more accurate description of and better insights into the plasma-chemical kinetics behind plasma-assisted ammonia production and decomposition processes.
Export citation and abstract BibTeX RIS

Original content from this work may be used under the terms of the Creative Commons Attribution 4.0 license. Any further distribution of this work must maintain attribution to the author(s) and the title of the work, journal citation and DOI.
1. Introduction
Our society's unprecedented progress has been made possible—in part—by several agricultural innovations, which supported the strong growth of the world's population. One of the most important developments was the successful production of ammonia (NH3)—a precursor for synthetic fertilizers—from nitrogen (N2) and hydrogen (H2) through the Haber–Bosch process. Besides being the world's most important fertilizer precursor, currently, NH3 is also considered as a key hydrogen carrier because it is easier to handle, store, and transport than pure H2. Compared to other hydrogen carriers, NH3 has the highest H atom weight percentage (17.7 wt%), energy density (3000 Wh kg−1), and most importantly, it can be reformed into H2 or burned directly without any CO2 emissions. This makes both the synthesis and decomposition (or cracking) of NH3 attractive processes. Unfortunately, the existing production process of NH3 is extremely energy intensive. It is responsible for 1%–2% of the worldwide energy consumption and 1.44% of the global CO2 emissions, making it the most polluting process in the chemical industry [1, 2]. Therefore, it is essential to find more efficient, sustainable, and especially electron-driven processes.
One potential technology to electrify existing chemical processes and provide novel sustainable solutions to pressing energy and environmental challenges, are non-thermal plasmas (NTP) [3, 4]. A key characteristic of NTP is their ability to activate—even inert—molecules through electron-induced reactions instead of thermally-induced reactions. Plasma-assisted NH3 synthesis and decomposition are gaining increased attention for their potential role in sustainable electron-driven nitrogen fixation and hydrogen carrier reforming [2, 5, 6]. To further advance this area, an accurate description of the electron-induced chemistry is necessary. Electron collision (or scattering) studies provide the necessary input data for plasma-chemical kinetic studies [5], which are essential to acquire a better understanding of the underlying plasma chemistry and to further develop suitable applications. Bang et al [5] recently highlighted the need for a comprehensive set of cross section data for the electron collisions with NH3, NH2, and NH.
Here, we present high-level ab initio electron collision calculations with the 'R-matrix method'-based quantemol electron collision (QEC) software [7], to develop a comprehensive set of theoretical cross section data for low-energy electron collisions with NH3, NH2, and NH. Where possible, the theoretical calculated cross sections were compared with experimental, theoretical, and/or recommended data from literature, and new recommendations were made for the different electron collision processes. Additionally, for the correct description of the plasma chemistry in ammonia mixtures, we investigated the contribution of the various processes to dissociation by relying on potential energy curve (PEC) calculations in combination with available data from literature.
Our study successfully determined low-energy cross sections for critical electron collision processes with NH3, NH2, and NH; it provided additional evidence that experimental data can be underpredicted at low energies due to difficulties in measuring forward scattering [8]; and it successfully identified the electronically excited states that lead to dissociation and suggests their expected dissociation channels. Accordingly, this work will contribute to a better understanding of the chemical reactions taking place in NH3 containing mixtures, such as plasma-assisted ammonia decomposition or cracking [5], ammonia production or synthesis [2, 9], and ammonia combustion studies [10]. Additionally, it is of importance for astrophysics and planetary science studies due to the presence of these species in interstellar space and in the atmosphere of (exo)planets [11].
2. Numerical method
2.1. Electron collision processes
The electron-induced chemistry occurring in plasmas originates from collisions between electrons and other species, which result in a variety of electron collision (or electron impact) processes.
Elastic scattering:

Rotational excitation:

Vibrational excitation:

(Dissociative) electronic excitation:


(Dissociative) ionization:


(Dissociative) electron attachment:


The reaction rates, ri , of these processes are highly dependent on the energy of the electron and the properties of the molecule:

where ne
is the electron density, N the density of the gas phase collision partner, ki
the reaction rate coefficient of process i, e the elementary charge, me
the electron mass,  the electron energy, σi
the cross section of the electron-neutral collision process i, and f0 the isotropic part of the electron energy distribution function [12].
the electron energy, σi
the cross section of the electron-neutral collision process i, and f0 the isotropic part of the electron energy distribution function [12].
Hence, the key data needed to determine the reaction rates, ri
, are the cross sections, σi
, as function of the electron energy, (or Te
). Additionally, for an accurate description of the isotropic part of the EEDF, f0, a comprehensive set of electron collisions (with their respective cross sections) is required to consistently account for the electron energy losses due to the electron collisions. To obtain the cross section data for a comprehensive set of electron collisions with NH3, NH2, and NH, we performed theoretical calculations with the QEC software package [7].
2.2. Theoretical background
To provide a comprehensive tool to study electron collision processes, QEC [7] incorporates ab initio quantum chemistry calculations using MOLPRO [13] together with the latest version of the UK molecular R-matrix (UKRMol+) code [14]. The R-matrix method is a powerful ab initio method to investigate low-energy electron-molecule interactions. The fundamental principle of the R-matrix method is to divide the interaction space between the electron and the target (here NH3, NH2, and NH) into an inner and outer region. In the inner region, the physics are complex and the Schrödinger equation needs to be solved, while in the outer region, one can rely on greatly simplified equations to account for the multipole and Coulomb interactions. This approach reduces the complexity of the initial problem. For detailed information regarding the UKRMol+ code, we refer to the work of Mašín et al [14]; for the R-matrix method, we refer to the work of Tennyson [15]; for more details about QEC and the incorporated models, we refer to the work of Cooper et al [7]; and for a detailed example of the application of these codes to electron-molecule scattering, we refer to the work of Hamilton et al [16] where QEC's predecessor (Quantemol-N) [17] was used to determine a comprehensive set of cross section data for electron collisions with NF3, NF2, and NF.
2.3. Calculation details
2.3.1. Models used.
Various theoretical electron scattering models exist to describe the interaction of an incident electron with the bound electrons of a target molecule. In this work, we employed two main methods: (i) the static exchange plus polarization (SEP) method and (ii) the close-coupling (CC) expansion method [15]. Unless stated otherwise, the discussed data is that of the more sophisticated CC method.
Besides these methods, additional theory incorporated in QEC was used to derive the cross sections for different electron collision processes (table 1): (i) the UKRMol+ code [14] to compute elastic and electronically inelastic cross sections; (ii) the POLYDCS code [18] to compute differential, momentum transfer and rotational excitation cross sections; (iii) a method by Ayouz et al [19] described as frame transformation, to compute vibrational excitation cross sections; (iv) the BEf procedure of Kim [20] to scale electron impact excitation cross sections to high energies; (v) the binary encounter Bethe (BEB) method of Kim and Rudd [21] to calculate the total ionization cross section; and (vi) a dissociative electron attachment (DEA) estimator [22] to provide an estimation of the total DEA cross section.
Table 1. Different codes and theories incorporated in QEC to determine the recommended cross section data for the different electron collision processes in this work.
| Electron collision process | Method | Code/theory |
|---|---|---|
| Total scattering | ||
| Close-coupling (CC) expansion | POLYDCS [18] |
| Elastic scattering | Close-coupling (CC) expansion | UKRMol+ [14] |
| Momentum transfer | Close-coupling (CC) expansion | POLYDCS [18] |
| Rotational excitation | Close-coupling (CC) expansion | POLYDCS [18] |
| Vibrational excitation (NH3 only) | Close-coupling (CC) expansion | Frame transformation [19] |
| Electronic excitation | ||
| Close-coupling (CC) expansion | UKRMol+ [14] |
| Close-coupling (CC) expansion | Binary encounter and f scaling (BEf) [20] |
| Total ionization | Close-coupling (CC) expansion | Binary encounter Bethe (BEB) [21] |
| Total dissociative electron attachment | Close-coupling (CC) expansion | DEA estimator [22] |
Cross sections were provided for electron collisions with energies up to 35 eV. However, it should be noted that the R-matrix method is most accurate for low-energy electron collisions (below 15–20 eV). At energies above the target's ionization threshold, it is necessary to allow for electron impact ionization, which implies a continuum set of possible electronic excitations. This leads to instabilities in the calculations and fluctuations in the result.
2.3.2. Target structure.
MOLPRO [13] was used to optimize the molecular geometries of NH3, NH2, and NH, using the Dunning's Gaussian type orbital cc-pVQZ basis set at the Hartree–Fock level. The symmetries obtained for the optimized geometries of NH3, NH2, and NH are C3v, C2v, and C∞v, respectively (table 2). Good agreement for the dipole moments of the optimized geometries with experimental data was achieved (table 3). The calculated and experimentally measured dipole moment for NH3 are in excellent agreement, whereas the polarizability has a 15% deviation. For NH2, the calculated dipole moment is in good agreement with a 5% deviation compared to the experimental values. No experimental polarizability data was available for NH2. For NH, the experimental value of Scarl and Dalby [23] is considered to be underestimated, while our calculated dipole moment is in good agreement with other calculated values and with a 5% deviation compared to the experimental value given by Nascimento [24]. No experimental polarizability data was available for NH. Obtaining good agreement for the dipole moment was considered an important aspect of the geometry optimization because the magnitude of the dipole moment has a large influence on the cross section data through the electron-dipole interactions that are calculated in the outer region of the R-matrix method.
Table 2. Geometry of NH3, NH2, and NH in the center-of-mass frame.
| Molecule | Symmetry (in QEC) | Atom | x (Å) | y (Å) | z (Å) |
|---|---|---|---|---|---|
| NH3 | C3v (Cs) | N | 0.0 | 0.0 | −0.0618 |
| H | 0.0 | 0.9841 | 0.2861 | ||
| H | 0.8523 | −0.4921 | 0.2861 | ||
| H | −0.8523 | −0.4921 | 0.2861 | ||
| NH2 | C2v (C2v) | N | 0.0 | 0.0 | 0.0805 |
| H | 0.0 | −0.8006 | −0.5595 | ||
| H | 0.0 | 0.8006 | −0.5595 | ||
| NH | C∞v (C2v) | N | 0.0 | 0.0 | −0.0701 |
| H | 0.0 | 0.0 | 0.9737 |
Table 3. Experimental and calculated dipole moment and polarizability of NH3, NH2, and NH.
| Molecule | Dipole moment (a.u.) | Polarizability (a.u.) | ||
|---|---|---|---|---|
| Exp. (calc.) | This work | Exp. | This work | |
| NH3 | 0.5784, [25] | 0.5776/0.5970 | 14.19 [26] | 12.066 |
| 0.5807 [27] | ||||
| NH2 | 0.716 [28, 29] | 0.7521/0.6814 | n.a. | n.a. |
| NH | 0.5465, [23] | 0.6375/0.5899 | n.a. | n.a. |
| 0.6055, [24] | ||||
| (0.5980–0.6374) [30] | ||||
a RHF: restricted Hartree Fock; MCSCF: multi-configuration self-consistent field.
3. Results and discussion
First, the theoretical cross sections for electron collisions with NH3 are discussed in section 3.1 and, where possible, compared with available data from literature. Next, a similar discussion is made for NH2 in section 3.2 and for NH in section 3.3. All three sections start with background information for the respective specie and its calculated eigenphase diagrams, followed by a discussion of the different electron collision processes: (i) total scattering, (ii) elastic scattering, (iii) momentum transfer, (iv) rotational excitation, (v) vibrational excitation, (vi) electronic excitation, (vii) neutral dissociation, (viii) ionization, and (ix) DEA. Finally, each section concludes with a summary of recommended cross section data.
3.1. Ammonia (NH3)
NH3 is a closed-shell target with a C3v point group symmetry. The calculations were performed in the Cs symmetry, which is a subgroup of C3v. The ground-state Hartree–Fock electronic configuration of NH3 in the Cs symmetry is ( ). For the CC scattering calculations, we used the Complete Active Space-Configuration Interaction (CAS-CI) model to represent the target wavefunction with cc-pVQZ basis set and eight target states. Of the 10 available electrons, two were frozen in the
  molecular orbital, while the remaining eight electrons were located in the CAS composed of the
  molecular orbitals with two additional virtual orbitals (
 ). For the SEP scattering calculations, 25 additional virtual orbitals were used. An inner region radius of 10a0 was more than sufficient to accommodate the target electrons' charge cloud and provided stable calculations.
The CC method predicts the ground-state energy of NH3 to be −56.219 Hartree. The lowest triplet and singlet excited-states thresholds are 5.31 and 5.78 eV, respectively. In general, the vertical excitation energies to the eight lowest-lying electronic excited singlets and triplets compare well with data from literature (see sections 3.1.6 and 3.1.7, table 5).
The NH3 eigenphase diagram for the corresponding total symmetries A' and A'' showed resonances at 8.40, 10.15, 10.96, 13.21, 13.90, and 14.33 eV for symmetry A', and resonances at 10.15, 10.96, 13.21, and 13.90 eV for symmetry A'' using the SEP method in the Cs point group symmetry (figure 1). The CC method showed resonances at 4.97, 5.82, and 10.75 eV for symmetry A', and resonances at 5.89, 10.58, and 10.75 eV for symmetry A'' (figure 1). The resonances at 4.97 (symmetry A') and 10.58 eV (symmetry A'') are Feshbach resonances, which drive the DEA process discussed in section 3.1.8 Additionally, the resonance at 10.75 eV is related to a sharp peak in the cross sections for the electronic excitation process (see section 3.1.6). Higher-lying SEP resonances were probably pseudo-resonances, which are a known artifact of this model [15]. Pseudo-resonances can occur once a calculation goes above the threshold energy of the electronically excited states that are omitted from the calculation. For SEP calculations, this threshold is the excitation energy of the first electronically excited state, whereas for CC calculations, this threshold is the excitation energy of the first electronically excited state that is excluded. (A complete set of electronic excitations for CC calculations would be infinite.)

Figure 1. Calculated eigenphase for the two different symmetries of NH3 (A' and A'') showing similar resonances for the SEP and CC methods, except for Feshbach resonances at 4.97 (A') and 10.58 eV (A'') that are only visible for the CC method.
Download figure:
Standard image High-resolution image3.1.1. Total scattering.
The NH3 total scattering cross section (TCS), σTCS, is the sum of both the elastic and inelastic scattering cross sections. For electron energies above 10 eV, Itikawa [31] recommended (with an accuracy of ±5%) the experimental values proposed by Karwasz et al [32] (measured by Szmytkowski et al [33] and Zecca et al [34]) and the high energy values obtained by Ariyasinghe et al [35]. At low incident electron energy, below 10–15 eV, the electron transmission method used suffers from a large uncertainty of the measured values for polar molecules. It cannot discriminate forward scattered electrons against the incident electron beam, which requires a correction. However, at low energies, the contribution of forward scattering becomes large for polar molecules, like NH3, which results in a large uncertainty of the experimental values [8].
The theoretical TCS calculated with QEC, based on the integrated differential cross section (DCS) obtained using the CC method, agree well with the recommended data (figure 2(a)). At 10 eV, the calculated values are about ∼14% higher than the recommended values, while at 15 eV, this difference decreases to ∼8%, close to the stated experimental accuracy of ±5%. More importantly, the CC calculations do not suffer from the same experimental artefact regarding the forward scattering. As a result, given the good agreement at 10–15 eV, we believe our theoretical cross section data to be accurate and the experimentally obtained values to be underestimated below 15 eV.

Figure 2. (a) Total scattering cross section of NH3 calculated with QEC compared with the experimental values recommended by Karwasz et al [32] (measured by Szmytkowski et al [33] and Zecca et al [34]) and the high energy data obtained by Ariyasinghe et al [35]. Agreement is good for higher energies where forward scattering is negligible. For lower energies, the QEC calculation can accurately describe scattering to all angles, whereas the experimental values cannot capture the forward scattering, resulting in a large underestimation. (b) Total scattering cross section of NH3 calculated with QEC (with and without Born approximation) compared with the experimental values from Sueoka et al [36] and the same data corrected for forward scattering by Hamada [32, 37]. The corrected TCS is in good agreement with our theoretical cross section data.
Download figure:
Standard image High-resolution imageThis is further supported by the work from Sueoka et al [36] and Hamada [32, 37]. Hamada [32, 37] corrected the initially obtained TCS by Sueoka et al [36] for the missing forward scattering based on the method devised by Sueoka and Mori [38] and Sueoka et al [39]. This corrected TCS is in good agreement with our theoretical TCS data (figure 2(b)). To further support the importance of forward scattering at low energies, we have provided the DCS for different angles in the SI (figure S1). The observed difference between the experimentally and theoretically obtained cross section at low energies is in agreement with the recent work on H2O by Kadokura et al [40] and Song et al [41], as well as the earlier experimental works on different gases by Sueoka et al [39] and Hamada and Sueoka [42]. This difference at low energies, due to forward scattering, mainly arises from the elastic scattering cross section, which is discussed in the next section.
For the NH3 TCS, σTCS, we recommend the theoretical data presented here for low-energy electron collisions below 15 eV. Above 15 eV, we recommend the experimental data recommended by Karwasz et al [32] (measured by Szmytkowski et al [33] and Zecca et al [34]) and the high energy data obtained by Ariyasinghe et al [35] (see table S1 in the SI for the full data set).
3.1.2. Elastic scattering.
Two different NH3 elastic scattering cross sections, σelastic, calculated with QEC using the CC method, are presented: (i) results considered as not taking forward scattering into account and (ii) results considered to take the forward scattering into account by incorporating the Born approximation. Below 15 eV, the former results match the theoretical data of Gianturco [43] recommended by Itikawa [31], whereas the cross section for the latter are significantly larger (figure 3). For 15 eV and above, the two results become similar and are in agreement with the experimental data of Homem et al [44] recommended by Itikawa [31].
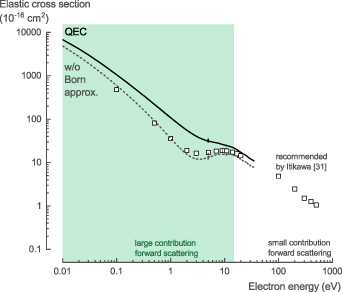
Figure 3. Elastic scattering cross section of NH3 calculated with QEC compared with the recommended values by Itikawa [31]. Agreement is good for higher energies where forward scattering is negligible. For lower energies, the calculations with the Born approximation correction capture the (previously underpredicted) forward scattering contribution.
Download figure:
Standard image High-resolution imageAs mentioned for the TCS, at low incident electron energy (below 10–15 eV), the experimental method used cannot accurately capture the contribution of forward scattered electrons. Our calculations, on the other hand, can capture this contribution by incorporating the Born approximation (figure 3). In combination with the results for the TCS (figure 2), we believe that the larger cross section data below 15 eV is more accurate for our theoretical cross sections (including the Born approximation), whereas the previously recommended values are underestimated.
For the NH3 elastic scattering cross section, σelastic, we recommend the theoretical data with the Born approximation presented here for low-energy electron collisions below 35 eV. Above 35 eV, we recommend the experimental data of Homem et al [44] (see table S2 in the SI for the full data set).
3.1.3. Momentum transfer.
The NH3 momentum transfer cross section (MTCS), σmom, calculated with QEC using the CC method, is in good agreement with the recommended data by Itikawa [31], considering the large uncertainty (±25%) on the recommended data (figure 4). Below 15 eV, there is a minor shift in energies, and the recommended data by Itikawa [31] exhibits a local minima around 2 eV, which is shifted to 3.4 eV in our calculations. This shift results in higher values for our calculations at energies below 3.5 eV and lower values in the range of 3.5–15 eV.
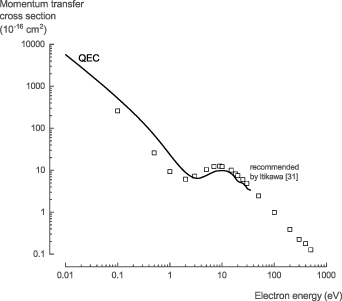
Figure 4. The momentum transfer cross section of NH3 calculated with QEC agrees well with the recommended values by Itikawa [31].
Download figure:
Standard image High-resolution imageFor the NH3 MTCS, σmom, we recommend the theoretical data presented here for low-energy electron collisions below 35 eV, based on the higher accuracy of the method used in this work. Above 35 eV, we recommend the experimental data of Homem et al [44] (see table S3 in the SI for the full data set).
3.1.4. Rotational excitation.
The NH3 rotational excitation cross sections, σrot, calculated with QEC using the CC method, provides data for the transitions (JK) = (00) → (10), (20), (30), (40), and (50). Note that polydcs automatically assumes the selection rule ΔK = 0. For optical transitions, ΔK = 0 is a strong propensity rule for ammonia [45] as it has also shown to be for electron collisions with symmetric top molecular ions [46]. We assumed this to be true in line with all previous theoretical studies. There was no experimental data available in literature for comparison, only two theoretical calculations. Gianturco [43] provided data for the transitions (JK) = (00) → (10), and (20), and Varella et al [47] for the transitions (JK) = (00) → (10), (20), (30), and (40) (figure 5). The results for the transition (JK) = (00) → (20) are remarkably similar to those from Gianturco [43] and Varella et al [47], while for the other transitions, our calculations show similar trends, but different absolute values (figure 5).
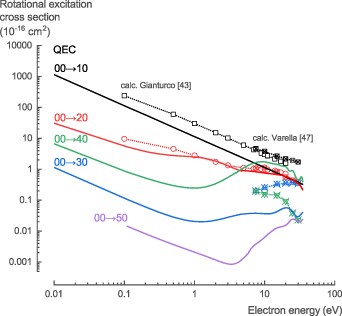
Figure 5. Rotational excitation cross sections of NH3 calculated with QEC compared with calculations from Gianturco [43] and Varella et al [47]. Our QEC calculations give similar trends, but differ in absolute values, except for the (JK) = (00) → (20) transitions.
Download figure:
Standard image High-resolution imageFor the NH3 rotational excitation cross sections, σrot, we recommend the theoretical data presented here, given the lack of experimental data and the higher accuracy of the method used in this work (see table S4 in the SI for the full data set).
3.1.5. Vibrational excitation.
The NH3 vibrational excitation cross sections, σvib, calculated with QEC using the CC method in combination with the procedure of Ayouz et al [19], provide data for excitation of the v1, v2, and both degenerate v3, and v4 vibrational modes. The vibrational frequencies of the different modes are in good agreement with experimental values [48]. They capture the degenerate modes, show similar trends, and had values that are only 3%–12% higher (table 4). There was no comprehensive experimental or theoretical cross section data available in literature. Gulley et al [49] presented an experimental integral cross section value for the combined v1,3 vibrational mode at 7.5 eV, by extrapolating and integrating their differential cross section data. Additionally, Itikawa [31] used the Born approximation to calculate the cross sections for the v1, v2, v3, and v4 vibrational modes.
Table 4. Vibrational frequency of experimental and calculated NH3 vibrational modes.
| Mode | Symmetry | Type | Frequency (exp.) [48] | Frequency (calc.) |
|---|---|---|---|---|
| v1 | a1 | Symmetric stretch | 3337 | 3518.08 |
| v2 | a1 | Symmetric deform | 950 | 1062.48 |
| v3 | e | Degenerate stretch | 3444 | 3663.74 |
| 3663.65 | ||||
| v4 | e | Degenerate deform | 1627 | 1676.34 |
| 1676.24 |
The cross sections calculated with QEC have a more realistic behavior at the threshold energies than those calculated by Itikawa [31]. Additionally, the calculated cross sections for the combined v1,v3 modes show a similar peak around 7.5 eV with a comparable absolute value (0.78 × 10⁻¹⁶ cm2 compared to 0.67 × 10⁻¹⁶ cm2 experimentally), as observed by Gulley et al [49] and Furlan et al [50] (figure 6). Note that the cross sections of both the v3 and the v4 mode in figure 6 are represented by combining their two degenerate modes. Additionally, the sum of the v1 and v3 modes is given for comparison with the other data in literature.
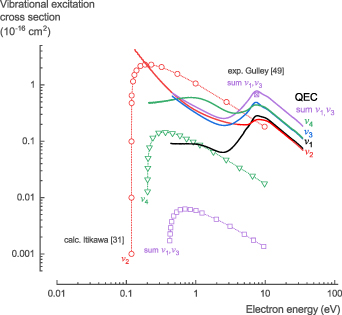
Figure 6. Vibrational excitation cross sections of NH3 calculated with QEC compared with calculations from Itikawa [31] and one experimental point from Gulley et al [49]. Our QEC calculations provide a comparable value to the experimental observations for the sum of the v1,v3 normal mode cross section data and are a significant improvement over the previously calculated values.
Download figure:
Standard image High-resolution imageFor the NH3 vibrational excitation cross sections, σvib, we recommend the theoretical data presented here, given the lack of comprehensive experimental data and the higher accuracy of the method used in this work (see table S5 in the SI for the full data set).
3.1.6. Electronic excitation.
Two different NH3 electronic excitation cross sections, σelec, calculated with QEC using the CC method, are presented: (i) high-energy electron collisions for dipole containing electronic states based on the BEf method and (ii) low-energy electron collisions for any electronic state. There was no experimental data available in literature for comparison; however, Itikawa [31] calculated the cross section of the electronic excitation to the singlet A state (1 A', 1 1 A1, or Ã) using both the Born approximation derived from the analytical function of Harshbarger et al [51] and the BE scaling proposed by Kim [20]. Compared to these results, our calculations based on the BEf method show higher values near the threshold energy with a narrower peak and a more rapid decline of the cross section at higher energies (figure 7(a)). Additionally, compared to the first singlet state, the second singlet state (1 A'', 1 1 E or 1B/C') has a higher threshold energy and lower peak value. However, the BEf method becomes less accurate for low-energy electron collisions (below 50 eV) and is only suitable for dipole-allowed electronic excitations.
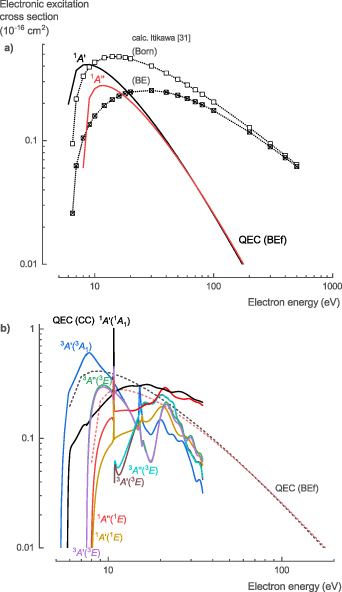
Figure 7. Electronic excitation cross sections of NH3 calculated with QEC; (a) QEC's BEf method results compared with BE and Born method calculations from Itikawa [31], and (b) QEC's CC method results.
Download figure:
Standard image High-resolution imageTherefore, the CC method was used for the calculation of the low-energy cross sections for the electronic excitation to both dipole and non-dipole singlet and triplet states (figure 7(b)). Electronic excitations to triplet states have lower threshold energies and higher peak cross sections compared to their corresponding singlet states; however, they decline more rapidly with increasing energy. This is as expected, based on the optically allowed and forbidden excitations from photodissociation studies [52, 53]. At high energies, the cross sections for excitation towards the singlet dipole states calculated with the CC method aligns with the BEf calculations. At low energies, the BEf calculations are assumed to be overestimated given the higher accuracy of the CC method (figure 7(b)). Finally, the CC calculations show a sharp peak in the cross sections around 10.8 eV for all electronic excitations, which corresponded to the strong resonance observed in the eigenphase diagram (figure 1).
For the NH3 electronic excitation cross sections, σelec, we recommend the theoretical data (CC-method up to 35 eV and BEf method for higher energies) presented here, given the lack of comprehensive experimental data and the higher accuracy of the method used in this work (see table S6 in the SI for the full data set). An overview of the threshold energies for the different electronic excitation processes and their corresponding dissociation channels is discussed in the next section (table 5, section 3.1.7).
Table 5. NH3 electronic excitation thresholds calculated with QEC and determined experimentally. Our QEC results are in good agreement with experimental values. Specific dissociation channels were suggested for the different excited states.
| Symmetry | Threshold | Dissociation channel | |||||
|---|---|---|---|---|---|---|---|
| Cs | C3v | State | Exp. | Calc. | This work | General | Specific |
| 1 A' | 1 1 A1 | X | 0.0 | 0.0 | 0.0 | ||
| 3 A' | 1 3 A1 | a | 5.36 [53] | 5.31 | NH2 + H | NH2 (X 2 B1) + H(2 S) [53] | |
| 1 A' | 2 1 A1 | Ã | 5.73, [53, 64] 5.72 [65, 66] | 5.88 [65] | 5.78 | NH2 + H | NH2 (X 2 B1) + H(2 S) [53] |
| 3 A'' | 1 3 E | b(c) | 7.34 [52, 64, 65] | 7.10 [65] | 7.49 | NH2 + H | NH2 (Ã 2 A1) + H(2 S) |
| 3 A' | 1 3 E | b(c) | 7.37 [52, 64, 65] | 7.21 [65] | 7.49 | NH2 + H | NH2 (Ã 2 A1) + H(2 S) |
| 1 A'' | 1 1 E | B/C' | 7.92 [60, 64, 65] | 7.65 [65] | 7.95 | NH2 + H | NH2 (Ã 2 A1) + H(2 S) [56] |
| 1 A' | 1 1 E | B/C' | 7.92 [60, 64, 65] | 7.65 [65] | 7.95 | NH2 + H | NH2 (Ã 2 A1) + H(2 S) [56] |
| 10.15, [65] 10.5 [69] | 9.86 [65] | 10.89 | Ionization | ||||
| 3 A'' | 2 3 E | 10–14 [52, 67] | 12.06 [52] | 10.85 | NH + H2 | NH(A 3Π) + H2(X 1Σ+) | |
| 3 A' | 2 3 E | 10–14 [52, 67] | 12.06 [52] | 10.85 | NH + H2 | NH(A 3Π) + H2(X 1Σ+) | |
3.1.7. Neutral dissociation.
Electron collisions can lead to dissociation of NH3 through several processes. Dissociative ionization produces positive charged fragments (see section 3.1.8), whereas DEA produces negatively charged fragments (see section 3.1.9). Additionally, the electronic excitation discussed above (section 3.1.6) can produce neutral fragments when the excited state is repulsive and dissociates [54]. These electron impact dissociation processes are essential for plasma gas-processing because they are the main driver behind its reactivity through the production of radicals. Additionally, these processes can lead to dissociation products with a large amount of kinetic energy (hot fragments) that can play an important role in subsequent gas heating [54]. However, since there exists no straightforward way to reasonably calculate or estimate the energy of these fragments for NHx , this falls outside the scope of the current work.
NH3 does not have any known metastable states [55] and has three potential dissociation channels: (i) NH2 + H, (ii) NH + H2, and (iii) NH + H + H. An assignment of these channels to the different electronic excited states is suggested (table 5) based on limited experimental electron collision data [56–60] and extensive photodissociation data [53, 61–68].
The threshold energies calculated with QEC for the different electronically excited states are in excellent agreement with experimental data (table 5). Excitations of the ground state 1 1 A1 (X) to the 1 3 A1 (a, Ethreshold = 5.31 eV) and 2 1 A1 (Ã, Ethreshold = 5.78 eV) states are assigned to channel one, NH2 + H. Both states are considered to dissociate to NH2(X 2 B1) + H(2 S) [53]. This assessment is in agreement with the observation that below 9.4 eV, all photodissociation leads to NH2 [11], and with the absence of NH(A 3Π) and NH(c 1Π) below 10 eV in electron collision studies [53].
Excitations to the 1 3 E (degenerate b(c): 3 A'' and 3 A', Ethreshold = 7.49 eV) and 1 1 E (degenerate B/C': 1 A'' and 1 A', Ethreshold = 7.95 eV) could possibly be assigned to a combination of channels one, NH2 + H, and two, NH + H2. However, we consider excitation to both states to dissociate to NH2 + H, more specific, NH2(Ã 2 A1) + H(2 S). This is based on available experimental data, which gave a threshold of around 10 eV (9.0 ± 1.0 or 10.5 ± 0.5 eV) for NH(c 1Π) production and a very low cross section compared to the values obtained here [56–59]. Additionally, NH(A 3Π) production also seemed to have a primary threshold of ∼9–10 eV (8 ± 1, 9.0 ± 1.0 or 9.0 ± 0.5 eV), but only became significant after a second threshold around 12.3 eV [56–59]. Similarly, Heays et al [11] gave a 9.4 eV threshold for NH production. Hence, these experimental studies indicate that dissociation channel two requires higher electron energies.
Excitation to higher states 2 3 E (degenerate: 3 A'' and 3 A', Ethreshold = 10.85 eV) could be assigned to a combination of channels two, NH + H2, and three, NH + H + H. We consider excitation to the 2 3 E state to dissociate to NH + H2, more specific, to NH(A 3Π) + H2(X 1Σ+). On the basis of the spin conversion rule the precursor for NH(c 1Π) should be a singlet, while for NH(A 3Π) it could be a triplet or singlet. Additionally, the 2 3 E state's excitation threshold exceeds the primary threshold of ∼9–10 eV for NH(A 3Π) production [56–59]. Furthermore, according to Heays et al [11], above 10.24 eV, 95% of the dissociation leads to NH and only 5% to NH2. According to Leach et al [53], channels leading to NH + H + H were observed above 13 eV, while Muller and Schulz [56] discussed a steep rise in NH(A 3Π) above 12 eV related to dissociation into NH(A 3Π) + H + H. Hence, these experimental studies indicate that channel three requires higher electron energies.
3.1.8. Ionization.
The NH3 ionization cross sections, σion, are well studied experimentally. Tarnovsky et al [70] confirmed that there is no significant difference between the ionization cross sections for NH3 and ND3. Thus, Rejoub et al [71] used ND3 to determine both the total and partial ionization cross sections of NH3. Our theoretical calculations relied on the BEB method of Kim and Rudd [21] to determine the total ionization cross section. Based on the total cross section, we used the method suggested by Hamilton et al [16] to determine the partial ionization cross sections.
Because the data of Rejoub et al [71] contained all the different ionization fragments, especially H+, the method of Hamilton et al [16] did not suffer from a divergence at higher energies and gave reliable predictions of the dissociative ionization cross sections (figure 8). At energies below 100 eV, the total ionization cross section calculated with QEC is up to 50% higher than the experimental measured data, while for energies above 100 eV, they are in excellent agreement. The theoretical partial ionization cross sections shows good agreement with the experimental data. At energies below 100 eV, the theoretical dissociative ionization cross sections of the dominant fragments, NH3 + and NH2 +, are slightly overestimated. At energies above 100 eV, the theoretical dissociative ionization cross sections of the NH3 + fragment is slightly underestimated, and that of the other fragments slightly overestimated.

Figure 8. Total and partial ionization cross sections of NH3 calculated with QEC compared with experimental data from Rejoub et al [71]; showing good agreement.
Download figure:
Standard image High-resolution imageFor the NH3 ionization cross sections, σion, we recommend the experimental data of Rejoub et al [71], given the comprehensive experimental data with small uncertainties and the good agreement with our theoretical cross sections (see table S7 in the SI for the full data set).
3.1.9. DEA.
The NH3 DEA cross sections, σDEA, are well studied experimentally. Rawat et al [72] determined both the total and partial DEA cross sections. Our theoretical calculations relied on the DEA estimation method of Munro et al [22] to estimate the total DEA cross section. The total DEA cross section estimated with QEC reasonably predicts the location of both experimentally observed peaks (figure 9). The location of the first peak at 4.97 eV is underestimated by 0.8 eV (±16%) and its width is about half, while the location and width of the second peak at 10.57 eV are in perfect agreement. Both peaks correspond to Feshbach resonances in the eigenphase diagram (figure 1). The height of the theoretical cross section at the peaks is in the same order of magnitude as the experimental data but overestimated by approximately a factor 3 for the first peak and a factor 13 for the second peak.

Figure 9. Total dissociative electron attachment cross section of NH3 calculated with QEC compared with experimental total and partial dissociative electron attachment cross section data from Rawat et al [72].
Download figure:
Standard image High-resolution imageFor the NH3 DEA cross sections, σDEA, we recommend the experimental data of Rawat et al [72], given the comprehensive experimental data with small uncertainties and the qualitative agreement with our estimated theoretical cross sections (see table S8 in the SI for the full data set).
3.1.10. Overview.
In general, the theoretical cross section data for electron collisions with NH3 (calculated with QEC) is in good agreement with the data available in literature and provides (i) improved data at low-energy collisions (below 15 eV) for σtot, σel, and σmom; (ii) more accurate data for σrot and σvib; (iii) the first comprehensive data for σexc; and (iv) data that is in qualitative agreement with experimental data for σion and σDEA. Based on the comparison of our theoretical data with that available in literature, several new recommendations are made regarding the cross sections for electron collisions with NH3 (figure 10, see SI for the full data set).
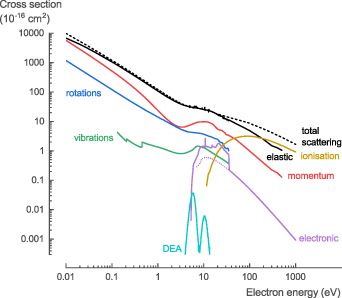
Figure 10. Overview of the recommended cross sections for the electron collisions with NH3 in this work.
Download figure:
Standard image High-resolution image3.2. Amino radical/amidogen (NH2)
In contrast to NH3, there was almost no experimental data available in literature for a thorough comparison of our cross sections calculated with QEC. The only exception was (incomplete) measured partial ionization cross sections from Tarnovsky et al [70]. Additionally, there was very limited theoretical data available: total ionization cross section data from Johipura et al [73]; theoretical elastic differential, integral, and MTCSs by Homem et al [44]; and a less comprehensive theoretical R-matrix study by Bharadvaja et al [74]. Nevertheless, given the good agreement of our approach with the recommended data for the electron collision cross sections with NH3 (section 3.1), we are confident that the same approach applied for the electron collision cross sections with NH2 provides a comprehensive theoretical cross section data set that is a reasonable first representation.
NH2 is an open-shell target with a C2v point group symmetry. The calculations were performed in the C2v symmetry. The ground-state Hartree-Fock electronic configuration of NH2 in the C2v symmetry is ( ). For the CC scattering calculations, we used the Complete Active Space-Configuration Interaction (CAS-CI) model to represent the target wavefunction with cc-pVQZ basis set and eight target states. Of the nine available electrons, two were frozen in the
  molecular orbital, while the remaining seven electrons were located in the CAS composed of the
  molecular orbitals with two additional virtual orbitals (
 ). For the SEP scattering calculations, 25 additional virtual orbitals were used. An inner region radius of 10a0 was more than sufficient to accommodate the target electrons' charge cloud and provided stable calculations.
The present CC method predicts the ground-state energy of NH2 to be −55.526 Hartree. The lowest doublet and quartet excited-states thresholds are 2.31 and 7.74 eV, respectively. In general, the vertical excitation energies to the eight lowest-lying electronic excited doublets and quartets compare well with data from literature (see sections 3.2.6 and 3.2.7, table 6).
Table 6. The NH2 electronic excitation thresholds calculated with QEC and the specific dissociation channels suggested for the different excited states.
| Symmetry | Threshold | Dissociation channel | |||||
|---|---|---|---|---|---|---|---|
| Cs | C3v | State | Exp. | Calc. | This work | General | Specific |
| 2 B1 | 1 2 B1 | X | 0.0 | 0.0 | 0.0 | ||
| 2 A1 | 1 2 A1 | A | 2.07 [78] | 2.20, [76] 2.26, [77] 2.27 [74] | 2.31 | Bound/Metastable [76] | Correlated products NH(a 1Δ) + H(2 S) [76, 77] |
| 2 B2 | 1 2 B2 | B | n.a. | 6.50, [76, 77] 6.90 [74] | 7.02 | NH + H | NH(b 1Σ+) + H(2 S) [76] |
| 4 B1 | 1 4 B1 | n.a. | 7.40 [75] | 7.74 | NH + H | NH(X 3Σ−) + H(2 S) [76, 77] | |
| 2 A1 | 2 2 A1 | 7.60 [75] | 7.55, [76] 7.77, [77] 7.78 [75] | 8.00 | NH + H | NH(A 3Π) + H(2 S) [75–77] | |
| N + H2 | N(2 P) + H2(1Σ+) [76] | ||||||
| 2 B1 | 2 2 B1 | n.a. | 7.49, [77] 7.62, [76] 7.90 [75] | 8.92 | NH + H | NH(a 1Δ) + H(2 S) [76, 77] | |
| N + H2 | N(2 P) + H2(1Σ+) [76] | ||||||
| 2 B1 | 3 2 B1 | n.a. | 9.38, [76] 9.57, [77] 9.80 [75] | 10.20 | NH + H | NH(A 3Π) + H(2 S) [75, 76] | |
| NH(c 1Π) + H(2 S) [76] | |||||||
| N + H2 | N(2 P) + H2(1Σ+) [76] | ||||||
| 4 A2 | 1 4 A2 | n.a. | 8.95 [75] | 11.49 | NH + H | NH(A 3Π) + H(2 S) [77] | |
| NH(a 1Δ) + H(2 S) [76] | |||||||
| 2 A2 | 1 2 A2 | n.a. | 9.25, [75] 9.09 [76] | 12.97 | NH + H | NH(A 3Π) + H(2 S) [75, 76] | |
| 11.5 | 10.49–12.91, [75] 13.64 [74] | 13.23 | Ionization | ||||
The NH2 eigenphase diagram for the corresponding total symmetries 1 A1, 3 A1, 1 B1, 3 B1, 1 B2, 3 B2, 1 A2, and 3 A2, using the SEP method in the C2v point group symmetry, shows resonances at 10.28 (3 B1), 10.85 (1 A1,), 11.47 (3 A2), 11.60 (3 B2), 11.99 (1 A2), 12.49 (1 B1), 13.11 (3 A2), 13.47 (3 A2), 13.99 (3 A2), 14.50 (1 B2), 14.53 (3 B1), 14.74 (3 B1), and 14.90 (1 A2) eV (figure 11(a)). The CC method shows resonances at 7.87 (1 A1) and 10.06 (1 B1) eV (figure 11(b)). Both these resonances are Feshbach resonances, which drive the DEA process discussed in section 3.2.8. Additionally, they are also related to sharp peaks in the cross sections for the electronic excitation process (see section 3.2.6).

Figure 11. Calculated eigenphase for the different symmetries of NH2; (a) SEP and (b) CC method. Two Feshbach resonances are present at 7.87 (1 A1) and 10.06 (1 B1) eV for the CC method.
Download figure:
Standard image High-resolution image3.2.1. TCS.
The NH2 TCS, σTCS, is the sum of both the elastic and inelastic scattering cross sections. The TCS of NH2 (figure 12) calculated with QEC, based on the integrated DCS obtained using the CC method, shows a similar trend and absolute values as for NH3 (figure 2).
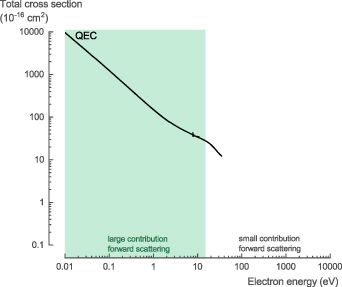
Figure 12. Total scattering cross section of NH2 calculated with QEC.
Download figure:
Standard image High-resolution imageFor the NH2 TCS, σTCS, we recommend the theoretical data presented here, given the lack of comprehensive experimental data and the high accuracy of the method used in this work (see table S9 in the SI for the full data set).
3.2.2. Elastic scattering.
Two different NH2 elastic scattering cross sections, σelastic, calculated with QEC using the CC method, are presented: (i) results considered as not taking forward scattering into account and (ii) results considered to take the forward scattering into account by incorporating the Born approximation. Below 15 eV, the latter results are significantly larger, but above 15 eV, the two results become similar (figure 13). Based on the comparison of our theoretical calculations for NH3 with experimental data (figure 3, section 3.1.2), we believe that the larger cross section data including the Born approximation is more accurate.

Figure 13. Elastic scattering cross section of NH2 calculated with QEC, with and without the Born approximation correction.
Download figure:
Standard image High-resolution imageFor the NH2 elastic scattering cross section, σelastic, we recommend the theoretical data with the Born approximation presented here, given the lack of comprehensive experimental data and the high accuracy of the method used in this work (see table S10 in the SI for the full data set).
3.2.3. MTCS.
The NH2 MTCS, σmom, calculated with QEC using the CC method (figure 14), shows a slightly different trend and absolute values as that for NH3 (figure 4). There was no experimental data available in literature for comparison.

Figure 14. Momentum transfer cross section of NH2 calculated with QEC.
Download figure:
Standard image High-resolution imageFor the NH2 MTCS, σmom, we recommend the theoretical data presented here, given the lack of comprehensive experimental data and the high accuracy of the method used in this work (see table S11 in the SI for the full data set).
3.2.4. Rotational transition.
The NH2 rotational excitation cross sections, σrot, calculated with QEC using the CC method, provides data for the transitions J = 0 → 1, 2, 3, 4, and 5 (see figure 15). Note that NH2 is an asymmetric top, so there are (2 J + 1) distinct levels for each J. However, this substructure is closely spaced and not accounted for by polydcs, so we did not consider it. There was no experimental data available in literature for comparison.

Figure 15. Rotational excitation cross sections of NH2 calculated with QEC for J = 0 → J' transitions.
Download figure:
Standard image High-resolution imageFor the NH2 rotational excitation cross sections, σrot, we recommend the theoretical data presented here, given the lack of experimental data and the high accuracy of the method used in this work (see table S12 in the SI for the full data set).
3.2.5. Vibrational excitation.
The current method only allowed vibrational excitation cross sections of closed-shell molecules to be calculated with QEC. Hence, only data for the electron collision cross sections for the vibrational excitation of NH3 is provided (figure 6, section 3.1.5).
3.2.6. Excitation of electronic states.
Two different NH2 electronic excitation cross sections, σelec, calculated with QEC using the CC method, are presented: (i) high-energy electron collisions for dipole containing electronic states based on the BEf method (figure 16(a)) and (ii) low-energy electron collisions for any electronic state (figure 16(b)). There was no experimental data available in literature for comparison. The BEf method becomes less accurate for low-energy electron collisions (below 50 eV) and is only suitable for dipole-allowed electronic excitations.

Figure 16. Electronic excitation cross sections of NH2 calculated with QEC; (a) BEf method results and (b) CC method results.
Download figure:
Standard image High-resolution imageTherefore, the CC method was used for the calculation of the low-energy cross sections for the electronic excitation to both dipole and non-dipole doublet and quartet states (figure 16(b)). The cross sections, calculated with both the CC method and the BEf calculations, show similar trends but slightly different absolute values. For the 2 A1 states, the values of the BEf calculations are lower than for the CC calculations. For the 2 B1 and 2 A2 states, on the other hand, the values of the BEf calculations are higher than for the CC calculations. Finally, the CC calculations show sharp peaks in the cross sections around 7.87 and 10.06 eV for the electronic excitation to the 2 A1, 2 B1, and 2 B2 states, which corresponded to the strong resonances observed in the eigenphases (figure 11).
For the NH2 electronic excitation cross sections, σelec, we recommend the theoretical data (CC-method up to 35 eV and BEf method for higher energies) presented here, given the lack of comprehensive experimental data and the high accuracy of the method used in this work (see table S13 in the SI for the full data set). An overview of the threshold energies for the different electronic excitation processes and their corresponding dissociation channels is discussed in the next section (table 6, section 3.2.7).
3.2.7. Neutral dissociation.
Electron collisions can lead to dissociation of NH2 through several processes. Dissociative ionization produces positive charged fragments (see section 3.2.8), whereas DEA produces negatively charged fragments (see section 3.2.9). Additionally, the electronic excitation discussed above (section 3.2.6), produces neutral fragments when the excited state is repulsive and dissociates [54]. These electron impact dissociation processes are essential for plasma gas-processing because they are the main driver behind its reactivity through the production of radicals.
In contrast to NH3, NH2 does have a known metastable (bound) excited state with a lifetime around 10 μs [61]; NH2 has three potential dissociation channels: (i) NH + H, (ii) N + H2, and (iii) N + H + H. An assignment of these channels to the different electronic excited states is suggested (table 6) based on PEC calculations (see SI, figure S2) in combination with limited photodissociation data [11, 75–78].
The threshold energies, calculated with QEC, for the different electronically excited states are mostly similar to previous calculated data (table 6). Excitation of the ground state 1 2 B1 (2X) to the 1 2 A1 (A, Ethreshold = 2.31 eV) generates a bound electronic state. All other electronic excitations discussed here result in more or less strongly repulsive states [76] and are assigned to channel one, NH + H: the 1 2 B2 (2B) state is considered to dissociate to NH(b 1Σ+) + H(2 S) [76]; the 1 4B1 state to NH(X 3Σ−) + H(2 S) [75–77]; the 2 2 A1 and 1 2 A2 states to NH(A 3Π) + H(2 S) [75–77]; the 2 2B1 state to NH(a 1Δ) + H(2 S) [76, 77]; the 3 2 B1 state to NH(c 1Π) + H(2 S) [76] and/or NH(A 3Π) + H(2 S) [75, 76]; and the 1 4 A2 state to NH(a 1Δ) + H(2 S) [75] and/or NH(A 3Π) + H(2 S) [77]. Furthermore, the 2 2 A1, 2 2 B1, and 3 2 B1 can be assigned theoretically to channel two and dissociate to N(2 P) + H2(1Σ+) [76]; however, its branching ratio is expected to be minimal. It is important to note that the a 1Δ, b 1Σ+, A 3Π, and c 1Π states of NH can predissociate via the energy crossing of the repulsive 1 5Σ− state (see section 3.3.7) [79]. The determined curve intersect energies of the 1 5Σ− state with the a 1Δ, b 1Σ+, A 3Π, and c 1Π states from the ground state minimum are 4.246, 4.79, 5.878, and 5.062 eV, respectively [79].
3.2.8. Ionization.
The NH2 ionization cross sections, σion, were the only NH2 cross sections for which experimental data was available. Having confirmed that there is no significant difference between the ionization cross sections for NH3 and ND3, Tarnovsky et al [70] determined partial ionization cross sections for NH2 using ND2. Unfortunately, N+ and D+ ions could not be detected in their experimental set-up. As a result, the partial ionization cross sections were limited to the ND2 + and ND+ ionization channels of ND2, and the derived total ionization cross section of NH2 is expected to be underestimated. Our theoretical calculations relied on the BEB method of Kim and Rudd [21] to determine the total ionization cross section. Based on the total cross section, we used a hybrid method, similar to the one proposed by Graves et al [80], to determine the partial ionization cross sections. The difference in total ionization cross section between the experiment and the QEC calculation was considered to originate from the missing experimental N+ and D+ (H+) partial ionization cross sections. As a first step, we determined the branching ratio to the different fragments. The branching ratio between NH2 + and NH+ was derived from the experimental data, whereas the branching ratio between the N+ and H+ was derived from the method proposed by Huber et al [81] and assigned to the difference between the experimental and theoretical total cross section at 70 eV. Next, the different partial ionization cross sections were calculated based on the total cross section and the branching ratio at 70 eV, using the method suggested by Hamilton et al [16]. For more details and a comparison of the hybrid method used with the methods proposed by Huber et al [81] and Hamilton et al [16] see the SI (figure S4). For an in-depth comparison of different methods to obtain the partial ionization cross sections from the total ionization cross section, see the work of Graves et al [80].
In general, the calculated partial ionization cross sections, derived from the theoretical total ionization cross section using the hybrid method, show good agreement with the experimental data (figure 17). They result in a slightly higher threshold energy for the NH2 + channel: 13.2 eV compared to the 11.5 ± 0.5 eV found experimentally. At energies above 30 eV, the theoretical total ionization cross section is higher than the experimentally measured data, but as mentioned above, this is due to the missing N+ and H+ partial ionization cross section data in the experiment. At energies below 70 eV, the theoretical dissociative ionization cross sections of the NH+ fragment is slightly underestimated. At energies above 100 eV, the theoretical dissociative ionization cross section of the NH2 + fragment is slightly lower than the experimental values, but it shows a physically more realistic trend compared to the experimental values.
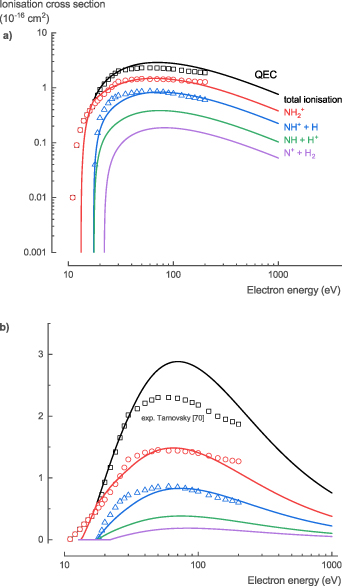
Figure 17. Total and partial ionization cross sections of NH2 calculated with QEC compared with experimental data from Tarnovsky et al [70]; showing good agreement.
Download figure:
Standard image High-resolution imageFor the NH2 ionization cross sections, σion, we recommend the theoretical data presented here, given the good agreement of our theoretical cross sections with experimental data for NH3 and with the incomplete experimental data for NH2 (see table S14 in the SI for the full data set).
3.2.9. DEA.
The NH2 DEA cross sections, σDEA, had not been studied experimentally. Our theoretical calculations relied on the DEA estimation method of Munro et al [22] to estimate the total DEA cross section. The dissociative attachment process is expected to mainly lead to NH + H- with a negligible contribution of the process NH- + H due to the significantly higher electron affinity of H (0.754 eV) compared to NH (0.370 eV).
The total DEA cross section estimated with QEC predicts two overlapping peaks, one at 7.80 eV and one at 9.86 eV (figure 18). Both peaks corresponded to Feshbach resonances in the eigenphase diagram (figure 11). As discussed for NH3 (section 3.1.9), the locations of the peaks should be reasonably accurate, whereas the height of the theoretical cross section at the peaks is most probably overestimated up to one order of magnitude.

Figure 18. Total dissociative electron attachment cross sections of NH2 calculated with QEC.
Download figure:
Standard image High-resolution imageFor the NH2 DEA cross sections, σDEA, we recommend the estimated theoretical data presented here, given the lack of comprehensive experimental data and the reasonable qualitative agreement of our theoretical cross sections with experimental data for NH3 (see table S15 in the SI for the full data set).
3.2.10. Overview.
In general, the theoretical cross section data for electron collisions with NH2, calculated with QEC, provides a comprehensive set of cross sections for the low-energy collisions: σtot, σel, σmom, σrot, σexc, an estimation for σDEA, and more accurate and complete data for σion. Based on the comparison of our theoretical data with the limited data available in literature, several new recommendations are made regarding the cross sections for electron collisions with NH2 (figure 19, see SI for the full data set).

Figure 19. Overview of the recommended cross sections for the electron collisions with NH2 in this work.
Download figure:
Standard image High-resolution image3.3. Imidogen (NH)
In contrast to NH3, but like NH2, there was almost no experimental data available in literature for a thorough comparison of our cross sections calculated with QEC. The only exception was (incomplete) measured partial ionization cross sections from Tarnovsky et al [70]. Additionally, there was very limited theoretical data available: theoretical total ionization cross section data from Johipura et al [73], and less comprehensive theoretical R-matrix studies by Gupta et al [82], and Rajvanshi and Baluja [83]. Nevertheless, given the good agreement of our approach with the recommended data for the electron collision cross sections with NH3 (section 3.1), we are confident that the same approach applied for the electron collision cross sections with NH provides a comprehensive theoretical cross section data set that is a reasonable first representation.
NH is an open-shell target with a C∞v point group symmetry. The calculations were performed in the C2v symmetry, which is a subgroup of C∞v. The ground-state Hartree–Fock electronic configuration of NH in the C2v symmetry is ( ). For the CC scattering calculations, we used the Complete Active Space-Configuration Interaction (CAS-CI) model to represent the target wavefunction with cc-pVQZ basis set and 16 target states. Of the eight available electrons, two were frozen in the
  molecular orbital, while the remaining six electrons were located in the CAS composed of the
  molecular orbitals with two additional virtual orbitals (
 ). For the SEP scattering calculations, 25 additional virtual orbitals were used. An inner region radius of 10a0 was more than sufficient to accommodate the target electrons' charge cloud and provided stable calculations.
The present CC method predicts the ground-state energy of NH to be −54.978 Hartree. The singlet and triplet excited-states thresholds are 1.90 and 3.92 eV. In general, the vertical excitation energies to the twenty-one lowest-lying electronic excited singlets, triplets, and quintuplets compare well with data from literature (see sections 3.3.6 and 3.3.7, table 7).
Table 7. NH electronic excitation thresholds calculated with QEC and the specific (pre)dissociation channels suggested for the different excited states.
| Symmetry | Threshold | Dissociation channel | |||||
|---|---|---|---|---|---|---|---|
| Cs | C3v | State | Exp. | Calc. | This work | General | Specific |
| 3 A2 | 1 3 A2 | X 3Σ− | 0.0 | 0.0 | 0.0 | ||
| 1 A2 | 1 1 A2 | a 1Δ | 1.56, [79] 1.56, [30] 1.6 [55, 63] | 1.73, 1.83, [79] 1.94 [82] | 1.90 | Bound [79, 84] | Predissociation [79] N(4 S) + H(2 S) [85] |
| 1 A1 | 1 1 A1 | a 1Δ | 1.56, [79] 1.56, [30] 1.6 [55, 63] | 1.73, 1.83, [79] 1.94 [82] | 1.90 | Bound [79, 84] | Predissociation [79] N(4 S) + H(2 S) [85] |
| 1 A1 | 2 1 A1 | b 1Σ+ | 2.63, [79] 2.67 [55, 63] | 2.82 [79, 82] | 2.77 | Bound [79, 84] | Predissociation [79] N(4 S) + H(2 S) [85] |
| 3 B2 | 1 3 B2 | A 3Π | 3.58, [85] 3.69, [55] 3.70 [30] | 3.71, 4.00, [85] 3.84, [79] 4.12 [82] | 3.92 | Bound [79, 84, 85] | Predissociation [79] N(4 S) + H(2 S) [85] |
| 3 B1 | 1 3 B1 | A 3Π | 3.69, [55] 3.70 [30] | 3.71, [79] 4.12 [82] | 3.92 | Bound [79, 84, 85] | Predissociation [79] N(4 S) + H(2 S) [85] |
| 1 B1 | 1 1 B1 | c 1Π | 5.42, [55] 5.42, [79] 5.43 [30] | 5.47, 6.01, [79] 6.14 [82] | 6.25 | Bound [79, 84] | Predissociation [79] N(4 S) + H(2 S) [85] |
| 1 B2 | 1 1 B2 | c 1Π | 5.42, [79], 5.43 [30] | 5.47, 6.01, [79] 6.14 [82] | 6.25 | Bound [79, 84] | Predissociation [79] N(4 S) + H(2 S) [85] |
| 5 A2 | 1 5 A2 | 1 5Σ− | n.a. | 8.65, 8.88, [79, 85] 8.78 [82] | 8.21 | N + H | N(4 S) + H(2 S) [85] |
| 3 B2 | 2 3 B2 | B 3Π | n.a. | 8.72, 8.86, [79, 85] 9.30 [82] | 8.59 | N + H | N(2 P) + H(2 S) [85] |
| 3 B1 | 2 3 B1 | B 3Π | n.a. | 8.72, 8.86, [79, 85] 9.30 [82] | 8.59 | N + H | N(2 P) + H(2 S) [85] |
| 1 B2 | 2 1 B2 | d 1Π | n.a. | 9.09, [79] 9.70 [82] | 9.17 | N + H | N(2 P) + H(2 S) |
| 1 B1 | 2 1 B1 | d 1Π | n.a. | 9.09, [79] 9.70 [82] | 9.17 | N + H | N(2 P) + H(2 S) |
| 3 A2 | 2 3 A2 | 1 3Δ | n.a. | 9.41 [79] | 10.10 | N + H | N(2 D) + H(2 S) |
| 3 A2 | 3 3 A2 | 2 3Σ− | n.a. | 10.75, [79] 9.59 [79, 85] | 11.42 | N + H | N(2 D) + H(2 S) [85] |
| 3 A1 | 1 3 A1 | 2 3Σ− | n.a. | 10.75, [79] 9.59 [79, 85] | 11.42 | N + H | N(2 D) + H(2 S) [85] |
| 1 A1 | 2 1 A1 | 3 1Π | n.a. | 10.90 [79] | 11.42 | Bound [79] | Predissocisation N(2 D) + H(2 S) |
| 1 A2 | 2 1 A2 | 1 1Σ− | n.a. | 10.69 [79] | 12.09 | N + H | N(2 D) + H(2 S) |
| 3 A1 | 2 3 A1 | 1 3Σ+ | n.a. | 10.98 [79] | 12.37 | N + H | N(2 P) + H(2 S) |
| 3 A2 | 4 3 A2 | 3 3Σ− | n.a. | 10.83, [79] 10.70 [79, 85] | 12.38 | Bound [79, 85] | Predissocisation N(2 P) + H(2 S) |
| 1 A1 | 3 1 A1 | 2 1Σ− | n.a. | 11.17 [79] | 13.79 | Bound [79] | Predissocisation N(2 P) + H(2 S) |
| 1 A2 | 3 1 A2 | 2 1Σ− | n.a. | 11.17 [79] | 13.79 | Bound [79] | Predissocisation N(2 P) + H(2 S) |
| 13.6 | 14.61 | Ionization | |||||
The NH eigenphase for the corresponding total symmetries 2 A1, 4 A1, 2 B1, 4 B1, 2 B2, 4 B2, 2 A2, and 4 A2 using the SEP method in the C2v point group symmetry show resonances at 0.33 (2Π; 2 B1/2 B2), 4.68 (2Δ; 2 A2), 12.33 (2Δ; 2 A2), 12.63 (4 A2), 13.41 (2Δ; 2 A2), and 13.46 (2Π; 2 B1/2 B2) (figure 20(a)). The CC method shows more complicated trends for NH, which makes it difficult to differentiate real resonances from artefacts (figure 20(b)). This behavior is possibly the result of the large number of low lying electronic excited states.
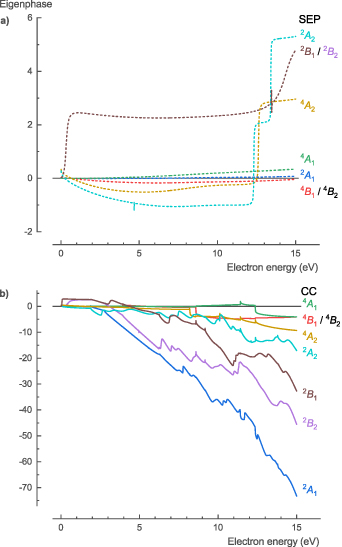
Figure 20. Calculated eigenphase for the different symmetries of NH; (a) SEP and (b) CC method.
Download figure:
Standard image High-resolution image3.3.1. TCS.
The TCS, σTCS, is the sum of both the elastic and inelastic scattering cross sections. The calculated TCS of NH (figure 21) calculated with QEC, based on the integrated DCS obtained using the CC method, shows a similar trend and absolute values as for NH3 (figure 2).
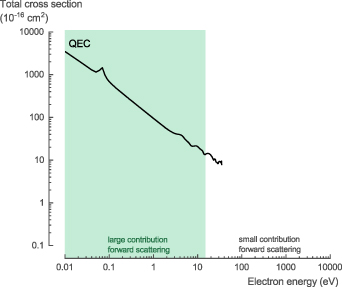
Figure 21. Total scattering cross section of NH calculated with QEC.
Download figure:
Standard image High-resolution imageFor the NH TCS, σTCS, we recommend the theoretical data presented here, given the lack of comprehensive experimental data and the high accuracy of the method used in this work (see table S16 in the SI for the full data set).
3.3.2. Elastic scattering.
Two different NH elastic scattering cross sections, σelastic, calculated with QEC using the CC method, are presented: (i) results considered as not taking forward scattering into account and (ii) results considered to take the forward scattering into account by incorporating the Born approximation. Below 15 eV, the latter results are significantly larger, but above 15 eV, the two results become similar (figure 22). Based on the comparison of our theoretical calculations for NH3 with experimental data (figure 3, section 3.1.2), we believe that the higher cross section data including the Born approximation is more accurate.
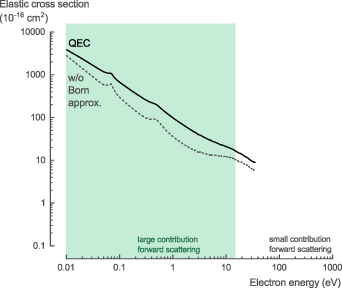
Figure 22. Elastic scattering cross section of NH calculated with QEC, with and without the Born approximation correction.
Download figure:
Standard image High-resolution imageFor the NH elastic scattering cross section, σelastic, we recommend the theoretical data with the Born approximation presented here, given the lack of comprehensive experimental data and the high accuracy of the method used in this work (see table S17 in the SI for the full data set).
3.3.3. MTCS.
The NH MTCS, σmom, calculated with QEC using the CC method (figure 23), shows a similar trend and absolute values as for NH3 (figure 4). There was no experimental data available in literature for comparison.
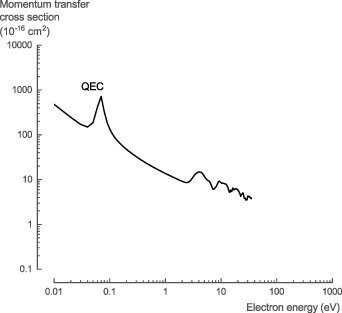
Figure 23. Momentum transfer cross section of NH calculated with QEC.
Download figure:
Standard image High-resolution imageFor the NH MTCS, σmom, we recommend the theoretical data presented here, given the lack of comprehensive experimental data and the high accuracy of the method used in this work (see table S18 in the SI for the full data set).
3.3.4. Rotational transition.
The NH rotational excitation cross sections, σrot, calculated with QEC using the CC method, provides data for the transitions J = 0 → 1, 2, 3, 4, and 5 (figure 24). There was no experimental data available in literature for comparison.

Figure 24. Rotational excitation cross sections of NH calculated with QEC for J = 0 → J' transitions.
Download figure:
Standard image High-resolution imageFor the NH rotational excitation cross sections, σrot, we recommend the theoretical data presented here, given the lack of experimental data and the high accuracy of the method used in this work (see table S19 in the SI for the full data set).
3.3.5. Vibrational excitation.
The current method only allowed vibrational excitation cross sections of closed-shell molecules to be calculated with QEC. Hence, only data for the electron collision cross sections for the vibrational excitation of NH3 is provided (figure 6, section 3.1.5).
3.3.6. Excitation of electronic states.
Two different NH electronic excitation cross sections, σelec, calculated with QEC using the CC method, are presented: (i) high-energy electron collisions for dipole containing electronic states based on the BEf method (figure 25(a)) and (ii) low-energy electron collisions for any electronic state (figure 25(b)). There was no experimental data available in literature for comparison. The BEf method becomes less accurate for low-energy electron collisions (below 50 eV) and is only suitable for dipole-allowed electronic excitations.
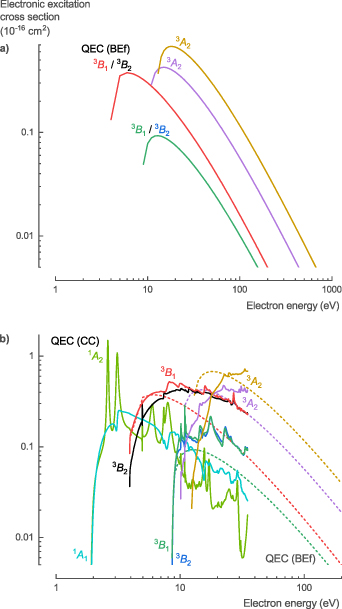
Figure 25. Electronic excitation cross sections of NH calculated with QEC; (a) BEf method results and (b) CC method results.
Download figure:
Standard image High-resolution imageTherefore, the CC method was used for the calculation of the low-energy cross sections for the electronic excitation to both dipole and non-dipole singlet, triplet, and quintuplet states (figure 25(b)). Note, only a select number of electronic excited states are shown in figure 25(b), complete cross section data for the 21 lowest electronic excitations can be found in the SI. The cross sections calculated with both the CC method and the BEf calculations show similar trends, but slightly different absolute values.
For the NH electronic excitation cross sections, σelec, we recommend the theoretical data (CC-method up to 15 eV and BEf method for higher energies) presented here, given the lack of comprehensive experimental data and the high accuracy of the method used in this work (see table S20 in the SI for the full data set). An overview of the threshold energies for the different electronic excitation processes and their corresponding dissociation channels is discussed in the next section (table 7, section 3.3.7).
3.3.7. Neutral dissociation.
Electron collisions can lead to dissociation of NH through several processes. Dissociative ionization produces positive charged fragments (see section 3.3.8), whereas DEA produces negatively charged fragments (see section 3.3.9). Additionally, the electronic excitation discussed above (section 3.3.6) produces neutral fragments when the excited state is repulsive and dissociates [54]. These electron impact dissociation processes are essential for plasma gas-processing because they are the main driver behind its reactivity through the production of radicals.
In contrast to NH3, but like NH2, NH does have known metastable (bound) excited states with a lifetime of 2–18 ms [61]. Additionally, it has only one potential dissociation channel: N + H. An assignment of the different bound states and this channel to the different electronic excited states is suggested (table 7) based on PEC calculations (see SI figure S3) in combination with limited photodissociation data [11, 55, 63, 79, 84, 85].
The threshold energies calculated with QEC for the different electronically excited states are mostly similar to previous calculated and experimental data (table 7). At low energies, excitation of the ground state 1 3 A2 (X 3Σ−) to the 1 1 A2 and 1 1 A1 (a 1Δ, Ethreshold = 1.90 eV), 2 1 A1 (b 1Σ+, Ethreshold = 2.77 eV), 3 B2 and 1 3 B1 (A 3Π, Ethreshold = 3.92 eV), and 1 1 B1 and 1 1B2 (c 1Π, Ethreshold = 6.25 eV) states leads to bound electronic states. However, these states can predissociate via the energy crossing of the repulsive 1 5 A2 (1 5Σ−, Ethreshold = 8.21 eV) state. The determined curve intersect energies of the 1 5 Σ− state with the a 1Δ, b 1Σ+, A 3Π, and c 1Π states from the ground state minimum are 4.246, 4.79, 5.878, and 5.062 eV, respectively [79]. At high energies, excitation of the ground state 1 3 A2 (X 3Σ−) to the 2 1 A1 (3 1Π, Ethreshold = 11.42 eV), 4 3 A2 (3 3Σ−, Ethreshold = 12.38 eV), and 3 1 A1 and 3 1 A2 (2 1Σ−, Ethreshold = 13.79 eV) states also leads to bound electronic states. These states can also predissociate due to the energy crossing of the repulsive 3 3 A2 and 1 3 A1 (2 3Σ−, Ethreshold = 11.42 eV), and 2 3 A1 (1 3Σ+, Ethreshold = 12.37 eV) states. All other electronic excitations discussed here lead to strongly repulsive states and are considered to dissociate: the 1 5A2 (1 5Σ−, Ethreshold = 8.21 eV) state is considered to dissociate to N(4 S) + H(2 S) [85]; the 2 3 B2 and 2 3 B1 (B 3Π, Ethreshold = 8.59 eV), 2 1 B2 and 2 1 B1 (d 1Π, Ethreshold = 9.17 eV), and 2 3 A1 (1 3Σ+, Ethreshold = 12.37 eV) states are considered to dissociate to N(2 P) + H(2 S); and the 2 3 A2 (2 3Σ−, Ethreshold = 10.10 eV), 3 3 A2 and 1 3 A1 (2 3Σ−, Ethreshold = 11.42 eV), and 2 1 A2 (1 1Σ−, Ethreshold = 12.09 eV) states are considered to dissociate to N(2 D) + H(2 S) [85].
3.3.8. Ionization.
The NH ionization cross sections, σion, were the only NH cross sections for which experimental data was available. Having confirmed that there is no significant difference between the ionization cross sections for NH3 and ND3, Tarnovsky et al [70] determined partial ionization cross sections for NH using ND. Unfortunately, D+ ions could not be detected in their experimental set-up. As a result, the partial ionization cross sections were limited to the ND+ and N+ ionization channels of ND and the derived total ionization cross section of NH was expected to be underestimated. Our theoretical calculations relied on the BEB method of Kim and Rudd [21] to determine the total ionization cross section. Based on the total cross section, we used a hybrid method, similar to the one proposed by Graves et al [80], to determine the partial ionization cross sections. The difference in total ionization cross section between the experimental values and those calculated with QEC was considered to originate from the missing experimental D+ (H+) partial ionization cross section. As a first step, we determined the branching ratio to the different fragments. The branching ratio between NH+ and N+ was derived from the experimental data, whereas the branching ratio towards H+ was assigned to the difference between the experimental and theoretical total cross section at 70 eV. Next, the different partial ionization cross sections were calculated based on the total cross section and the branching ratio at 70 eV, using the method suggested by Hamilton et al [16]. For more details and a comparison of the hybrid method used with the methods proposed by Huber et al [81] and Hamilton et al [16] see the SI (figure S5). For an in-depth comparison of different methods to obtain the partial ionization cross sections from the total ionization cross section, see the work of Graves et al [80].
In general, the calculated partial ionization cross sections derived from the theoretical total ionization cross section using the hybrid method, show good agreement with the experimental data (figure 26). They result in a slightly higher threshold energy for the NH+ channel: 14.6 eV compared to the 13.6 ± 0.5 eV found experimentally. At energies above 35 eV, the theoretical total ionization cross section is higher than the experimental measured data, but as mentioned above, this is due to the missing H+ partial ionization cross section data in the experiment. At energies below 70 eV, the theoretical dissociative ionization cross sections of the fragment, N+ is slightly underestimated. At energies between 22 and 60 eV, and above 100 eV, the theoretical dissociative ionization cross sections of the NH+ fragment is slightly lower than the experimental values, but it shows a physically more realistic trend compared to the experimental values.
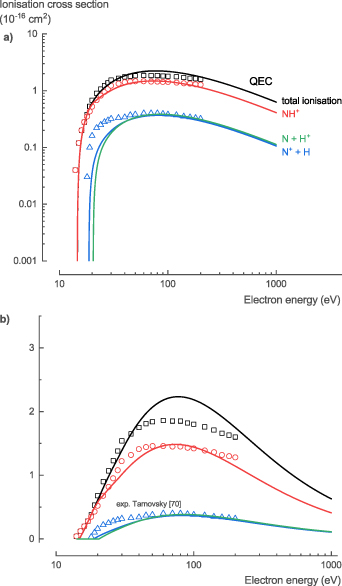
Figure 26. Total and partial ionization cross sections for NH calculated with QEC compared with experimental data from Tarnovsky et al [70]; showing good agreement.
Download figure:
Standard image High-resolution imageFor the NH ionization cross sections, σion, we recommend the theoretical data presented here, given the good agreement of our theoretical cross sections with experimental data for NH3 and with the incomplete experimental data for NH (see table S21 in the SI for the full data set).
3.3.9. DEA.
The NH DEA cross sections, σDEA, had not been studied experimentally. Our theoretical calculations relied on the DEA estimation method of Munro et al [22] to estimate the total DEA cross section. The dissociative attachment process is expected to mainly lead to N + H- with a negligible contribution of the process N- + H due to the electron affinity of H (0.754 eV), while N only temporally binds an electron.
The total DEA cross section estimated with QEC predicts three peaks, one separated at 2.6 eV and two overlapping at 6.7 and 11 eV (figure 27). As discussed for NH3 (section 3.1.8), the location of the peaks should be reasonably accurate, whereas the height of the theoretical cross section at the peaks is most probably overestimated up to one order of magnitude.
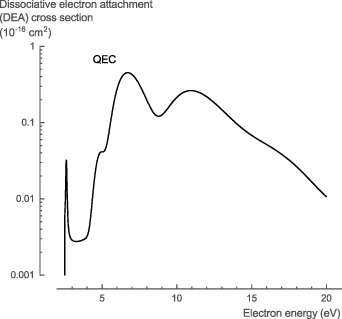
Figure 27. Total dissociative electron attachment cross sections of NH calculated with QEC.
Download figure:
Standard image High-resolution imageFor the NH DEA cross sections, σDEA, we recommend the estimated theoretical data presented here, given the lack of comprehensive experimental data and the reasonable qualitative agreement of our theoretical cross sections with experimental data for NH3 (see table S22 in the SI for the full data set).
3.3.10. Overview.
In general, the theoretical cross section data for electron collisions with NH calculated with QEC provides a comprehensive set of cross sections for the low-energy collisions: σtot, σel, σmom, σrot, σexc, an estimation for σDEA and more accurate and complete data for σion. Based on the comparison of our theoretical data with the limited data available in literature, several new recommendations are made regarding the cross sections for electron collisions with NH (figure 28, see SI for the full data set).

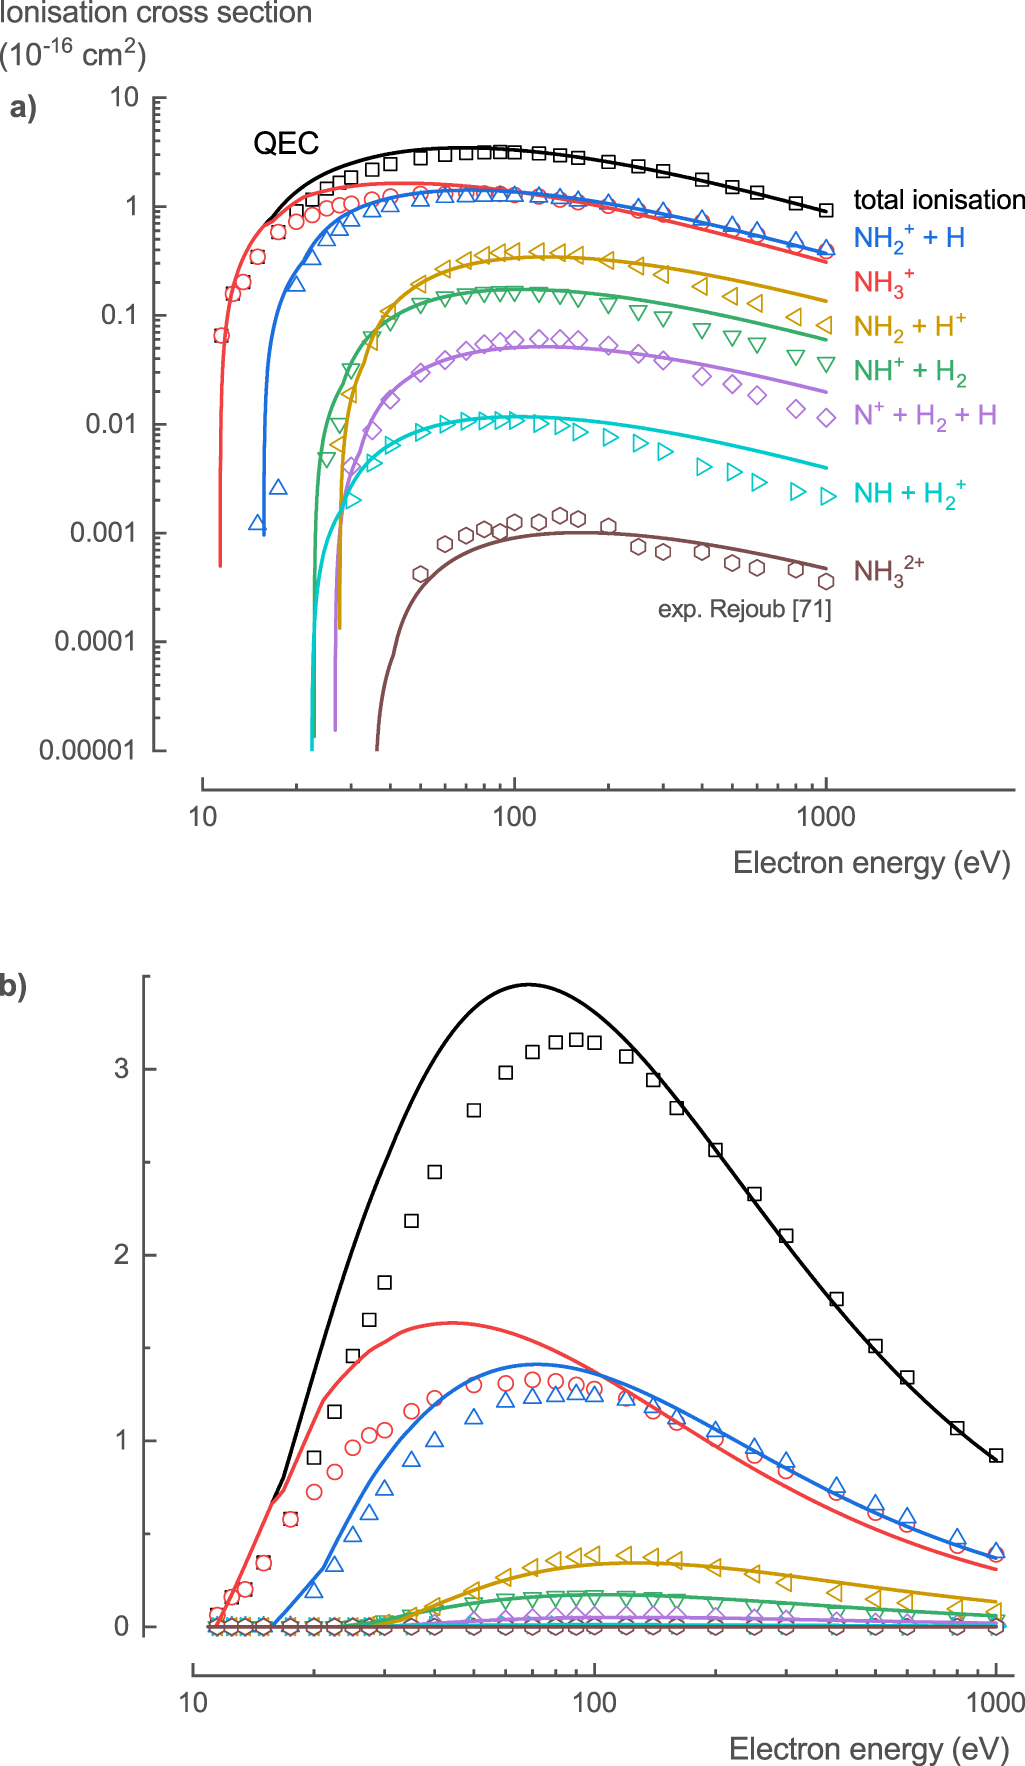
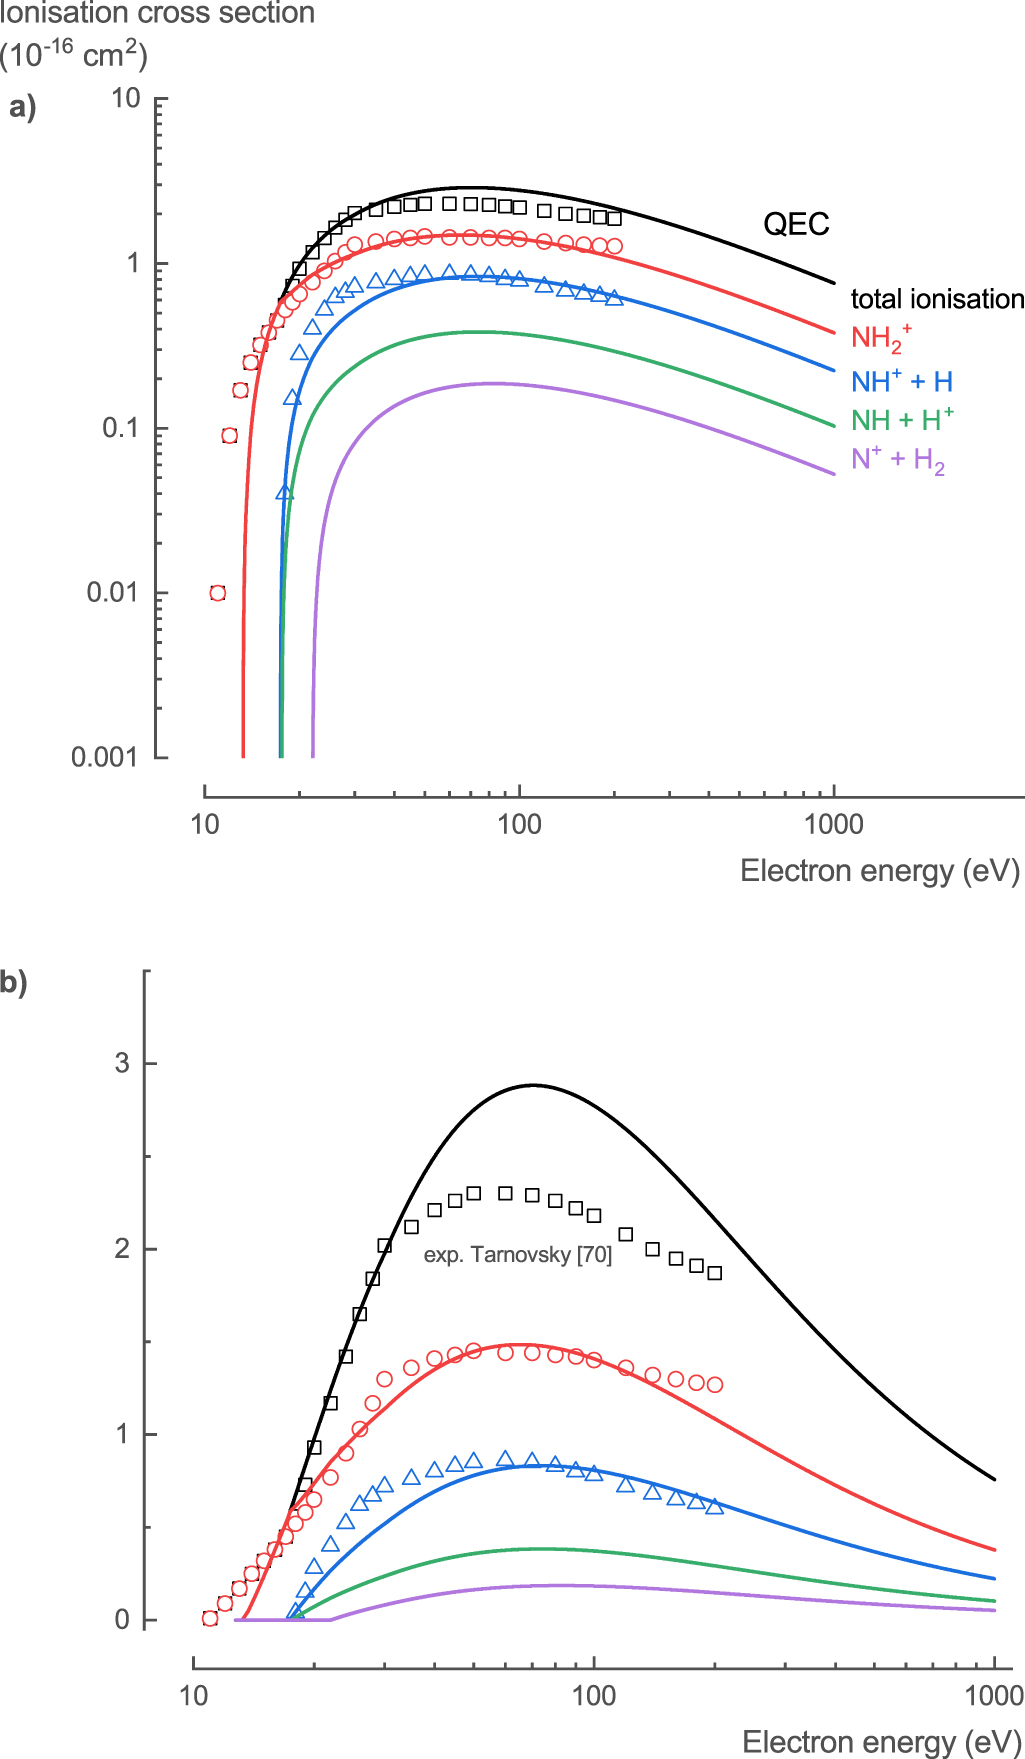
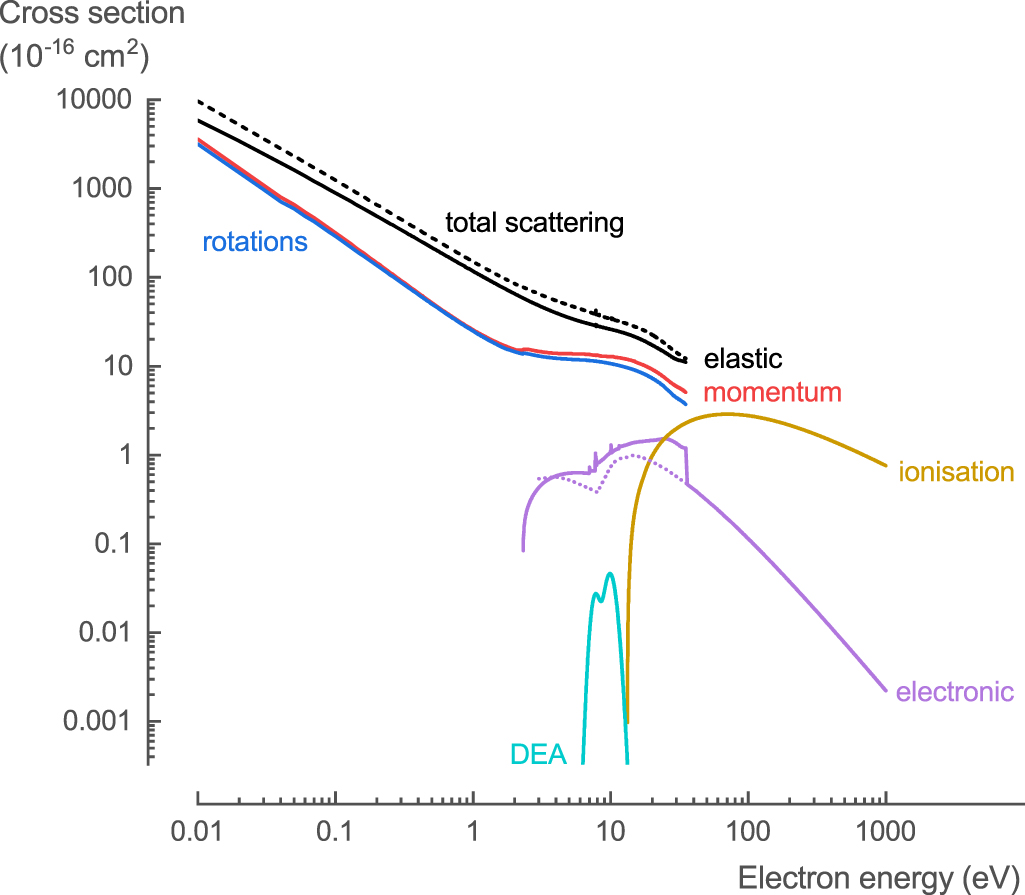
Figure 28. Overview of the recommended cross sections for the electron collisions with NH in this work.
Download figure:
Standard image High-resolution image
4. Conclusions
In this work, using QEC and MOLPRO, we successfully developed a complete set of theoretical cross sections for the low-energy electron collision processes (up to 35 eV) with NH3 and its decomposition products NH2 and NH.
For NH3, (where available) our calculated cross section data was in good agreement with experimental and theoretical data from literature. For the elastic scattering process, we showed the known experimental underprediction of the cross section data below 10–15 eV, using calculations with and without the Born approximation. For the rotational, vibrational, and electronic excitation processes, we provided more accurate data with additional excitation levels.
For NH2 and NH, no experimental data was available in literature, except for incomplete partial ionization cross sections. Based on the good agreement of our theoretical calculations for NH3 with recommended values in literature, the same calculation procedure was used to calculate the cross section data for NH2 and NH. Additionally, specific emphasis was placed on matching the dipole moment of these species with experimental values, as this has a large effect on the cross section data. The cross section data for NH2 and NH showed similar behavior as for NH3. To complement the experimental data for the electron impact ionization, we proposed a modified method to estimate the fragmentation pattern.
Based on our theoretical electron collision cross sections in combination with experimental and recommended data in literature, we constructed a complete set of recommended cross section data for electron collisions with NH3, NH2, and NH, ranging from low to high electron energies. Additionally, using PEC calculations in combination with data from literature, we suggested the contribution of the various electronic states of NH3, NH2, and NH to different neutral dissociation channels.
The presented complete set of electron collision data will contribute to a more accurate description and better insights into the plasma-chemical kinetics behind plasma-assisted ammonia reactions for (i) technological applications, such as plasma-assisted NH3 synthesis, decomposition, oxidation, and combustion; (ii) astrophysical studies of interstellar matter, where NH3 is an important component; and (iii) planetary studies of atmospheres that contain NH3.
For further improvements, future work should focus on the experimental validation of the cross sections for which only theoretical data was presented, and the validation of the neutral dissociation processes with their respective branching ratios to the different dissociation channels.
Acknowledgments
The research reported in this publication was funded by King Abdullah University of Science and Technology (KAUST), under Award Number BAS/1/1384-01-01. We are extremely grateful for the guidance of Dr Harin Ambalampitiya (Quantemol Ltd).
Data availability statement
All data that support the findings of this study are included within the article (and any supplementary files).
Conflict of interest
QEC is distributed by Quantemol Ltd; Jonathan Tennyson is a company Director.
Authors' contributions
Conceptualization, Investigation, Formal analysis, Visualization, and Writing—original draft preparation: R S; Methodology: R S, J T; Writing—review and editing: R S, J T, M S C; Resources: J T, M S C; Funding acquisition: M S C.
Funding
The research reported in this work was funded by King Abdullah University of Science and Technology (KAUST) under Award Number BAS/1/1384-01-01.
NHx full accuracy data (4.3 MB XLSX) NHx full accuracy data contains all the calculated data for NH3, NH2, and NH that is presented in the manuscript
NHx bolsigdb data fil (0.2 MB DAT) NHx bolsigdb data file contains the recommended cross section data for NH3, NH2, and NH in the format used by common Boltzman solvers (e.g. BOLSIG+, LoKI)
Supporting information (2.9 MB PDF) Supporting information contains additional information regarding the electron collision cross section data for NH3, NH2, and NH (i.e. DCS, PEC, partial ionization comparisons, and recommended cross section data listed as tables)