
Abstract
Electron impact cross sections sets are constructed for the nitrogen trifluoride, nitrogen difluoride and nitrogen monofluoride molecules. These cross sections are based on ab initio R-matrix calculations augmented by other procedures. Cross sections are presented for elastic collisions, momentum transfer, dissociative electron attachment, electron impact dissociation, ionisation and dissociative ionisation. For NF process occurring via the metastable a  and b
and b  states are also considered. A semi-empirical method of estimating the products of electron impact ionisation is proposed and tested for ammonia. The cross sections are extended to high energy where appropriate. The cross section set constructed is tested in a global model simulation of a low pressure, inductively coupled plasma based on a Ar/NF3/O2 initial gas mixture.
Export citation and abstract BibTeX RIS

Original content from this work may be used under the terms of the Creative Commons Attribution 3.0 licence. Any further distribution of this work must maintain attribution to the author(s) and the title of the work, journal citation and DOI.
1. Introduction
Many plasma-based technological processes are fueled by the introduction of a feedstock gas mixture which is then activated by electron impact dissociation and ionisation. This creates a chemically reactive mixture comprised of not only the original gases, which are usually fairly stable closed shell species, but also a variety of secondary species. These secondary species are often radicals or ions which are chemically active due to their open outer shells. Comprehensive computer models of the plasma process require extensive fundamental data [1], for example on electron collision interactions, not only with the feedstock gases but also with the chemically active species which are responsible for much of the plasma-induced reactivity that produces products.
Unfortunately it is difficult to experimentally measure electron impact collisions with open shell or radical species due to the difficulty in preparing well characterise beams of such species [2, 3]. This means that experimentally measured cross sections are overwhelmingly for processes involving closed shell species, and constructing complete reaction mechanisms for plasma chemistries is challenging. The alternative is to use theoretical methods to calculate cross sections for the appropriate processes [4].
In this investigation we consider the case of NF3 plasmas. Nitrogen trifluoride (NF3) is used in a variety of plasma processes for semiconductor fabrication, including direct etching [5, 6], reactor cleaning [7] and remote plasma sources (RPS) due to the ease with which F atoms are produced by dissociative attachment (DA). RPS sustained only in NF3 typically limits the types of reactive fluxes reaching the processing chamber to only Fx and NFx atoms and molecules. Models of such plasmas are severely limited by the absence of fundamental data on the molecules created by the electron impact dissociation of NF3, namely nitrogen difluoride (NF2) and nitrogen monofluoride (NF). Here we use the R-matrix method to compute electron impact cross sections for important processes involving NFx,  species. These data can then be used as the input for plasma chemistry models which we demonstrate by simulating a report plasma source sustained in an Ar/NF3/O2 gas mixture. The resulting dataset of NFx cross sections is available for general use.
There have been a number of experimental studies on electron collisions on NF3, which have been reviewed recently by Lisovskiy et al [8]. Of particular significance are the studies of Szmytkowski et al [9], who considered total cross sections, and Nandi et al [10], who measured dissociative electron attachment cross sections. These measurements are compared with our calculations below. Conversely, the only experimental measurements on electron collisions with NF2 and NF which are useful for comparisons involve impact ionisation [11, 12].
Similarly there are a number of theoretical studies of electron scattering from NF3 [13–15] which mainly concentrate on elastic scattering and electron impact electronic excitation. Again we are unaware of previous calculations on electron collisions with NF2 and NF apart from studies of electron impact ionisation [12, 16]. While this work was in progress Hoshino et al [17] published a joint experimental–theoretical study on electron collisions with BF3 which also makes comparisons with processes in NF3. Finally we note that Song et al have just completed a comprehensive review of all available cross sections for electron–NF3 collisions [18].
There is no single theoretical procedure for electron–molecule collisions which provides all of the cross sections needed for comprehensive plasma modelling. The next section therefore considers which processes are important in NFx plasmas and appropriate methods of calculating cross sections for them. In some instances this involves the use of available experimental data. For example, while it is relatively easy to compute electron-impact ionisation cross sections using a number of well-documented semi-empirical procedures [19–21], these procedures do not provide partial cross sections which give the branching ratios of species produced as a result of this ionisation. Here we propose using well established data obtained using mass-spectroscopy to provide estimates of the partial cross sections that arise from dissociative ionisation as a function of electron energy. This procedure is tested for NH3 and estimates of partial ionisation cross sections are given for NF3, NF2 and NF.
Sections 2 and 3 present the details of the calculations for each of three species. Section 4 gives our collisional results and compares with the limited available experimental data. Section 5 gives an illustrative example of the uses of our newly derived dataset in a plasma model. Section 6 presents our conclusions.
2. Processes and theoretical methods
2.1. Processes
To model the plasma chemistry of gas mixtures including NF3 the cross sections for the following process which occur in low to intermediate energy electron–molecule collisions were considered:
Elastic scattering:

Inelastic scattering:

Superelastic scattering (for NF only):

Electron impact dissociation:

Dissociative attachment (DA):

Metastable electron impact dissociation (for NF only):

Electron impact ionisation:

Electron impact dissociative ionisation:

The asterisk is used to denote an electronically excited state. Below we discuss the theoretical procedures used.
2.2. The ab initio R-matrix method
The R-matrix method treats electron scattering from molecules by dividing the space of the problem into two separate regions [22] comprising an inner region which contains within it the wavefunction of the molecular target, and an outer region in which only the incident, scattering electron is considered. An R-matrix calculation constructs and solves an energy-independent wave equation for the inner region whose solutions are then used to solve the much simpler, energy-dependent problem of the scattering electron in the outer region. By making the inner region of the problem energy independent and only the outer region energy dependent, we can resolve the outer region on a very fine energy grid which gives all the cross section features and structures.
All low-energy calculations reported here used the polyatomic implementation of the UK molecular R-matrix code UKRMol [23]. Most of the calculations were performed using the Quantemol-N expert system [24] which both runs UKRMol and provides the various high-energy approximations discussed below and the DA estimator [25]. A full review of the molecular R-matrix method has been given in [26].
2.3. Calculation models used
Established electron scattering theory provides a range of models for treating the interaction of the incident scattering electron with the bound molecular electrons [26]. For this work three such methods were employed for calculation and validation of results.
The simplest model used was the static exchange (SE) method. In this method the target wavefunction is frozen in its Hartree–Fock (HF) ground state and is not allowed to relax in response to the scattering electron. This method therefore can only be used to calculate cross sections for elastic processes and can only detect shape resonances where the scattering electron is temporarily trapped behind a potential barrier created by the molecule. The SE method cannot detect Feshbach resonances which involve the excitation of bound electrons.
The second model employed is the static exchange plus polarisation (SEP) method in which the target is maintained in its HF ground state but energy exchange is allowed between the scattering electron and the bound molecular electrons. In this model a single target electron can be excited into one of the unoccupied orbitals of the target, known as virtual orbitals (VOs). This mode of excitation if found to give a particularly good representation of the polarisation of the molecule by the scattering electron; SEP techniques are often used to produce a reliable representation of shape resonances.
The third and most sophisticated model used is based on considering several target states through the use of a close-coupling (CC) expansion. Here the target states are represented using a complete active space (CAS) configuration interaction (CI) model [27] in which bound electrons from the highest (valence) occupied molecular orbitals are excited to the lowest unoccupied molecular orbitals. This model can calculate cross sections for electronically inelastic processes; it also gives reliable Feshbach resonances which are the temporary anion states where the scattering electron is trapped following excitation of the target.
2.4. Ionisation and dissociative ionisation breakup
None of the models considered above can treat electron-impact ionisation. Here the method used to calculate the total ionisation cross sections is the binary encounter Bethe (BEB) method of Kim and Rudd [19]. This method uses the orbital binding energy and electron kinetic energies of the bound orbitals to calculate the ionisation cross sections. The BEB method is an amalgamation of the Mott theory [28] which describes hard, close collisions with small impact parameters and work by Bethe [29] who showed soft collisions with large input parameters essentially take place as dipole interactions between the incident and ionised electron. The BEB method therefore accounts for both collision types which take place to calculate total ionisation cross sections for fast incident electrons. The BEB total ionisation cross section,  , is given by:
where  ,
,  and
and  and where T is the kinetic energy of the incident electron, B and U are the binding energy and the average kinetic energy respectively of the electrons in a sub shell, and N is the number of bound electrons with the constants the Rydberg constant, R, and Bohr radius, a0.
The BEB method only yields total ionisation cross sections. To calculate the partial cross sections for the various ionisation and dissociative ionisation breakup cross sections involved it was assumed that the ratio of the charged fragments produced would be the same as that of the observed fragments in the mass spectrum of that molecule at the energy the mass spectrum was taken. Starting from this assumption partial cross sections are obtained by enforcing the correct thresholds for the various ionisation and dissociation processes while also ensuring the resulting cross sections are both continuous and sum to the calculated total cross section. With these constraints in place equation (9) can be rewritten in terms of  , the cross sections for formation of each fragment:
where  is the branching ratio of the fragment and
  where Df is the threshold to dissociation of fragment f.
This method was validated by calculating the dissociative ionisation cross sections of ammonia and making a comparison with published results. The mass spectrum of NH3 at 100 eV was obtained from the NIST molecular database [30] and the ratios of the intensity of the spectra for NH3+, NH2+, NH+ and N+ were thus taken to be the ratios of the ionisation and dissociative ionisation cross sections of ammonia at 100 eV. Note that isotopically-substituted fragments appearing in the mass spectra were ignored and no fragment corresponding to H+ appears in the mass spectrum. The thresholds of the cross sections were taken from the experimental ionisation energies [31].
The ionisation and dissociative ionisation cross sections for NH3 found using this method are compared to the measurements of Rao and Srivastava [32] in figure 1. Our predicted total ionisation cross section calculated using the BEB method is an average of 9% greater than the measured results between the NH3 ionisation threshold and 1000 eV, albeit the differences are greater at lower energies and largely disappear at higher energies. The theoretical dissociative ionisation cross sections of the dominant fragments, NH3+ and NH2+, show excellent agreement with the previous results. For the minor fragments, NH+ and N+, there is a greater divergence between predictions and measurement at higher energies, possibly due to the absence of the H+ fragment in the theoretical calculation due to its absence in the mass spectrum used. This comparison nonetheless suggests that our theoretical model should be capable of giving reliable predictions of dissociative ionisation cross sections, especially when a complete mass spectrum fragmentation pattern is available.

Figure 1. Comparison of calculated ionisation and dissociative ionisation cross sections (solid lines) for ammonia with previous measured cross sections (dashed lines) obtained by Rao and Srivastava [32]. The key gives fragments in decreasing order of cross section.
Download figure:
Standard image High-resolution image2.5. Electron impact dissociation breakup
Dissociation occurs when molecules are excited to electronic states which are either unbound or have curve-crossings to unbound states. The total electron impact dissociation cross section can therefore be taken to be the sum of excitation cross sections to unbound states:
However to fully understand the dynamics of a plasma, electron-impact dissociation cross sections are required to specific products and states of products. To obtain these requires branching ratios for the dissociation cross sections, which is a difficult problem in itself. In this paper several methods are used to estimate the relevant branching ratios based on the asymptotes of potential energy surfaces where available and experimental photoionisation results. In the latter case we make use of the rules of spin conservation.
2.6. Extension of cross sections to high energies
Electron impact excitation cross sections were scaled to high energies, summing over all symmetries, using the BEf procure of Kim [33]. BEf scaling is, in fact, two scalings: binary-encounter (BE) scaling and f scaling where qualitatively the BE scaling can be thought of as replacing the incident electron flux, usually defined in terms of the incident electron velocity at infinity, with an effective flux altered by the interaction of the incident electron with the target. f scaling is the empirical scaling factor for the electric dipole oscillator strengths which improves the accuracy of the target wavefunction.
The DA cross sections of the molecules were calculated up to 20 eV using Quantemol's DA estimator [25] which uses resonance parameters taken at equilibrium geometry and other appropriate data to provide estimated cross sections. Above 20 eV the DA cross sections are taken to be zero due to the lack of resonances at higher energies. This is consistent with the standard understanding of this process.
The remaining cross sections: elastic, momentum transfer and neutral dissociation were scaled to high energies by assuming these processes are dominated by dipole transitions with the effect of exchange and spin changing transitions going to zero. Dipole transitions scale as  where E is electron energy. Where the calculated cross sections showed non-physical structure at energies approaching 20 eV, this non-physical structure was assumed to be an artefact of the calculation for example due to using only single geometry, incomplete continuum orbital sets or pseudoresonances. The extrapolation to higher energies therefore smoothed over these structures in the cross sections approaching 20 eV.
3. Calculation details
3.1. Target structure
The molecular geometries of NF3, NF2 and NF used are given in table 1 and are based on data obtained from the NIST CCCBDB website [34]. At these geometries, NF3, NF2 and NF have  ,
,  and C
and C symmetry, respectively.
Table 1. Geometry of NF3, NF2 and NF in the centre-of-mass frame.
| Molecule | Atom | x (Å) | y (Å) | z (Å) |
|---|---|---|---|---|
| NF3 | N | 0.478 | 0.0 | 0.0 |
| F | −0.118 | −0.614 | 1.063 | |
| F | −0.118 | −0.614 | −1.063 | |
| F | −0.118 | 1.228 | 0.0 | |
| NF2 | N | 0.0 | 0.0 | 0.615 |
| F | 0.0 | −1.081 | −0.227 | |
| F | 0.0 | 1.081 | −0.227 | |
| NF | N | 0.0 | 0.0 | −0.758 |
| F | 0.0 | 0.0 | 0.559 | |
After tests the Dunning's augmented Gaussian type orbital (GTO) aug-cc-pVTZ basis set was selected for the NF calculations. The use of the diffuse basis set improves the calculation of the diffuse excited states of the molecule subsequently improving the accuracy of the super elastic cross sections of the molecule and neutral dissociation of the metastable states of the molecule.
The cc-pVTZ GTO basis set was selected for the NF3 and NF2 calculations. The use of augmented basis sets for these targets interfered with the construction of complete continuum basis in scattering calculations on these two molecules and so were not used. These basis sets were used in all calculations.
The ground state of NF3 is a closed shell. Iterative optimisation of NF2 gave a X 2B1 ground state with the configuration (1a12 1b22 2a12 3a12 2b22 4a12 3b22 5a12 1b12 6a12 1a22 4b22 2b11) and NF has an X  ground state with the configuration (1


 ). These configurations can be written more concisely [1-6a1, 1b1, 1-4b2, 1a2]24 [2b1]1 and [1-5σ, 1π]14 [2
 ]2 respectively. This latter notation is used below. An ab initio dipole moment of 0.352 D was calculate for NF3, 0.0536 D for NF2 and 0.102 D for NF using the CAS-CI model. The published experimental dipole value for NF3 is 0.23 D [35]. Experimental values of the NF2 and NF dipole moments could not be obtained. Comparison when using experimental and theoretical dipole moments of NF3 showed that use of the lower, measured, dipole lowered the value of the elastic cross section as shown in figure 2. This lowering is more pronounced at low energies.

Figure 2. Comparison of elastic cross section of NF3 calculated using theoretical and experimental dipole transition moments.
Download figure:
Standard image High-resolution imageA Born correction was applied to the total cross sections calculated. The cross sections of species with dipoles converge slowly with partial waves and the Born correction makes up for the omitted partial wave states with  . These corrections were calculated using the program BORNCROSS [36] which is regularly used in conjunction with the R-matrix suite. For NF3 the experimental dipole moment was used when making the Born correction; for NF and NF2 only theoretical dipole moment values are available. The cross sections presented in this work are rotationally unresolved and rotational excitation is treated as an elastic process. However, when making the Born correction to the momentum transfer cross sections, the various rotational contributions were computed using the code POLYDCS [37] and then summed over.
3.2. Elastic cross sections
Elastic cross sections were calculated using CAS-CI calculations which roughly correspond to treating the various 1s and 2s orbitals as frozen and allowing the electrons to be distributed freely amongst the various 2p orbitals. For the NF3 calculation. Orbitals [1-9a1, 1-4a2]26 were frozen and a CAS of [10-15a1, 5-8a2]8 was used. For the NF2 calculation orbitals [1-5a1, 1b1, 1-3b2]18 were frozen and a CAS [6-9a1, 2-3b1, 4-6b2, 1a2]7 was used.
For the NF calculation orbitals [1-4σ]8 were frozen and a CAS of [5-8σ, 1-3π]8 was used. The momentum transfer cross sections are calculated using the same calculation model. The elastic and momentum transfer cross sections of NF2 are compared in figure 3.

Figure 3. Comparison of NF2 elastic scattering and momentum transfer cross sections.
Download figure:
Standard image High-resolution image3.3. DA calculation
Dissociative electron attachment or DA is the electron scattering process whereby the scattering electron attaches to the molecule in a resonance state which causes the molecule to fragment. DA is very important in technological plasmas as is can be the initial step at low energies which leads to the breakup of the feedstock gases and creation of negative ions; as such DA is of paramount interest in this investigation.
A semi-empirical treatment for calculating DA cross sections was used in this investigation [25] based upon the resonances found in the electron–molecule interaction detected by the program RESON [38]. Resonance calculations were made using the SE, SEP and CC methods, the most reliable results being found with the SEP calculations, as explained in the results section.
SEP calculations, with the target described in section 3.1, were found to converge NF3 resonance parameters using 53 VOs, (12-44a1, 7-28a2). Similarly 77 VOs, (7-33a1, 3-17b1, 5-27b2, 2-13a2) converged the NF2 calculation, and 41 VOs, (6-18 σ, 3-17 π, 1-13 δ), converged the NF calculation.
In addition to the cross section for capture into the resonant state calculated from the resonance positions and widths provided by RESON, the DA cross sections depend upon survival probabilities for each resonance which is the probability of the resonance state dissociating before it autoionizes. The survival probabilities are calculated from the electron affinity of the most likely anion fragment, the vibrational frequency of the bond broken to create this fragment and the dissociation energy of this bond. In the case of DA of NF3, NF2 and NF the most likely anion fragment was taken to be F−. F has electron affinity 3.401 eV [39]. The vibrational frequencies of the N–F bonds in the three molecules and the dissociating energies of these bonds are given in table 2.
Table 2. Vibrational frequencies, ν, and dissociation energies, D0, of the N–F bonds in NF3, NF2 and NF. For NF3 and NF2 the vibrational frequencies used is for the vibrational mode with the highest infrared intensity.
| Molecule | ν (cm−1) | D0 (eV) |
|---|---|---|
| NF3 | 907.0 [40] | 2.52 [41, 42] |
| NF2 | 942.5 [43] | 3.30 [41, 42] |
| NF | 1141.37 [44] | 3.12 [41] |
3.4. Electron impact excitation and dissociation
No metastable states were detected for NF3 or NF2. The dissociation energy of the N–F in NF3 bond is 2.52 eV [41, 42] and the first excited state of this molecule found in the CAS-CI calculation described in section 3.2 is the a 3E with energy 8.61 eV. The vertical excitation energy of this first triplet state was found experimentally to be 6.58 eV [45] and calculated by theory as 8.32 eV [13].
The dissociation energy of the N–F bond in NF2 is 3.30 eV [41, 42] and the lowest excited state of this molecule found in the CAS-CI calculation is the A 2A2 state which lies at 4.34 eV. For both NF3 and NF2 the first excitation threshold lies above the dissociation threshold. We therefore assume that excitation to this and higher states will lead to dissociation, and therefore no super-elastic collisions (collisions of the second kind) or impact dissociation from a meta-stable state will occur in electron impact processes with these molecules.
Metastable states were detected, however, in NF. The dissociation energy of the N–F bond in NF is 3.12 eV [41]. From the X  ground state of NF it was found that NF has two metastable, spin-singlet states below the dissociation energy, a
  with energy 1.34 eV and b
  at 2.32 eV found in the CAS-CI calculation. These values are in good agreement with those found in previous studies. Our calculated vertical excitation energies for each molecule are shown in tables 3–5, where they are compared to values available in the literature.
Table 3. Vertical excitation energies for the lowest four excited states of NF3.
| State | This work (eV) | Expt. (eV) | Calc. (eV) |
|---|---|---|---|
| X 1A1 | 0.000 | 0.000 | 0.00 |
| a 3E | 8.615 | 6.58 [45] | 8.32 [13] |
| b 3A1 | 10.193 | ||
| A 1E | 10.881 | 11.41 [13] | |
| B 1A1 | 11.308 |
Electron impact dissociation occurs via excitation to electronically excited states of the target which then dissociate [51]. For an accurate calculation of these processes a large number of electronically excited states need to be considered. Born corrections to the electron-impact excitation cross sections were used to account for long range dipole effects [36, 52].
Using the CAS-CI calculation models described in section 3.2 and the target described in section 3.1 results were converged with a treatment of NF3 placing the eight highest electrons in 23 orbitals. These electrons were excited up to 39 excited states below 23 eV. The CAS-CI treatment of NF2 placed the seven highest electrons in 19 orbitals; inclusion of 19 excited states with an energy cut off of 15 eV converged the NF2 calculation.
The NF metastable states mean that superelastic collisions and electron impact dissociation from these states also need to be considered. The superelastic cross section is calculated as the sum of the cross sections from the metastable states to the ground state. Metastable dissociation is calculated as the sum of all excitation cross sections which start from a metastable state and excite a state above the N–F dissociation energy. This model treats the two metastables as a single entity and ignores collisions which interconverts between the two metastable states. A CAS-CI treatment of NF which placed the eight highest electrons in 11 orbitals was used for these calculations exciting the electrons up to 64 excited states with an energy cut off of 18 eV.
Total electron impact dissociation cross sections were thus obtained; from these branching ratios were estimated for dissociation to specific products and states. The recent NF potential energy curves computed by Wan et al [53] show there are two major dissociation products of NF:

and

where Y in equation (13) represents all states of NF other than A  . While previous studies [49] predicted that excited states of NF above b
  are repulsive, Wan et al [53] identified very shallow well in the excited states of NF capable of supporting bound states. Here, we approximate all states above b
  as being repulsive. The shallowness of the wells identified by Wan et al and the vanishingly small Franck–Condon factors from the ground electronic state makes this a legitimate approximation. Although the a
  and b
and b  curves are identified as crossing the A
  curve in this work we assume that predissociation of these states to produce
  fragments does not occur and that these states purely dissociate to
  . The dissociation energy producing these latter fragments is 5.50 eV taking the dissociation energy to
  to be 3.12 eV [41] and the energy difference between the atomic state products to be 2.38 eV [53].
Potential energy surfaces for excited states of NF2 are not available and therefore branching ratios were estimated by induction from photolysis experiments. Ground state NF2 is a doublet so photodissociation only gives products which couple to doublet spin symmetry. Papakondylis and Mavridis [54] show explicitly:

and

and

and Collins and Husain [55] suggest that:

Papakondylis and Mavridis [54] note that the two NF2 2A1, A2A1 and B2A1, surfaces undergo an avoided crossing adding an additional energy barrier of 0.356 eV to their dissociation energy. They also discuss a crossing between the two 2A1 states and those of C  symmetries which can lead to production of NF
  from the two 2A1 states. However, this crossing only arises from population of the antisymmetric b2 vibrational levels which, as vibrational excitation is not discussed in this work, means this process is neglected. Additionally, Papakondylis and Mavridis rationalise the delayed appearance of NF(
 ) as being due to the presence of an avoided crossing creating a barrier to the dissociation of the B
  state however this barrier is below the vertical excitation energy of the C
  state and consequently does not affect the threshold at which we calculate this dissociation occurring. Collins and Husain do not discuss the potential energy surface of the D
  state. Their suggestion that this state dissociates is assumed to be correct.
Photolysis cannot be used to show dissociation products for the quartet excited states of NF2, however selection rules dictate the products of the dissociation of the NF2 quartet states must be in a doublet state and a triplet state. Furthermore, as the fluorine atom produced by the dissociation is in a doublet state the NF product must, therefore, be in a triplet state. The most likely triplet state NF product is the ground X  state therefore:

and

Potential surfaces of the a  and b
and b  states of NF2 are not available. We assume in this work that the quartet states are parallel to their doublet state equivalents and therefore assume these states are dissociating and that any additional dissociation barrier created by an avoided crossing is beneath the vertical excitation energy of the states. Furthermore we do not take predissociation into account for these quartet states.
As with NF2, potential energy surfaces of NF3 were not readily available and therefore, as for NF2, results were inducted from photolysis results. NF3 having a singlet ground state, photodissociation takes place on singlet excited states. The peak positions and thresholds in table 3 of Seccombe et al [56] compared with their NF2 excited state energies given in their table 1 and cross referenced with the vertical excitation energies calculated in this paper and given in table 4, suggest the following impact breakups occur:

and

and

and

where it is assumed the dissociation to NF will also produce F2, as opposed to 2F, as this product has a lower threshold and also because of the better match of this threshold to the threshold given in table 3 of Seccombe et al [56]. Photodissociation does not occur via NF3 triplet states; however, we assume that the symmetry of the transitions will remain the same and therefore only spin transitions need to be taken into consideration. Spin-changing transitions are allowed for electron impact and triplet NF3 excited states will dissociate to both doublet and quartet states of NF2. Spin statistics suggest that quartet states will occur with twice the probability of the doublet states; while for triplet and singlet states of NF, triplet state products will have triple the probability of singlet state products. Branching ratios are thus obtained from these transition rules and probabilities and are associated with the following dissociations:


Table 4. Vertical excitation energies for the seven lowest excited states of NF2 compared with calculated values by Cai et al [46]. Cai et al's calculations were based on an alternative ground state configuration as explained in section 3.1.
| State | This work (eV) | Previous (eV) |
|---|---|---|
| X 2B1 | 0.000 | 0.000 |
| A 2A1 | 5.203 | 4.470 |
| B 2A1 | 7.251 | 5.284 |
| C 2B2 | 7.422 | 5.560 |
| D 2B2 | 8.519 | |
| E 2A2 | 8.905 | 7.825 |
| a 4A2 | 9.061 | |
| b 4B1 | 9.755 |
The nature of the NF3 states is not discussed by Seccombe et al [56]. Their singlet states are implicitly identified as being dissociating states which we take to be the case. Predissociation was not taken into account. We assume in this work that the triplet states of NF3 are parallel to their singlet equivalents and therefore are also dissociating states.
For total neutral dissociation cross sections of NF, NF2 and NF3 we expect the possible overestimate of these cross sections resulting from assumptions about the dissociative nature of the excited states to be ameliorated by the fact that in reality the number of these excited states is under-estimated in our calculations.
3.5. Ionisation
Koopman theorem's calculations give a simple, ab initio ionisation energy for molecules. For NF3, NF2 and NF the Koopman ionisation energies are 15.09 eV, 10.33 eV and 17.10 eV respectively, based on the target described in section 3.1. The experimental ionisation energy of NF3, NF2 and NF are given as 12.94 eV, 11.63 eV and 12.10 eV respectively [31]. Due to the large difference between the theoretical and experimental values, the experimental ionisation energies were used when calculating ionisation cross sections.
The mass spectrum of NF3 at 100 eV was obtained from the NIST Mass Spectrometry Data Center [30]. This spectrum gives a fragmentation pattern for the full range of NF3 fragments and therefore using it will not have the problem with missing fragments found in our model of NH3 breakup. However, mass spectra are not available for NF2 or NF and so the branching rations of the ionisation and dissociative ionisation breakups were estimated by truncating the fragmentation pattern obtained in the NF3 mass spectrum.
4. Results
Our final cross section set is provided as supplementary data to this article, available online at stacks.iop.org/PSST/26/065010/mmedia. A selection of calculated cross sections for NF3 and NF2 are presented in figures 4 and 5.

Figure 4. Overview of NF3 cross sections at low electron collision energies.
Download figure:
Standard image High-resolution image
Figure 5. Overview of NF2 cross sections at low electron collision energies.
Download figure:
Standard image High-resolution imageTwo metastable states were detected in NF: a  at 1.335 eV; and b
  at 2.323 eV. Therefore metastable dissociation of NF, creating N and F fragments, and superelastic scattering, or excitation, of NF excited to a metastable state will occur in the plasma. These cross sections are given in figure 7. Figure 6 shows the other electron–NF scattering cross sections.
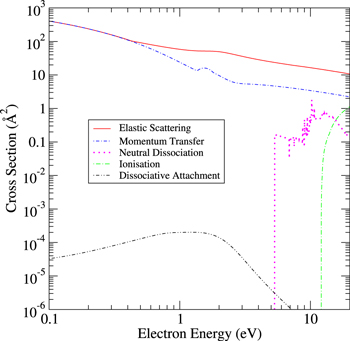
Figure 6. Overview of NF cross sections at low electron collision energies.
Download figure:
Standard image High-resolution imageFigure 6 shows sharp structure in the NF neutral dissociation cross section unlike the neutral dissociation cross sections of NF2 and NF3. NF is an open shell molecule with only two electrons occupying its highest π orbital. We note that our calculation considers more NF excited states below its ionisation threshold than the calculations on either NF2 or NF3. NF has 19 states below the ionisation, given in table 5, compared to seven and ten for NF2 of NF3 respectively. As a result, more structure is seen in the open shell NF neutral dissociation cross section than in the also open shell NF2 neutral dissociation cross section. The sharp structure seen in the NF dissociation cross sections correspond to Feshbach resonances with triplet parent states manifested by sharp structure around the opening of channels to the B  and C
and C  states with thresholds just below 8 eV and to the opening of channels to the D
  and E
and E  states at around 10 eV, given in table 5.
Table 5. Vertical excitation energies excited states of NF up to ionisation energy. Experimental values are for adiabatic excitation (Te) and are taken from Huber and Herzberg [47]. Calculated values are from a full configuration interaction calculation.
| State | This work (eV) | Expt. (eV) | Calc. (eV) |
|---|---|---|---|
X 
|
0.000 | 0.000 | 0.000 |
a 
|
1.335 | 1.488 [48] | 1.33 [49] |
b 
|
2.323 | 2.341 [50] | 2.35 [49] |
A 
|
6.256 | 7.14 [49] | |
c 
|
7.771 | 8.83 [49] | |
B 
|
7.885 | ||
C 
|
7.997 | ||
d 
|
9.300 | ||
D 
|
9.665 | ||
E 
|
10.125 | ||
e 
|
10.201 | ||
f 
|
10.323 | ||
F 
|
10.764 | ||
g 
|
10.889 | ||
h 
|
10.960 | ||
i 
|
11.262 | ||
G 
|
11.332 | ||
H 
|
11.417 | ||
I 
|
11.627 | ||
j 
|
12.019 |
Figure 7 shows the cross sections for the processes resulting from electron scattering from metastable NF. The metastable dissociation cross sections show the same structure as that apparent in the ground states NF dissociation cross sections.

Figure 7. Overview of NF metastable state cross sections at low electron collision energies.
Download figure:
Standard image High-resolution imageA comparison of NF3 total cross sections produced by our CAS-CI described and SEP models with the total cross section measurements of Szmytkowski et al [9] is given in figure 8. Our results have a different shape at very low energy compared to the measured cross sections. This is almost certainly due to the neglect of the strong forward scattering in the measurements which is a well-known feature of low-energy electron collisions with dipolar systems [57, 58]; indeed this point was raised by Szmytkowski et al [9]. The difficulty in measuring the low-angle scattering contribution to the cross sections means that comparison with differential cross sections over the angles that they can be measured provides a more appropriate means of comparison. Differential cross sections measured by Boesten et al [59] are compared to cross sections calculated in this work using the SEP model, see figure 9. Our calculated differential cross sections compare well to Boesten et al's measured data at all energies except around 2 eV where the shape resonances identified in our calculation, given in table 6, causes an increase in our differential cross section. These resonances were not registered by the Boesten et al however we have reason to believe they are correctly placed as discussed in section 4.1.

Figure 8. Comparison of calculated CAS-CI total cross sections with NF3 total cross section measurements of Szmytkowski et al [9].  .
.
Download figure:
Standard image High-resolution image
Figure 9. Comparison of NF3 differential cross sections calculated in this work using the SEP model with measured differential cross sections by Boesten et al [59].
Download figure:
Standard image High-resolution imageTable 6. Resonances found in NF3.
| State | SEP | CC | ||
|---|---|---|---|---|
| Position (eV) | Width (eV) | Position (eV) | Width (eV) | |
| 2A1 | 1.855 | 0.288 | 5.400 | 0.976 |
| 2A2 | 1.914 | 0.414 | 5.220 | 1.253 |
4.1. DA cross sections
DA cross sections were initially calculated using the SE and CAS-CI calculation models however the cross sections for NF3 produced by these methods compared very poorly with experimental results of Nandi et al [10]. The SEP method is well-known to be most reliable for characterising low-lying shape resonances, upon which these DA cross sections rely. The model gave much more satisfactory results for DA in NF3. It was therefore assumed that the SEP model would also be most reliable for NF2 and NF, for which no experimental results are available for comparison.
The SEP calculations were converged by increasing the number of VOs and using the eigenphases as a diagnostic [60]. Increasing the number of VOs in the calculation had the effect of lowering the energy of the resonances. A SEP calculation involving 49 VOs converged the resonance parameters from which the NF3 DA cross section was calculated. The results of this calculation compare well with the experimental results of Nandi et al [10] as shown in figure 10. The shape resonances detected in NF3 by this SEP calculation are presented in table 6. The positions and widths of these resonances detected in the CC calculation described in section 3.2 are also given in this table. It is clear that the CC model places these resonances at much too high an energy which can be attributed to difficulties with converging polarisation effects in the CC procedure [61].

Figure 10. Comparison of NF3, NF2 and NF dissociative attachment cross section produced using an R-matrix SEP calculation with 49, 74 and 59 virtual orbitals respectively. Also given are the measured NF3 dissociative attachment cross sections of Nandi et al [10].
Download figure:
Standard image High-resolution imageFor the NF3 SEP calculation convergence was obtained when all VOs lying below an energy cut-off of 125 eV were retained. Based on these findings, the same energy cut-off was used in the NF and NF2 SEP calculations leading to the inclusion of 74 virtual states in the NF2 calculation and 54 virtual states in the NF calculation. The resonances detected by these calculations are shown in tables 7 and 8 for NF2 and NF, respectively. Also shown are the positions and widths of these resonances calculated in the CC calculations described in section 3.2. The DA cross sections of NF2 and NF based on the SEP resonances are shown in figure 10.
Table 7. Resonances found in NF2.
| State | SEP | CC | ||
|---|---|---|---|---|
| Position (eV) | Width (eV) | Position (eV) | Width (eV) | |
| 3B1 | 1.365 | 0.524 | 4.977 | 1.807 |
| 3A2 | 2.001 | 0.945 | 5.374 | 1.961 |
| 1A2 | 3.268 | 1.473 | 6.976 | 2.371 |
| 1B1 | 3.563 | 1.122 | 7.350 | 1.250 |
Table 8. Resonances found in NF.
| State | SEP | CC | ||
|---|---|---|---|---|
| Position (eV) | Width (eV) | Position (eV) | Width (eV) | |

|
1.697 | 1.579 | 2.389 | 0.234 |
4.2. Ionisation and dissociative ionisation cross sections
Total ionisation cross sections for NF3, NF2 and NF were calculated up to 5000 eV and the mass spectrum of NF3 was used to define the branching ratios of the fragments. This method gave continuous cross sections for each fragment with the correct thresholds although the differentials of the cross sections are not necessarily continuous. The cross sections for the total ionisation, ionisation and dissociative ionisation cross sections are shown in figures 11–13.

Figure 11. NF3 electron impact ionisation and dissociative ionisation labelled by the ion produced: comparison of this work with the measurements of Rahman et al [62] and Tarnovsky et al [11].
Download figure:
Standard image High-resolution image
Figure 12. NF2 ionisation and dissociative ionisation cross sections.
Download figure:
Standard image High-resolution image
Figure 13. NF ionisation and dissociative ionisation cross sections.
Download figure:
Standard image High-resolution imageElectron impact ionisation of NF3 has actually been fairly well studied [11, 12, 16, 62, 63]. Our results give total cross sections somewhat larger than the earlier measurements of Tarnovsky et al [11] but are closer to the more recent experimental and theoretical study of Rahman et al [62]. Rahman et al's results were recommended by the recent review by Song et al [18] on a number of grounds, not least by comparison with the reliability of measurements using the same experiments for other systems such as CF4.
The partial cross sections or branching ratios following electron impact ionisation are also not in complete agreement. Tables 9 and 10 show respectively relative intensities of ion yields in mass spectra and relative cross sections published by Tarnovsky et al [11] and Rahman et al [62]. The cross section values used in the ratios presented on table 10 are the values at the energies of the mass spectra on table 9. It can be seen that different measurements of relative ion yields are not in complete agreement. Furthermore there are other problems: for example Rahman et al [62] measure significant N+ at energies below its formation threshold. Our branching ratios are based on mass spectroscopy results as discussed above. Comparison of relative ion intensities to relevant cross section ratios give confidence in this method. The ordering of fragments by relative intensity published by Tarnovsky et al [11] and Rahman et al [62] is the same as their ordering of cross section magnitudes. Furthermore the ratios are comparable when uncertainties, as mentioned above, are taken into account.
Table 9. Relative mass spectrum ion intensities. Those from the NIST database [30] and measured by Rahman et al [62] are at 100 eV. Intensities measured by Tarnovsky et al [11] are taken at 70 eV. Results calibrated such that the largest intensity, in all cases NF2+, has arbitrary intensity '100'.
| NF3+ | NF2+ | NF+ | N+ | F+ | |
|---|---|---|---|---|---|
| 32.8 | 100 | 38.0 | 6.1 | 8.1 | [30] |
| 33.8 | 100 | 47.3 | 3.2 | 8.9 | [11] |
| 24.9 | 100 | 38.9 | 5.0 | 3.1 | [62] |
Table 10. Relative magnitudes of cross sections. Cross sections compared for this work are for electron energy 100 eV to compare to table 9. Similarly the cross sections measured by Rahman et al [62] are for electron energy 100 eV and those from Tarnovsky et al [11] are for 70 eV. For ease of comparison to table 9 all three rows are calibrated so that the values for NF2 are an arbitrary '100'.
| NF3+ | NF2+ | NF+ | N+ | F+ | |
|---|---|---|---|---|---|
| 32.8 | 100 | 38.0 | 6.1 | 8.1 | This work |
| 33.2 | 100 | 66.7 | 28.6 | 9.5 | [11] |
| 21.9 | 100 | 50.6 | 22.5 | 15.0 | [62] |
4.3. Electron impact dissociation cross sections
Figures 14–16 give our predicted electron impact dissociation results obtained by summing the electron impact electronic excitation cross sections for all states not identified as being metastable for energies above the dissociation threshold. Fragmentation patterns were obtained on the basis of measured photodissociation data as described above.

Figure 14. NF3 electron impact dissociation cross sections.
Download figure:
Standard image High-resolution image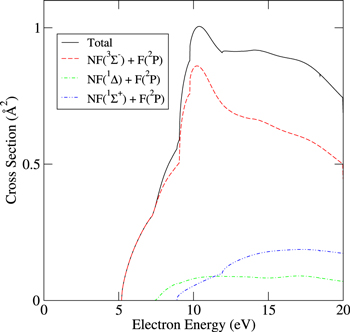
Figure 15. NF2 electron impact dissociation cross sections.
Download figure:
Standard image High-resolution image
Figure 16. NF electron impact dissociation cross sections.
Download figure:
Standard image High-resolution image5. Implementation of NFx cross sections in a global model for inductively coupled plasma (ICP)
One of the more important technological applications of NF3 containing plasmas is for semiconductor processing for etching of wafers or cleaning of chambers between other process steps. As a demonstration of the utility of the ab initio electron impact cross sections described above, the cross sections were used in a global model to simulate a low pressure, inductively coupled plasma (ICP). This class of plasma reactor is commonly used for plasma etching. The global model, Global_Kin, is a 0-dimensional simulation for plasma chemistry, plasma kinetics and surface chemistry, described in detail in [64]. Briefly, the global model consists of a set of differential equations for the densities of gas phase species. These rate equations for densities are simultaneously integrated with conservation equations for average electron energy and gas temperature. With electron impact cross sections as input and mole fractions of gas species computed in the model, Boltzmann's equation is solved to provide electron energy distributions from which rate coefficients for electron impact processes are obtained. These rate coefficients as a function of average electron energy are contained in a lookup table which is interpolated based on the instantaneous value of electron temperature. The table is periodically updated during execution of the model as mole fractions of species change.
Here the base case is taken to be an ICP sustained in an Ar/NF3/O2 = 60/30/10 gas mixture. This gas mixture is typical of those used for etching of silicon compounds. The species considered in the model are Ar, Ar(1s1), Ar(1s2), Ar(1s3), Ar(1s4), Ar(4p), Ar(4d), Ar2( ), Ar+, Ar2+, NF3, NF2, NF, NF3+, NF2+, NF+, N2, N
 , N2(A
  ), N2(B
  , higher), N, N(2D),
  , N+, F2, F2(1
  ), F, F(3S), F2+, F+, F−, O2,
  , O2(a
  ), O2(b
  ), O, O(1D), O(1S), O3,
  , O+, O2−, O−,
  , FO, FNO, NO, N2O, NO2, NO+, N2O+ and electrons. The vibrational states
  ,
,  and NF(v) were not explicitly followed in the model, however, electron energy losses for collisions with their grounds states corresponding to vibrational excitation were included. These processes only serve to consume electron energy and the vibrationally excited states are assumed to instantaneously return to the ground state. The same process was followed for NF(a
  ) and NF(b
  ). The processes in the model include 269 electron impact reactions, 236 ion–neutral or ion–ion reactions and 316 neutral and radiative reactions.
The base case operating conditions are a pressure of 100 mTorr and power deposition of 500 W in a reactor having a volume of 3140 cm3 (diameter of 20 cm and a height of 10 cm). These are typical reactor dimensions for etching a 150 mm wafer. Densities of charged and neutral particles, electron temperature Te and gas temperature Tg as a function of time are shown in figure 17. From initiation to the steady state, the electron density increases from  cm−3, to a maximum of
  cm−3, while the electron temperature decreases from 4.4 to 4.0 eV.
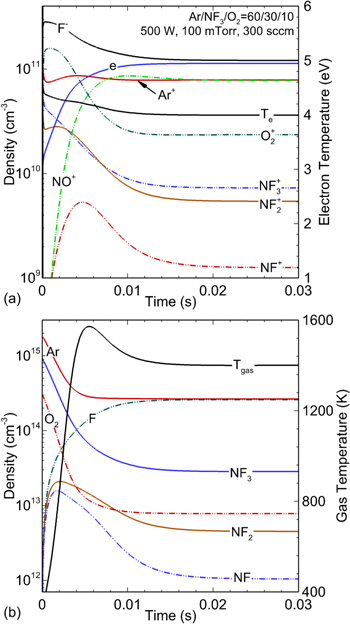
Figure 17. Time variation of (a) densities of charged particles and electron temperature and (b) densities of neutrals and gas temperature in an ICP etch reactor. The operating conditions are Ar/NF3/O2 = 60/30/10, 100 mTorr, 300 sccm, ICP power: 500 W.
Download figure:
Standard image High-resolution imageThe increase in the electron density is due to the decrease in the mole fraction of molecular species from electron impact dissociation and heavy particle reactions, discussed below, and increase in the mole fraction of atomic species as NF3 and O2 dissociate. As atomic species have a lower rate of specific power dissipation by electron collisions than molecular species, the electron density increases to maintain the desired power deposition. The gas mixture also becomes less attaching as the mole fraction of molecules decreases, so the electron temperature decreases to maintain the needed equilibrium between electron sources by ionisation and losses, which are dominated by attachment.
The dominant positive ions are Ar+ and NO+. With the formation of NO, discussed below, NO+ increases to a density of  cm−3. With the ionisation potential of NO (9.3 eV) being lower than Ar (16 eV) and with charge exchange to NO from all positive ions being exothermic, the densities of Ar+ with NO+ are commensurate in spite of the low mole fraction of NO. Due to the final low mole fraction (
 %) of the parent molecules and their moderate ionisation potentials (12.94 eV for NF3, 11.63 eV for NF2 and 12.10 eV for NF), the densities of NF3+, NF2+ and NF+ are an order of magnitude lower than for Ar+ and NO+. The dominant negative ion is F−, formed through DA of NFx (
 ) by thermal electrons. The density of F− in the steady state is
  cm−3 and the electronegativity ([F−]/[e]) is 1.1. The charge neutrality is maintained by [e] + [F−] ≈ [Ar+] + [NO+] + [O2+].
NF3 and O2 rapidly dissociate dominantly by dissociative electron attachment, e + NF NF2 + F− and e + O
 O + O−, and dissociative excitation, e + NF
 NF2 + F + e, e + NF
 NF + F2 + e and e +
  O + O + e. The dominant neutral radical is F with a density of
  cm−3. The gas temperature increases from room temperature to 1400 K due to the Franck–Condon heating that occurs through DA and excitation. NF3 is also decomposed through exothermic heavy particle collisions,


The negative change in enthalpy,  , indicates an exothermic reaction with the majority of the excess energy being dissipated as gas heating. Electron impact dissociation of NF3 and these exothermic reactions lead to a fractional dissociation of 78% for NF3 in the steady state. Being the dissociation products of NF3, the densities of NF2 and NF increase to
  cm−3 within 1.5 ms after the initiation of the plasma. After 1.5 ms, the densities of NF2 and NF decrease to
  cm−3 and
  cm−3 due to their own dissociation by electron impact (dominantly attachment) and by gas heating that rarefies the gas. NF2 is also consumed through endothermic reactions that are enabled by the increasing gas temperature,


NF is consumed through the exothermic reaction

which, despite having an activation energy of 1250 K, proceeds quickly due to the high gas temperature.
The densities of neutrals in the steady state and the gas temperature are shown in figure 18 as a function of ICP power from 200 to 1000 W. Over this range of power, the gas temperature increases from 1030 to 1580 K dominantly due to Franck–Condon heating. The fractional dissociation of NF3 increases from 60% to 89% while the density of F saturates at  cm−3 due to rarefaction with the increasing gas temperature. Similarly, the densities of Ar, NF2, NF, NF2 and F2 all decrease due to this rarefaction. The density of FNO decreases from 2.7 to
  cm−3 and the density of NO decreases from 2.6 to
  cm−3 with increasing ICP power due to the decreasing densities of NF2, NF2 and O2 which are the precursors for their generation The formation of FNO is mainly through reactions with NF2,


and the formation of NO is mainly through reaction with N2 and O2 species,


Figure 18. Densities of neutrals and gas temperature in the steady state in the ICP etch reactor as a function of power. The discharge conditions are Ar/NF3/O2 = 60/30/10, 100 mTorr, 300 sccm.
Download figure:
Standard image High-resolution image
Despite the rarefaction, the density of O increases from 1.6 to  cm−3 and the density of N increases from 0.6 to
  cm−3 due to increasing rates of dissociation of N2 and O2 as the electron density increases from
  to
to  cm−3.
cm−3.
A self-consistent set of electron impact cross sections for NFx is not presently available from experimental measurements. Based on the electron impact cross sections for NFx enabled by the ab initio methods described here, a reaction mechanism for plasmas sustained in an Ar/NF3/O2 mixtures as used in etching of silicon nitride was developed. This reaction mechanism was employed in a global model to investigate the reaction pathways and the scaling of plasma parameters (e.g., plasma density, radical density and fractional dissociation) with power deposition. For powers and pressures typical of downstream etching system, the feedstock NF3 is found to be largely dissociated, due to electron impact DA, dissociative excitation and exothermic heavy particle collisions, leaving NF2 and NF as the major NFx species. Despite the large fractional dissociation, the our models suggest that the densities of NF2 and NF may actually decrease with increasing power due to gas heating and rarefaction caused by Franck–Condon heating.
6. Conclusions
The properties of low-energy plasmas are strongly influenced by the chemical processes of the species present in the plasma. Therefore models of plasma processes require complete chemistry sets as inputs. These chemistries involve not only processes between the original feedstock gases, but also many processes involving fragments of these species and products produced by reactions between them. Chemistry sets thus often involve many reactions covering both the results of both electron collision processes and heavy particle collisions. Rates and/or cross sections for many of the significant processes are not easily amenable to experimental investigation. Theory is therefore playing an increasing role in providing the necessary data.
In this work we construct cross section sets for electron collisions with NF3, NF2 and NF. While there are experimental measurements of cross sections for electron collisions with NF3, with the exception of electron impact ionisation processes there are no previous measurements, or indeed theory, for processes involving NF2 and NF. Our core methodology is the ab initio R-matrix method but this augmented and extended to high energy using a variety of procedures. In particular, we propose a new method of estimating fragmentation patterns of the ions formed by electron impact ionisation.
Our cross sections are used to model use of an Ar/NF3/O2 gas mixture in an ICP. NF3 is usually heavily dissociated through electron impact DA and dissociative excitation so as to produce F radicals for the etching of Si-containing materials, leaving NF2 and NF as the major NFx species. Thus, the fractional dissociation, densities of ions and radicals, and electronegativity found in this model depend strongly on the cross section set of electron impact NFx reactions used. Work using these cross sections in a hybrid plasma equipment model in which the geometry of the plasma reactor is also considered will be reported elsewhere [65].
The importance of atomic and molecular data in plasma modelling in becoming increasingly recognised. Access to these data is important and we note the recent LXCat initiative [66] which contains extensive sets of electron collision cross sections for important plasma species. Tennyson et al have just launched Quantemol DataBase [67] which contains cross sections and rates for both electron and heavy particle collisions which allows the constructions of full chemistries for important plasma mixtures.
Acknowledgments
JRH thanks STFC for provision of PhD studentship which is also sponsored by Quantemol Ltd.