

Abstract
Non-equilibrium vibrational distributions (vdf) and non-equilibrium electron energy distribution functions (eedf) in a nitrogen plasma at low pressure (mtorr) have been calculated by using a time-dependent plasma physics model coupled to the Boltzmann equation and heavy particle kinetics. Different case studies have been selected showing the non-equilibrium character of both vdf and eedf under discharge and post-discharge conditions in the presence of large concentrations of electrons. Particular attention is devoted to the electron-molecule resonant vibrational excitation cross sections acting in the whole vibrational ladder. The results in the post-discharge conditions show the interplay of superelastic vibrational and electronic collisions in forming structures in the eedf. The link between the present results in the mtorr afterglow regime with the existing eedf in the torr and atmospheric regimes is discussed.
Export citation and abstract BibTeX RIS
1. Introduction
A lot of work is being devoted to the investigation of low-pressure plasmas (mtorr regime) because of their wide use in different applications including materials science and fusion. ICP (inductively coupled plasmas), ECR (electron cyclotron resonance), helicon, multipole magnetic plasmas (mmp), RF inductive and capacitive plasmas are the most studied systems in this field. The common focus is the possibility of reaching high degrees of ionization due to the magnetic confinement of electrons mitigating their loss on the walls. Mmp operating in H2/D2 plasmas are being studied both theoretically and experimentally due to their importance for the production of negative ions to be used, after acceleration and neutralization, as additional heating in tokamak devices [1–4]. ICP, ECR and helicon plasmas are much more complicated systems from the point of view of theoretical approaches so that their characterization favors the experimental point of view. A number of papers [5–14] are appearing in the literature discussing the shape of the electron energy distribution function as well as the experimental determination of the vibrational temperature in molecular plasmas, in particular nitrogen and argon-nitrogen mixtures. In general the high degrees of ionization existing in these kinds of plasmas seem to indicate a Maxwell distribution function for eedf and a corresponding Boltzmann vibrational distribution (vdf) of molecules. The experimental determination of vdf in general refers to the vibrational distribution of electronically excited states thus implying that the vdf of ground state reflects, to some extent, the corresponding experimental distribution of excited states. To our knowledge no attempts to theoretically determine the vdf and eedf and related quantities in nitrogen plasmas exist under discharge and post discharges operating in the mtorr regime, contrarily to the torr regimes, where an enormous amount of literature exists, using the self-consistent approach.
The first studies in nitrogen started with the solution of a vibrational master equation including e–V (resonant electron–vibration energy exchange processes), V–V (vibration–vibration), V–T (vibration–translation) and dissociation processes [1, 15–19], the last induced by electron impact processes as well as heavy particle collisions. Advanced plasma kinetic models have then been developed by different groups [20–30], considering, in some cases, the coupling of excited state kinetics with the Boltzmann equation. In general these models are being used to characterize plasmas and afterglows in the torr regime. The main characteristic of these studies is the observation of a long plateaux created by the V–V up pumping mechanism. This plateau for nitrogen is essentially derived by the models and indirectly confirmed by the corresponding plateaux experimentally observed in CO plasmas [31, 32].
The aim of this paper is to extend these studies to the mtorr regime where the V–V up pumping mechanism loses its importance while the corresponding e–V processes should increase their role because of the high degrees of ionization existing in these conditions. In this regime the e–V processes from v = 0 and  [33–35] play a decisive role in forming the Boltzmann vdf thus requiring a complete ladder climbing model based on forward and backward e–V transitions along the whole vibrational ladder of nitrogen molecules [23]. In addition especially at low electron temperatures the resonant dissociation process i.e.

could play an important role both in the formation of vdf and in the dissociation process [24]. A ladder climbing model based only on e–V processes as well on electron molecule resonant dissociation completely neglects the deactivation of vibrational levels by V–T processes from both molecules and atoms as well as the dissociation processes involving electron–molecule direct dissociation. Moreover the requirement of a Maxwell distribution function for free electrons requires an accurate estimation of the times necessary to the e–V processes to form a Boltzmann distribution over the whole vibrational ladder as well as the degree of ionization necessary for electron–electron collisions to maxwellize eedf. These requirements can be obtained to a first approximation to run in the mtorr regime the self-consistent model developed in our laboratory for moderate and high-pressure situations [23, 27]. The aim of this paper is therefore to apply the previous ideas for obtaining some indications useful to better rationalize the numerous experimental measurements as well as to program experiments following the present results. In addition a judicious comparison of the present mtorr results with the corresponding ones of [17, 20, 22] can be used to practically utilize the results existing in the literature for the torr regime to rationalize those obtained in the mtorr one and vice versa. It is important to underline that our approach can be improved by developing appropriate solvers for the eedf, which take into account non-local effects in its formation [36–40]. The paper is divided into five sections. After the introduction, section 2 presents a short description of the theoretical model, in section 3 the results obtained with the self-consistent model for different plasma and post-discharge conditions are discussed. Section 4 reports a comparison of the present results opportunely time scaled with the corresponding results of [17, 20, 22]. Conclusions are reported in section 5.
2. Plasma kinetic model
The plasma kinetic model used in this study has been described in recent papers published by this group [1, 25–27]. The kinetic code is based on the self-consistent solution of the Boltzmann equation for the electron energy distribution function and plasma kinetics, including
- Non-equilibrium vibrational kinetics for the vibrational ladder of nitrogen molecules coupled with a dissociation recombination kinetics
- Dissociation kinetics that considers both electron–impact dissociation (direct and resonant channels) processes, as well as dissociation processes involving molecules and atoms colliding with vibrationally excited states
- Kinetics for the ionization recombination of electrons
- Kinetics of the most important molecular states of nitrogen in particular the triplet
 and states.


In turn the Boltzmann equation is coupled with the different kinetics either through superelastic collisions between cold electrons and vibrationally and electronically excited states of nitrogen or through the change in the composition of nitrogen, which can pass from a molecular situation to an atomic one. The model solves the different time-dependent kinetics coupled to the Boltzmann equation. Moreover the Boltzmann equation is solved in the presence of a reduced electric field E/N, which is such to heat electrons helped in this action by second kind collisions. Electron–electron collisions are also considered in the Boltzmann code, their role being well-assessed in the thermalization of the eedf.
3. Results
The time-dependent results we show refer to conditions with the prevalence of molecular species in the first part of the evolution and with the prevalence of atomic species at longer times. These case studies should cover to some extent the experimental conditions discussed in the literature, considering a reduced electric field E/N roughly reproducing the average electron energy found in the experiments. Low-pressure plasmas in the mtorr regime are examined, a condition limiting the importance of V–V energy transfer processes in redistributing the vibrational quanta introduced by e–V processes over the whole vibrational ladder of nitrogen molecules. In the selected case studies we discuss the behavior of the relevant distributions at different instantaneous ionization degrees which play an important role in the formation of vdf and eedf. Three case studies are in particular selected differing by the length of the pulse ( ) which determines the concentration of excited states and of free electrons. The relevant choice is important for both the discharge and post-discharge conditions.
3.1. Case study 1
We consider a reduced electrical field E/N = 100 Td applied for  = 40 ms to a molecular nitrogen gas with p = 5 mtorr and T = 500 K, constant during the simulation, while the post-discharge regime is followed up to 1 s. The initial distributions (t = 0) are Boltzmann vdf and Maxwell eedf at 500 K, respectively, while a very low initial degree of ionization α = 10−10 is considered. The initial distributions start following the application of electrical field until the achievement of a first stationary eedf in the so-called cold gas approximation, i.e. in an environment poor of vibrational and electronic excited states. Perturbations to this stationary state are observed when a well-developed vibrational distribution is formed which in turn represents a new heating for electrons through superelastic vibrational collisions with cold electrons. A new stationary state can be formed when the concentration of atomic species becomes important. In this case the atoms affect the eedf because they present inelastic losses lower than the corresponding ones involving molecules. The post-discharge regime is dominated by superelastic electronic and vibrational collisions. On the other hand we can imagine that the electron density will strongly increase during the pulse following the trend of eedf and vdf, while a decrease is expected when the electrical field is turned off. To understand the relevant results we can define different relaxation times which will be recovered in the relevant results. It should be noted that the relaxation times involving free electrons depend on the electron density. In this case we select the electron density at t ∼ 30 ms. Typical relaxation times can be estimated as
where  describes the relaxation time for pumping vibrational energy in the molecules and
  the relaxation time for getting a stationary condition for eedf in the cold gas approximation.
  and
and  represent vibration–vibration and vibration–translation energy transfer relaxation times involving molecular nitrogen. Of course the reported relaxation times must be taken on a qualitative basis since at longer times large concentrations of atoms and vibrationally and electronically excited states can appear, characterized by completely different relaxation times. The longer pulse considered in this case study is such to generate important concentrations of excited states and of electrons as well as of atomic nitrogen which will in turn affect, as anticipated, the eedf. These qualitative considerations can be recovered by the results reported in figure 1.
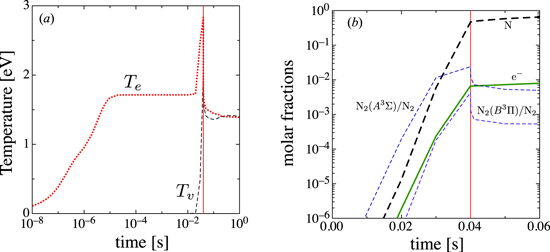
Figure 1. (a) Temporal evolution of electron and N2 vibrational temperatures for case 1 (p = 5 mtorr, T = 500 K, E/N = 100 Td,  = 40 ms). (b) Temporal evolution of electron, atomic nitrogen, relative
  and
and  N2 state molar fractions. (The vertical line indicates the end of the pulse.)
Download figure:
Standard image High-resolution imageLet us first examine the time evolution of the electron temperature, as 2/3 of the average electron energy,  calculated from the eedf, as well as the N2 vibrational temperature, estimated as the average vibrational energy from vdf. Figure 1(a) shows the evolution of temperatures from the beginning of the discharge up to 40 ms as well as in the post-discharge. In particular we can note that in the post-discharge
  , are in agreement with the results in [41]. Both these quantities start from their initial small values presenting different trends especially in the early evolution. In fact Te reaches a quasistationary situation in times of the order of 10−5 s keeping this value up to times of about 10−2 s. From 10−2 s to 3 10−2 s the e–V processes start pumping vibrational energy in the system and superelastic vibrational collisions increase the electron average energy. On the other hand the
  keeps a constant low value up to 10−2 s, starting to increase in the time interval for
  10−2 s. In the post-discharge we can note a sudden decrease of Te due to the turn-off of the electrical field, while
  relaxes from the value of 2 eV at the end of pulse to 1.4 eV in the post-discharge.
This behavior reflects the action of the applied electrical field on the achievement of a quasistationary situation for eedf in qualitative agreement with the relaxation time  . On the other hand in the time interval
  the vibrational and electronic states of N2 are not populated so that the corresponding average energy of molecular nitrogen does not increase. The situation completely changes from
  when vibrational and electronic energies of nitrogen start being activated. The coupling between the vibrational and electronic energy of N2 molecules with the eedf through superelastic collisions is such to increase the electron temperature as reported in figure 1(a). This coupling lasts up to 4 10−2 s when both temperatures present a maximum which then evolves toward another stationary situation. On the other hand the fraction of atomic nitrogen at the end of the pulse (figure 1(b)) reaches a value of 0.46 sufficient to affect the eedf partially eliminating the vibrational inelastic and superelastic vibrational collisions of electrons. Moreover a high molar fraction of electrons, around 6.7 10−3, is formed at the end of pulse, with this fraction slightly increasing in the afterglow.
Figure 2 reports the time-dependent evolution of vdf. At the end of the pulse a quasi Boltzmann distribution is present up to 8 eV which decays in the afterglow. At 1 s one can observe a small deactivation of vdf due to multiquantum V–T transitions involving atomic nitrogen.

Figure 2. Temporal evolution of N2 vibrational distribution in discharge and post-discharge conditions, for case 1 (p = 5 mtorr, T = 500 K, E/N = 100 Td,  = 40 ms).
Download figure:
Standard image High-resolution imageFigure 3 reports the time evolution of eedf starting from a very cold eedf (Maxwell, T = 500 K) under the discharge (a) and afterglow (b) conditions. We can note that the eedf's are very smooth either in the discharge or in post-discharge conditions. The structures due to superelastic electronic collisions are not present in this case study for the combined action of superelastic vibrational collisions, the thermalizing action of electron–electron collisions and the presence of atoms. On the other hand the eedf's reported in figure 3(a) show the passage from the molecular cold gas situation to a final situation (40 ms) where e–V (inelastic and superelastic) processes as well as electron–electron Coulomb collisions play an important role. The eedf in the post-discharge (figure 3(b)), after cooling due to the turn-off of the electric field, presents a regular evolution controlled by superelastic vibrational collisions in combination with electron–electron collisions.

Figure 3. Temporal evolution of eedf for N2 plasma under the discharge (a) and post-discharge (b) conditions, for case 1 (p = 5 mtorr, T = 500 K, E/N = 100 Td,  = 40 ms).
Download figure:
Standard image High-resolution imageThe action of atomic nitrogen also becomes important in the dissociation and ionization processes as one can appreciate by looking figures 4(a) and (b). In figure 4(a) the time-dependent rates for the following dissociation channels are reported:


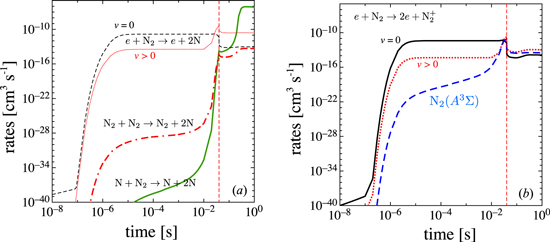
Figure 4. Temporal evolution of kinetics rate coefficients for N2 dissociation (a) and ionization (b) processes under the discharge and post-discharge conditions, for case 1 (p = 5 mtorr, T = 500 K, E/N = 100 Td,  = 40 ms).
Download figure:
Standard image High-resolution imageWe can see that the contribution of direct electron impact is the most important under the discharge conditions, while the dissociation involving atomic nitrogen becomes very important in the post-discharge due in particular to the multiquantum dissociation vibrational jumps [42–44]. Note that the dissociation involving nitrogen–nitrogen collisions becomes important only under the post-discharge conditions. In figure 4(a) the contributions of dissociations from v = 0 and  are reported. One can observe that the
  contribution becomes important from 20 ms on exceeding up to more than two orders of magnitude the v = 0 contributions in the post-discharge.
Also interesting is the ionization rates due to the processes


The relevant rates are reported in figure 4(b) showing the importance of channels (8) and (9) compared to the v = 0 contribution for  30 ms on. In the post-discharge the sum of contributions are up to an order of magnitude higher than the v = 0 contribution.
3.2. Case study 2
In this case study the same conditions of case study 1 are considered, the only difference being  = 30 ms. Under the discharge conditions the results for this case study can be recovered from the previous figures up to t = 30 ms. In contrast in the post-discharge there are many differences because the shorter pulse creates lower concentrations of vibrationally and electronically excited state as well of free electrons. The temperatures and the molar fractions of the different species are reported in figures 5(a) and (b) only in the post-discharge regime. We can see that the N2 vibrational temperature decays from 0.49 (end of pulse) to 0.41 eV in the post-discharge, while the electron density decays from the initial molar fraction of 2 10−4 to 10−5 at the end of the post-discharge, the
  state decaying from 10−2 to 10−5 under the same conditions.
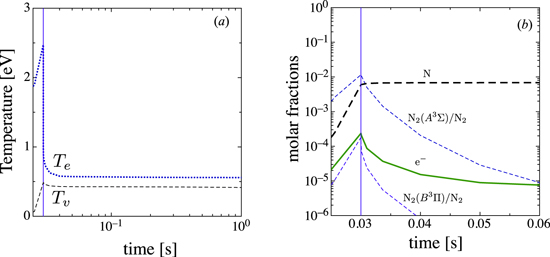
Figure 5. (a) Temporal evolution of electron and N2 vibrational temperatures for case 2 (p = 5 mtorr, T = 500 K, E/N = 100 Td,  = 30 ms). (b) Temporal evolution of electron, atomic nitrogen, relative
  and
and  N2 state molar fractions. (The vertical line indicates the end of the pulse.)
Download figure:
Standard image High-resolution imageBoth vibrational energy and the  state act in the post-discharge conditions especially on the vdf and eedf behavior reported in figures 6(a) and (b). In particular figures 6(a) and (b) report the behavior of the vdf and eedf in the post-discharge regime, respectively. The vdf presents a small decay showing however a well-pumped distribution sustained by forward and reverse e–V processes. The low concentration of atoms is unable to deactivate the distribution. More interesting is the evolution of eedf. In this case the relaxation occurs in the presence of a quasi-constant vibrational (small) temperature as well as with the concentration of molecular excited states, in particular the
  state, decaying with time. The
  state is responsible for the structures present in the eedf which tend to disappear following its decay. On the other hand the bulk of eedf is controlled by the vibrational temperature of the system so that the eedf converges at 1 s to a Maxwell distribution with

Figure 6. Temporal evolution of N2 vibrational distribution (a) and eedf (b) under the post-discharge conditions, for case 2 (p = 5 mtorr, T = 500 K, E/N = 100 Td,  = 30 ms).
Download figure:
Standard image High-resolution imageFigure 7 reports the time evolution of the different dissociation and ionization rates. The electron impact processes follow the evolution of eedf with a small peak at 30 ms due to the effect of superelastic vibrational collisions on eedf. The heavy particle dissociation rates follow on the contrary the time evolution of vdf. In the afterglow all the rates present a decay mitigated by the presence of vibrational states which promote the relevant reactions involving the high-lying vibrational states. Note that at the end of the pulse and in the post-discharge the  contribution plays an important role in the dissociation, while (figure 7(b))
  0,
0,  and
and  state contributions have the same importance in the ionization rate.
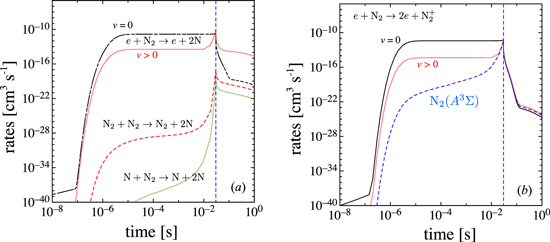
Figure 7. Temporal evolution of kinetics rate coefficients for the N2 dissociation (a) and ionization (b) processes under the discharge and post-discharge conditions, for case 2 (p = 5 mtorr, T = 500 K, E/N = 100 Td,  = 30 ms).
Download figure:
Standard image High-resolution image3.3. Case study 3
This case study deals with a reduced value of the pulse duration,  = 20 ms. We expect in this case lower molar fractions of vibrationally and electronically excited states, of free electrons as well as lower electron and vibrational temperatures. The situation can be understood by looking at the previous figures as well as at figures 8(a) and (b). From the relevant figures we can see that the vibrational temperature at the end of the pulse is
  , while the electron temperature is about 1.5 eV. The molar fraction of the
  state and free electrons are about 10−4 s and 10−6 s, respectively, keeping approximately the same values in the post-discharge, while Te abruptly decreases to very small values.

Figure 8. (a) Temporal evolution of electron and N2 vibrational temperatures for case 3 (p = 5 mtorr, T = 500 K, E/N = 100 Td,  = 20 ms). (b) Temporal evolution of electron, atomic nitrogen, relative
  and
and  N2 state molar fractions. (The vertical line indicates the end of the pulse.)
Download figure:
Standard image High-resolution imageFigures 9(a) and (b) show the corresponding behavior of vdf and eedf under the post-discharge conditions. We can see that the vdf's are less populated than in the previous cases showing however a peculiar behavior, i.e. a redistribution of quanta from low-lying vibrational states to high-lying ones. The behavior of eedf in the post-discharge regime presents well-structured forms due to the interplay of holes and humps, respectively, created by inelastic vibrational collisions and superelastic electronic collisions involving the metastable  state. Dissociation and ionization rates are reported in figure 10.

Figure 9. Temporal evolution of N2 vibrational distribution (a) and eedf (b) under the post-discharge conditions, for case 3 (p = 5 mtorr, T = 500 K, E/N = 100 Td,  = 20 ms).
Download figure:
Standard image High-resolution imageIt is difficult to compare the present results with the numerous experimental results mentioned in the introduction. Concerning the vibrational distributions we must remind the reader that the present results refer to the vibrational distribution of the ground state of nitrogen while the experimental ones refer to the vibrational distribution of electronically excited states. Moreover the experimental distributions sample the low-lying vibrational levels of the excited state which in general are of Boltzmann type. From the Boltzmann plots of these distributions one obtains the vibrational temperature of the excited state. In general very high vibrational temperatures are observed in line with the theoretical results previously reported. However the theoretical results indicate the presence of a non-equilibrium portion of vdf involving the high-lying excited states. As an example in an inductive low pressure Ar(5%) N2(95%) operating a p=1.4 mtorr, Te=2.61 eV, Tg=400 K, ne=1010 cm−3, i.e. a degree of ionization of  =2.8 10−4 [9], a vibrational temperature of 9100 K was experimentally determined from the second positive system of nitrogen (
 ). Our results for case 1 report a value of the vibrational temperature at the end of the discharge of 2 eV = 23 200 K with a degree of ionization of α = 6.7 10−3, while for case 2 we obtain a vibrational temperature of 0.49 eV ≈ 5700 K and a degree of ionization of
  = 2 10−4. Keeping in mind that to a first approximation the vibrational temperature depends on the degree of ionization we can assume that case 2 is close to the experimental conditions. Moreover we can correct the theoretical vibrational temperature of case 2 by the following equation:

in satisfactory agreement with the experimental Tv value.
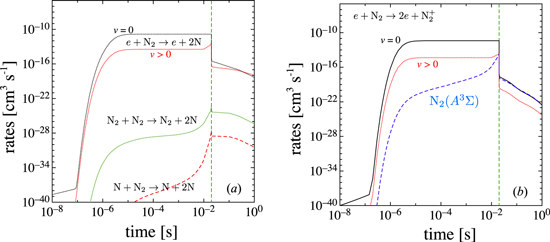
Figure 10. Temporal evolution of kinetics rate coefficients for N2 dissociation (a) and ionization (b) processes under the discharge and post-discharge conditions, for case 3 (p = 5 mtorr, T = 500 K, E/N = 100 Td,  = 20 ms).
Download figure:
Standard image High-resolution imageMoreover the present results are in line with those reported by Kemaneci et al [13] in low pressure O2 plasmas. In particular the strong non-equilibrium character of the time-dependent  vdf under the discharge and post-discharge conditions [13] are to some extent in qualitative agreement with our vibrational distributions.
A similar agreement is found comparing our values of case 2 with the experimental value obtained in [12]. These authors present experimental vibrational temperatures in the pressure range 0.04–100 Pa together with the measurements of electron density in the same pressure range. The measured degree of ionization for 5 mtorr = 0.667 Pa amounts to about 1.55 1010 cm−3 corresponding to  = 1.6 10−4. Inserting this value in equation (10) we get a theoretical Tv value of 4560 K, not too far from the experimental value of 4800 K. Note that in this case the vibrational temperature refers to the ground state of nitrogen as a kinetic deconvolution of the second positive system of the molecule.
Concerning the eedf our results show a non-Maxwell behavior either in the molecular plasma situation or in the atomic one (case 1). We see that the degree of ionization  10−3 is able to maxwellize the distribution in both the discharge and post-discharge conditions. The hole in the eedf distribution due to e–V inelastic collisions persists only in the absence of superelastic vibrational collisions, i.e. in the post-discharge regime of case 3, as well as at low electron densities. To an extent this behavior is qualitatively in line with the experimental results reported by Lee et al [6]. These authors investigate the E–H transition in low pressure inductively N2-Ar plasmas as a function of ICP power. In the E regime the electron density remains small presenting an abrupt change at a given pressure as a function of power. The measured eedf in the E region presents a deep hole due to the inelastic vibrational losses near 3 eV not contrasted by electron–electron thermalizing collisions, while in the H region the eedf is essentially Maxwellian.
4. Comparison with the moderate and high-pressure regimes
In this section the afterglow results obtained in this study are compared with the corresponding results obtained at moderate (torr) [20, 22] and high (hundreds of torr) pressures [17]. Some general considerations can help to understand this comparison. First of all one must transform the time scale (t) of the present results (T = 500 K, p = 5 mtorr) to the time scale ( ) of the results in the literature operating at different T and p values according to
The important quantities which determine the evolution of eedf in the afterglow are the initial values of the
- (i)Vibrational temperature Tv,
- (ii)Molar fraction of metastable states in particular the one and
- (iii)Degree of ionization.

High vibrational temperatures tend to hide the role of metastable states in structuring eedf, average vibrational temperatures enter in competition with the metastable states in affecting eedf while negligible values of Tv exalt the role of the metastable states in affecting eedf. High values of the degree of ionization tend to maxwellize eedf and to smooth eventual structures in eedf. These simple statements will be recovered in this study.
The results reported in figure 3(b) (40 ms pulse) can be compared with those reported in figure 1 of [20] (p = 2 torr, T = 1000 K). In this case  = 5 10−3 t is the new time scale of our results. Our vibrational temperature (23 200 K) at the end of pulse is close to the initial vibrational temperature (21 000 K) considered by Loureiro et al [20]. The considered high vibrational temperature minimizes the role of the superelastic electronic collisions from the
  state, maximizing at the same time the role of superelastic vibrational collisions. As a result the scaled time evolution of eedf from figure 3(b) is similar to the corresponding results reported in figure 1 of [20] approximately in the energy range 0–5 eV. In this energy range the superelastic vibrational collisions are responsible for the small time spread of eedf. On the other hand large differences are found in eedf for
  5 eV, due to the corresponding differences in the degrees of ionization reported in the two cases. In particular the higher degree of ionization found in the mtorr regime as compared with the corresponding values of [20] in the torr regime are responsible for the small evolution of eedf because the e–V pumping rates are higher than the V–T ones, the reverse being true for the results of figure 1 of [20]. In addition, in this last case the authors consider a gas temperature of 1000 K against 500 K of the mtorr regime, thus increasing the V–T rates acting as the thermalization of the vdf [23] and indirectly of the eedf.
The results reported in figure 6(b) can be compared with the corresponding results reported in figure 16 of [22] (p = 3.3torr, T = 500 K). The initial vibrational temperature of the results reported in figure 5(b) is 5700 K close to the vibrational temperature 6200 K of [22]. The molar fraction of the  state under the present conditions as well as the ionization degree are larger than the corresponding values reported in [22]. As a consequence the decay of eedf in the post-discharge conditions of the mtorr regime will be attenuated as compared with the results of [22]. In particular higher and longer eedf plateaux are found in the mtorr regime as compared with the corresponding values of the torr regime. These qualitative observations can be recovered in figures 11(a)–(c), where the mtorr results for selected times in the afterglow (absolute and scaled) are compared with the results of [22].
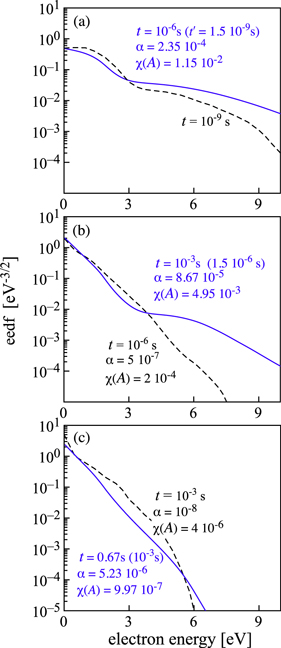
Figure 11. Comparison of the electron energy distribution function of the N2 plasma at different times in the afterglow for case 2 (p = 5 mtorr, T = 500 K,  = 30 ms) (solid lines) compared with the results obtained in [22] (p = 3.3 torr, T = 500 K) (dashed lines). For the mtorr curves the scaled time (
 ) is reported in parentheses. In the figures the corresponding values of degree of ionization, α, and
  state molar fraction,
  , are also reported.
Download figure:
Standard image High-resolution imageWe can compare the scaled results of figure 9(b) with the corresponding ones obtained at 300 torr in [17] ( = 1.7 10−5 t). The initial conditions of this last numerical experiment (T = 500 K; p=300 Torr) consider a low vibrational temperature (Tv = 400 K), a degree of ionization of 10−6 and a molar fraction of the
  state of 5 10−4. The corresponding initial conditions for our 20 ms case study at the end of the 20 ms pulse are respectively 1.9 10−6 and 1.9 10−4. We are in an ideal condition to see the effect of metastable states on eedf under the post-discharge conditions due to the practical absence of the perturbing action of superelastic vibrational collisions and of the electron–electron Coulomb collisions as a result of the corresponding small molar fraction of electrons and low vibrational temperature in both cases. A very good agreement between eedf from [17] and the present scaled time results is found (see figures 12(a)–(c)). In particular we can see the maxima in the eedf created by the
  state and the deep minima created by the absence of inelastic losses in the 1–3 eV energy range, minima not filled by superelatic vibrational collisions and by electron–electron ones as partially done in the previous case.

Figure 12. Comparison of the electron energy distribution function of the N2 plasma at different times in the afterglow for case 3 (p = 5 mtorr, T = 500 K,  = 20 ms) (solid lines) compared with the results obtained in [17] (p = 300 torr, T = 500 K) (dashed lines). For the mtorr curves the scaled time (
 ) is reported in parentheses. In the figures the corresponding values of degree of ionization, α, and
  state molar fraction,
  , are also reported.
Download figure:
Standard image High-resolution image
Similar results are found by comparing the mtorr results in this study with other existing results for torr [18] and atmospheric [27] post-discharges. These observations can become important for future experimental determination of eedf in the post-discharge regime for pressure regimes when it is not possible to use Langmuir probes for the determination of eedf. In these cases one could use experimental and theoretical eedf in the mtorr regime to obtain information about the afterglow eedf in the higher pressure regimes.
5. Conclusions
The main achievements of this paper are in the observation of non-equilibrium vibrational distributions and non equilibrium electron energy distribution functions in low pressure (mtorr), high-electron-density nitrogen plasmas. These results are mainly due to electron–molecule energy exchange processes and to the appearance of nitrogen atoms, which affect both eedf and vdf. Electron–electron collisions in the presence of large concentrations of excited states are able to maxwellize eedf only for degrees of ionization >10−3. These results can be used to qualitatively help the rationalization of the numerous experimental values reported in the literature for both eedf and vdf. Improvement of the present results can be obtained either by adding a robust ionization kinetics or by taking into account non-local effects in eedf. Moreover the dimension of the reactor as well as the loss of all species on the walls should be taken into account, this requiring completely new efforts to improve the necessary rates that at the moment are largely unknown. Dedicated experiments showing the time evolution of the relevant distributions in the low pressure nitrogen plasma should be welcome to clarify many of the points discussed in this paper. In particular dedicated Langmuir probe experiments should be developed to measure the time-dependent eedf [14] in the mtorr post-discharge regime taking into account the present numerical results as a guide to select the best initial conditions. This point is particularly important for obtaining information about eedf under medium and high-pressure conditions when the Langmuir probe technique cannot be used. In these cases one could use experimental and theoretical eedf in the mtorr regime to investigate the eedf in the higher pressure regimes as discussed in the this paper.
Acknowledgments
The research leading to these results has received funding from MIUR (contract PON03PE000676 ApuliaSpace).