
Abstract
Low-pressure capacitively coupled radio frequency discharges operated in O2 and driven by tailored voltage waveforms are investigated experimentally and by means of kinetic simulations. Pulse-type (peaks/valleys) and sawtooth-type voltage waveforms that consist of up to four consecutive harmonics of the fundamental frequency are used to study the amplitude asymmetry effect as well as the slope asymmetry effect at different fundamental frequencies (5, 10, and 15 MHz) and at different pressures (50–700 mTorr). Values of the DC self-bias determined experimentally and spatio-temporal excitation rates derived from phase resolved optical emission spectroscopy measurements are compared with particle-in-cell/Monte Carlo collisions simulations. The spatio-temporal distributions of the excitation rate obtained from experiments are well reproduced by the simulations. Transitions of the discharge electron heating mode from the drift-ambipolar mode to the α-mode are induced by changing the number of consecutive harmonics included in the driving voltage waveform or by changing the gas pressure. Changing the number of harmonics in the waveform has a strong effect on the electronegativity of the discharge, on the generation of the DC self-bias and on the control of ion properties at the electrodes, both for pulse-type, as well as sawtooth-type driving voltage waveforms The effect of the surface quenching rate of oxygen singlet delta metastable molecules on the spatio-temporal excitation patterns is also investigated.
Export citation and abstract BibTeX RIS

Content from this work may be used under the terms of the Creative Commons Attribution 3.0 licence. Any further distribution of this work must maintain attribution to the author(s) and the title of the work, journal citation and DOI.
1. Introduction
The application of tailored voltage waveforms to excite capacitively coupled radio frequency (RF) discharges offers a promising new direction for advanced control of particle flux-energy distribution functions in technological plasmas [1]. Such waveforms, also called customized voltage waveforms, have a non-sinusoidal shape and can be generated as the sum of signals with a fundamental frequency and a number of its higher harmonics with defined phase shifts between them. The waveform shape can be changed by individually varying the harmonics' amplitude and phases. This multi-frequency excitation of capacitively coupled plasmas (CCPs) with tailored voltage waveforms affects the division of sheath voltages and therefore the energy of ions arriving at the two electrode surfaces via modification of the shape of the applied voltage waveform. This method is a generalization of the electrical asymmetry effect (EAE): in [2] it was shown that exciting a RF plasma by two consecutive harmonics, such as 13.56 and 27.12 MHz, a DC self-bias voltage is induced (in a geometrically symmetric discharge configuration) that can be changed by varying the phase between the two components. Tuning the self-bias via the phase shift of the harmonics, the energy of ions can be controlled while the ion flux remains nearly constant. This technique significantly improved the separation of control of the ion properties at the two electrodes, such as the ion flux and mean ion energy, compared to the case of classical dual-frequency excitation by using significantly different frequencies in CCPs [3–8].
Complex shapes of the driving voltage waveform (e.g. pulse-type, sawtooth-type) can be generated by applying a sufficiently high number of harmonics of a fundamental RF frequency and carefully selected phase shifts between them. The electrically asymmetric plasma response arising from the application of such waveforms to excite CCPs can be attributed to two different effects in the frame of the EAE: the amplitude asymmetry effect (AAE) and the slope asymmetry effect (SAE). The AAE arises from the difference between the maximum and minimum values of the driving voltage waveform, while the SAE arises from the significantly different positive and negative slopes of the applied voltage waveform. The AAE has been thoroughly investigated for dual-frequency excitation [9–15] as well as for waveforms comprising more harmonics [16–28]. In the SAE, introduced later [29–32], sawtooth-like waveforms are used, which leads to significantly different sheath dynamics. In an electropositive gas this causes fast sheath expansion and strong ionization at one electrode and a slowly expanding sheath and weak ionization at the other electrode. These initial investigations were mostly focused on discharges operated in electropositive gases (argon in most cases), and only a few studies were carried out in electronegative, reactive gases, which are highly relevant for processing applications (e.g. CF4, O2) [13, 14, 26–28, 32, 33].
Electronegative plasmas are characterized by the presence of negative ions and by electronegativity values  , where
  is the negative ion and
  is the electron density averaged over the electrode gap. Compared to electropositive plasmas, discharges operated in electronegative gases exhibit different electron power absorption and ionization dynamics. While low-pressure electropositive discharges typically operate in the α-mode [34], where the ionization is dominated by electrons accelerated by the oscillating sheaths, electronegative discharges can operate also in the drift-ambipolar (DA) mode [35]. In the DA-mode ionization is caused by electrons accelerated by a strong drift electric field in the plasma bulk due to the low conductivity resulting from the depleted electron density. The low electron density in the bulk is the result of the attachment of electrons to neutral gas molecules; in this process negative ions are formed which are confined within the plasma bulk. Further ionization is generated by an ambipolar field at the sheath edges caused by local maxima of the electron density in the electropositive edge region of the discharge. The presence of this DA-mode was recently found to strongly affect the ionization dynamics and the generation of a DC self-bias in capacitively coupled CF4 discharges driven by tailored voltage waveforms [27, 28, 32, 33]. However, there is a lack of knowledge on the effect of voltage waveform tailoring on different discharge characteristics in electronegative, reactive plasmas under various discharges conditions. This work intends to contribute to the understanding of the discharge physics in oxygen, a gas which is frequently used in plasma processing, under conditions where different types of electrical asymmetry are induced.
Here, we present a systematic study of the electron power absorption and excitation dynamics in capacitively coupled O2 discharges excited by tailored voltage waveforms. Experimental data on the DC self-bias and spatio-temporal excitation rates are compared to results of particle-based numerical simulations. A maximum of four harmonics of a fundamental frequency are applied to generate voltage waveforms with amplitude asymmetry as well as waveforms with slope asymmetry. The effects of the number of harmonics, fundamental frequency, and gas pressure on the discharge operation mode and control of ion properties at the electrodes are investigated for both types of customized voltage waveforms.
The paper is structured as follows: the experimental setup and the simulation method are described in section 2. The presentation of the experimental and simulation results in section 3 is divided into two parts. First, the AAE is studied by using peaks-type waveforms. Secondly, the SAE is studied by applying sawtooth-type waveforms A short summary of the work is given in section 4.
2. Methods
In this study both experimental and numerical methods are used to study O2 CCPs excited by tailored voltage waveforms. In section 2.1 the experimental setup is described, while in section 2.2 the simulation method and details of the O2 discharge model are presented. Here, two types of customized voltage waveforms, composed of N harmonics of a fundamental frequency, f1, are applied to drive capacitively coupled O2 discharges:
- (i)'Peaks' and 'valleys' waveforms:where
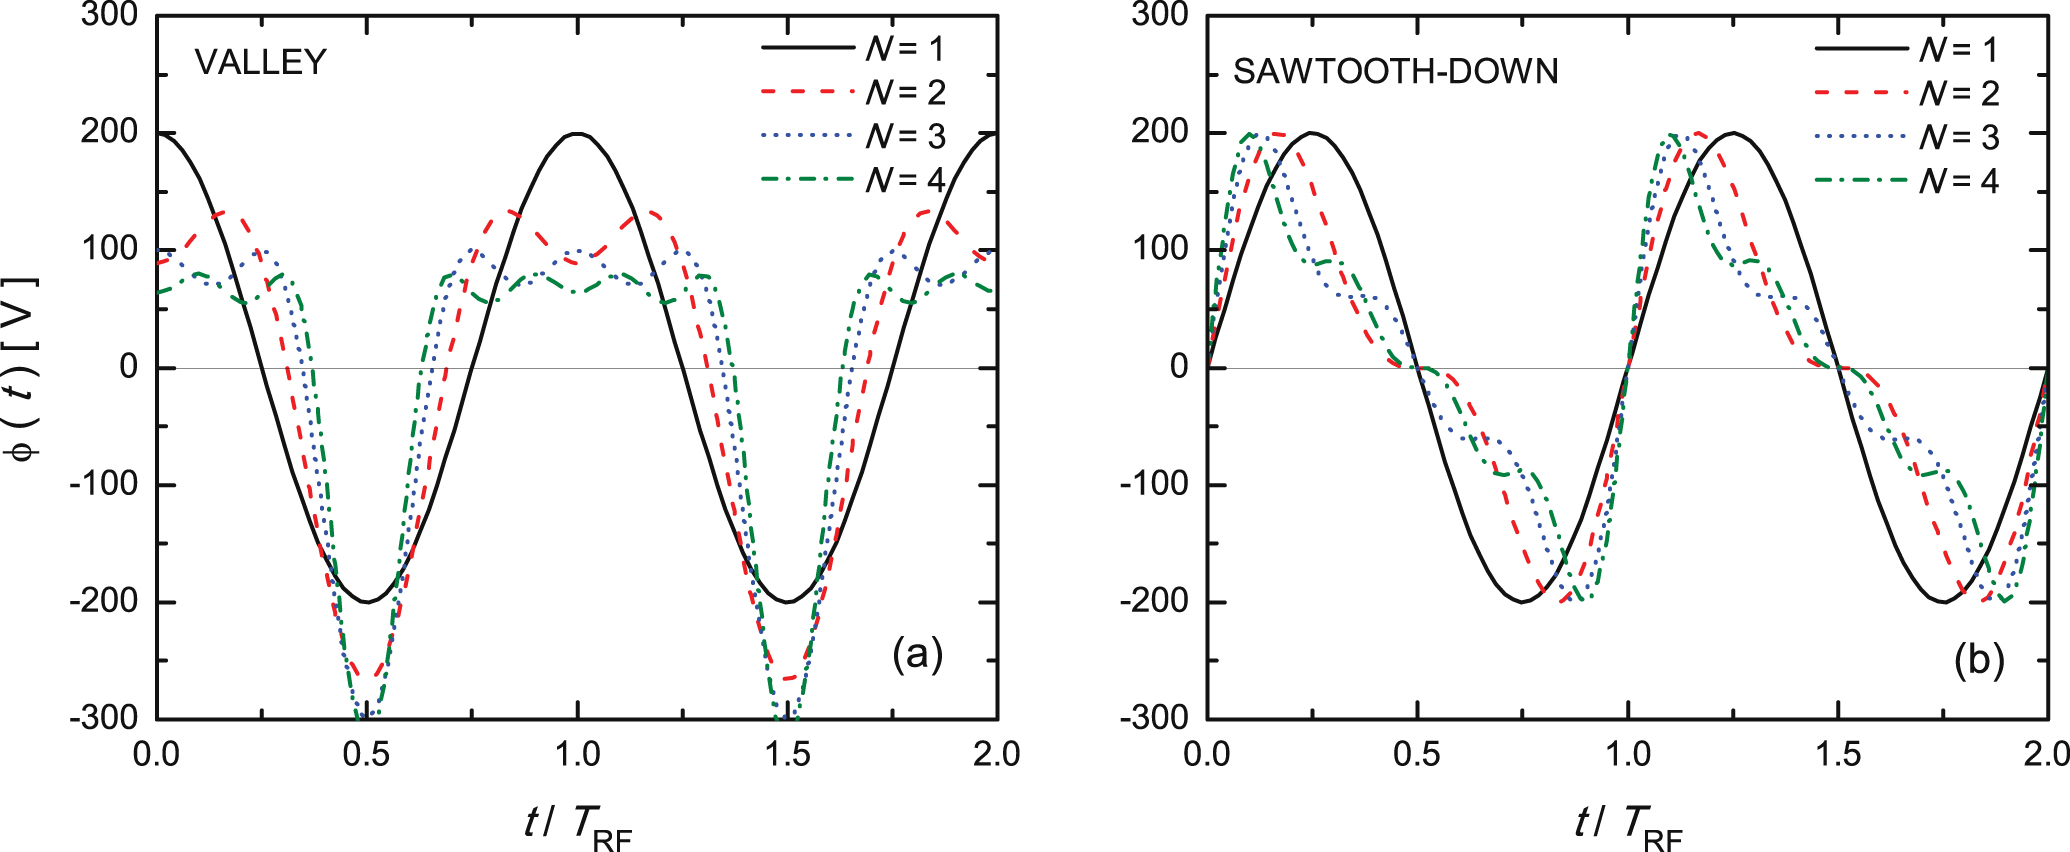
 are the phase angles, and the amplitudes of the individual harmonics, , are set according to the following equations:In the above formula is the peak-to-peak voltage. The 'peaks'-type voltage waveforms are generated by setting all to zero. The 'valleys'-type voltage waveforms are obtained by changing the phase angles of all even harmonics to π. By reversing the shape of the waveform, i.e. by changing the waveform shape from peaks to valleys or vice versa, the plasma is mirrored with respect to the center of the electrode gap. Figure 1(a) illustrates 'valleys'-type waveforms generated in this way for different numbers of harmonics.
 - (ii)'Sawtooth' waveforms:where the minus and plus signs correspond to 'sawtooth-up' and 'sawtooth-down' waveforms, respectively. changes with the total number of harmonics, N, and is set in a way to give the desired peak-to-peak voltage, . In figure 1(b) sawtooth-down waveforms are shown for different numbers of harmonics.


Figure 1. Tailored voltage waveforms: (a) 'valley'-type waveforms generated according to equation (1) and (b) 'sawtooth-down' type waveforms generated according to equation (3) for different numbers of harmonics, N.  = 400 V for all cases. The time axis covers two periods (
 ) of the fundamental RF frequency, f1.
  .
.
Download figure:
Standard image High-resolution image2.1. Experiment
The experimental setup is shown schematically in figure 2. A reactor with an inter-electrode gap of L = 2.5 cm was made geometrically symmetric by adding a thick Teflon ring (internal diameter 12 cm, external diameter 19 cm), with a window comprising a glass block 2.5 cm × 2.5 cm × 10 cm to allow optical access. The voltage waveforms were generated using a computer-controlled arbitrary function generator (AFG Tektronix 3150) and a wideband power amplifier (Prana AP32GN310, 0.01–200 MHz, 1 kW) as described previously [36]. The true delivered waveform is monitored by a high voltage probe (Tektronix P5100), and the waveform is corrected for distortion using a feedback loop as proposed in [37]. The intensified charge-coupled device (ICCD) camera (Andor iStar) is synchronized to the AFG, and the phase is varied using a digital delay generator (Stanford Research Systems DG 645). An intensifier gate of the ICCD camera is set to 2 ns or 5 ns depending on the fundamental frequency of the waveform being investigated. We used phase resolved optical emission spectroscopy (PROES) to observe the 844.6 nm line, which corresponds to emission from the O(3p3P) excited state, as a function of position between the two electrodes and phase within the fundamental RF cycle. Under the conditions investigated in this study, where the dissociation degree is expected to be low [38], the O(3p3P) state is predominantly formed through dissociative excitation of molecular oxygen [39] (given by reaction 15 in table 1). Emission at 844.6 nm is isolated using a custom narrow bandpass filter (LOT—QuantumDesign: 844.79 ± 0.95 nm). The excitation rate of the O(3p3P) at each position and phase is derived from the measured emission, using the method proposed in [40]. Collisional quenching of the O(3p3P) excited state by molecular oxygen is accounted for in the calculation of the excitation using the quenching coefficient (9.4 × 10⁻¹⁶ m3 s−1) measured in [41].

Figure 2. Schematic of the experimental setup with computer, arbitrary function generator (AFG), RF power amplifier to generate the desired waveform, delay generator, ultrafast camera for PROES measurements, and high-voltage probe.
Download figure:
Standard image High-resolution imageTable 1. List of collision processes considered in the simulation.
| # | Reaction | Process | References |
|---|---|---|---|
| 1 |

|
Elastic scattering | [42] |
| 2 |

|
Rotational excitation | xpdp1 |
| 3 |

|
Vibrational excitation | xpdp1 |
| 4 |

|
Vibrational excitation | xpdp1 |
| 5 |

|
Vibrational excitation | xpdp1 |
| 6 |

|
Vibrational excitation | xpdp1 |
| 7 |

|
Metastable excitation (0.98 eV) | xpdp1 |
| 8 |

|
Metastable excitation (1.63 eV) | xpdp1 |
| 9 |

|
Dissociative attachment | xpdp1 |
| 10 |

|
Excitation (4.5 eV) | xpdp1 |
| 11 |

|
Dissociation (6.0 eV) | xpdp1 |
| 12 |

|
Dissociation (8.4 eV) | xpdp1 |
| 13 |

|
Dissociation (9.97 eV) | xpdp1 |
| 14 |

|
Ionization | [43] |
| 15 |

|
Dissociative excitation (14.7 eV) | xpdp1 |
| 16 |

|
Electron impact detachment | xpdp1 |
| 17 |

|
Dissociative recombination | xpdp1 |
| 18 |

|
Elastic scattering | [43] |
| 19 |

|
Elastic scattering | [43] |
| 20 |

|
Detachment | [43] |
| 21 |

|
Mutual neutralization | [43] |
| 22 |

|
Associative detachment | [44] |
2.2. Simulation
The numerical investigation of O2 plasmas is based on a bounded, one-dimensional in space and three-dimensional in velocity space (1D3v) particle-in-cell simulation code incorporating a Monte Carlo treatment of collision processes (PIC/MCC) [45]. This code is suitable to describe geometrically symmetric plasma reactors, without taking into account 2D effects. The core of the code has been benchmarked against other implementations of the same algorithm within an international collaboration [46]. The reactor geometry is simplified by assuming plane and parallel electrodes with a gap of L = 2.5 cm between them, one driven by a RF voltage waveform composed of a maximum of four consecutive harmonics generated according to equations (1) or (3), while the other electrode is grounded. Three different values of the fundamental frequency are used: 5, 10, and 15 MHz. The gas temperature is fixed at  = 300 K. Both the electron reflection coefficient at the electrodes and the secondary electron yield are set to zero. The gas pressure is 50 mTorr ≤ p ≤ 700 mTorr, and the maximum applied peak-to-peak voltage is 400 V. The DC self-bias, η, which develops due to the amplitude or slope asymmetry of the applied waveforms is determined in an iterative way in the simulations, by adjusting its value so as to achieve equal losses of positive and negative charges at each electrode over one period of the fundamental driving frequency [47].
In the simulations, the following charged species are traced:  , O− and electrons. The collision-reaction model underlying the simulations is the same as that introduced in [26]. In that work a detailed analysis of the numerous sets of processes and related cross sections/rate coefficients proposed in the literature for the numerical description of O2 plasmas [43, 44, 48, 49, 50] has also been performed. In [26] a thorough test of the model is also provided: good agreement was found between various discharge characteristics (DC self-bias voltage, power absorbed by the discharge, ion flux, and ion flux energy distribution) obtained from PIC/MCC simulations and experiments. The set of elementary processes considered in the model is given in table 1. Further details of the model can be found in [26]. We note the relatively low number of different plasma species and elementary processes included in this model. However, the good agreement between the simulation and experimental results for a wide range of discharge conditions indicates that our model describes reasonably well the complex oxygen discharge under the conditions studied.
The density of oxygen singlet delta  molecules in the discharge is largely controlled by their surface quenching probability, α. The value of this coefficient is not well known, it shows a large variation for different electrode materials [51, 52]. Our choice of
  resulted in the best overall agreement between the experimental and simulation data for the ion fluxes at the electrodes in a previous work [26]. To reveal the influence of α on the spatio-temporal profiles of light emission, computations were carried out over a wide range of this parameter.
All computations have been carried out using a spatial grid with Nx = 200–1000 points and Nt = 2000–10 000 time steps within the fundamental RF period. These parameters have been selected to fulfil the stability criteria of the computational method. The simulation results have been obtained by averaging over 20 000 cycles of the fundamental RF frequency.
3. Results
In the following, the impact of waveforms with amplitude asymmetry (generated according to equation (1)) and those with slope asymmetry (generated according to equation (3)) on the O2 discharge characteristics are investigated. This section is divided in two parts accordingly. In both parts the spatio-temporal excitation rates and the DC self-bias obtained experimentally and from PIC/MCC simulations are compared. Information on the  ion flux and mean ion energy at the electrodes, as well as the electronegativity of the discharge are also extracted from the simulations and are analyzed. The discharge is operated in the pressure range 50 mTorr ≤ p ≤ 700 mTorr. The applied tailored voltage waveforms are obtained by using a maximum of four consecutive harmonics of a given fundamental harmonic frequency 5 MHz ≤ f1 ≤ 15 MHz.
Before presenting the systematic study of the discharge characteristics under amplitude asymmetry and slope asymmetry conditions, we show the effect of varying the α parameter (the value of which is more uncertain than most of the other input data used in the model) on the spatio-temporal distribution of the dissociative excitation rate resulting from PIC/MCC simulations in comparison with excitation rates obtained via PROES measurements.
In figure 3 in the first row the phase-resolved excitation rate of the O(3p3P) excited state, derived from the plasma emission measured by PROES, is presented for peak-type voltage waveforms generated based on equation (1) for different numbers of harmonics, N = 1, 2, and 3 in the first, second, and third column, respectively. The gas pressure is p = 200 mTorr, the fundamental frequency is f1 = 13.56 MHz, the peak-to-peak voltage is  = 150 V. For these conditions, various discharge characteristics have been previously studied in [26]. In the next rows, the PIC/MCC simulation results on the spatio-temporal distribution of the dissociative excitation rate (reaction 15 in table 1) are displayed. This process corresponds to the dominant formation channel of the O(3p3P) excited state under these conditions. The simulations are performed for the discharge conditions of the experiments shown in the first row. Five different values of α are used:
  (second row),
  (third row),
  (fourth row),
  (fifth row), and
  (sixth row). We note that we have performed simulations for higher values of α, up to
  , but the excitation patterns were found to be almost identical to those found for
  . The plots show one period of the fundamental driving frequency (
 ), the spatial position x = 0 corresponds to the powered electrode, while the grounded electrode position is at x = 2.5 cm. The sheath edge positions, obtained from the simulations based on the criterion of Brinkmann [53], are shown as white lines in the simulation plots.

Figure 3. Phase-resolved excitation rates of the O(3p3P) excited state obtained from PROES (first row). PIC/MCC simulation results on the spatio-temporal distribution of the dissociative excitation rate for different values of α:  (second row),
  (third row),
  (fourth row),
  (fifth row), and
  (sixth row). Both experimental and simulation results are displayed for different numbers of harmonics: N = 1 (first column), 2 (second column) and 3 (third column), peak-type waveforms. p = 200 mTorr,
  = 150 V, f1 = 13.56 MHz,
  . The sheath edges obtained from simulations are shown as white lines. The color scale is in arbitrary units.
Download figure:
Standard image High-resolution imageIn the first row, a transition of the discharge operation mode from DA- to a hybrid α-DA mode can be observed as the number of harmonics, N, is increased from 1 to 3 in the experiments. For N = 1 the plasma emission is most significant in the bulk plasma. At N = 2 significant excitation can be also found near the edge of the expanding sheaths, especially at the side of the powered electrode. At times of sheath expansion at the powered electrode side, the plasma emission shows two maxima, situated near the sheath edges at both sides, corresponding to the sheath expansion and the sheath collapse, respectively. During the sheath expansion at the grounded electrode side of the plasma the plasma emission is significantly weaker. This asymmetry becomes even more significant for N = 3, where strong excitation is only present near the edge of the sheath at the powered electrode, and only during the expansion phase of it. Comparison of these experimental results to those obtained from simulations by varying the α parameter from  to
to  (rows 2–6 of figure 3) shows that the measured plasma emission patterns are generally best described by simulations performed for
  . For the lower values of the surface quenching probability of oxygen singlet delta
  molecules considered here, α-mode electron heating, and consequently excitation near the expanding sheath edges, is enhanced, which results in deviation from the experimental results especially for low values of N. Using higher values of α (above
  ) in the simulations, the DA-mode electron heating and related excitation in the plasma bulk and at the collapsing sheath edge are enhanced, leading to differences between measured and calculated distribution of the excitation rate for high N. These results represent further confirmation of the correct choice of the α surface destruction probability of oxygen singlet delta
  molecules in [26] and support the use of this value for α in the present work.
3.1. Amplitude asymmetry
In order to study the AAE in O2 plasmas, driving voltage waveforms of the form given by equation (1), with voltage amplitudes according to equation (2) are used. Three different fundamental frequencies, f1, are studied (5, 10, and 15 MHz), considering single-(N = 1), dual-(N = 2), triple-(N = 3), and quad-(N = 4) frequency cases at each value of f1. The phase shifts of all the odd harmonics are set to zero, while for all the even harmonics the phase shifts are set to π, resulting in valleys-type voltage waveforms (see figure 1(a)). The peak-to-peak voltage is kept constant at  = 400 V for all cases. The neutral gas pressure is set to p = 150 mTorr. Study of the effect of the gas pressure on the excitation dynamics is also carried out for three harmonics (N = 3) by performing measurements and simulations at 50 mTorr as well as at 700 mTorr.
Figure 4 shows the spatio-temporal distribution of the excitation rate of the O(3p3P) excited state derived from PROES measurements ( ) and compared to the rate of dissociative excitation obtained from PIC/MCC simulations (
 ). Different values of the base frequency are used: f1 = 5 MHz, 10 MHz, and 15 MHz, in parts I, II and III, respectively. In each part of figure 4, the experimental results are presented in the first row, while the simulation results are shown in the second row for different numbers of harmonics: N = 1 (first column), 2 (second column), 3 (third column), and 4 (fourth column). All plots show the whole gap between the powered electrode (x = 0 cm) and grounded electrode (x = 2.5 cm) for one period of the given fundamental frequency (
 ). The sheath edge positions are shown as white lines in the simulation plots. The spatio-temporal distributions of the electric field obtained from the simulations for the above conditions are displayed in figure 5.

Figure 4. Spatio-temporal maps of the excitation rate obtained for different numbers of harmonics, N = 1 (first column), 2 (second column), 3 (third column), and 4 (fourth column), valley-type waveforms The base frequencies are f1 = 5 MHz, 10 MHz, and 15 MHz, in parts I, II and III, respectively. In each part, the first row shows experimental data derived from PROES measurements, while in the second row PIC/MCC simulation results are presented. p = 150 mTorr,  = 400 V, and
  . The powered electrode is located at x = 0, while the grounded electrode is at
  . The sheath edges obtained from simulations are shown as white lines. The color scale is in arbitrary units.
Download figure:
Standard image High-resolution image
Figure 5. Spatio-temporal maps of the electric field obtained from PIC/MCC simulations for different numbers of harmonics N = 1 (first column), 2 (second column), 3 (third column), and 4 (fourth column), valley-type waveforms, for different values of the base frequency, f1 = 5 MHz (first row), 10 MHz (second row), and 15 MHz (third row). p = 150 mTorr,  = 400 V, and
  . The powered electrode is located at x = 0, while the grounded electrode is at
  . The color scales (one specified for each f1) are given in 103 Vm−1.
Download figure:
Standard image High-resolution imageThe agreement between the spatio-temporal distribution of the excitation rates obtained from the experiments and those from simulations is very good. The patterns of the plasma emission observed experimentally are well reproduced by simulations for all three values of the fundamental frequency as the applied voltage waveform is changed by increasing the number of harmonics, N. However, the emission is somewhat more widely spread across the gap in the experimental results compared to the simulations. At the lowest fundamental frequency studied here (f1 = 5 MHz), for N = 1, strong excitation in the plasma bulk is observed. The excitation rate is maximal near the edge of the collapsing sheaths, i.e. the discharge operates in DA-mode. We note the presence of a second local excitation maximum in the bulk when the sheath collapses at either electrode. This specific excitation profile is caused by electrons accelerated by significant electric fields in the bulk plasma. Several local maxima of the electric field in the plasma region can be seen in the spatio-temporal maps of the electric field obtained from simulations for f1 = 5 MHz fundamental frequency in the first row of figure 5. Such spatio-temporal structure in the electric field and striations in the ion production rate have been recently reported for electronegative CF4 plasmas in [54]. For N = 2 at f1 = 5 MHz, unequal maxima of the excitation rates are found at the collapsing sheath edges, with stronger excitation at the side of the grounded electrode. Further increase of N leads to strong excitation at the collapsing sheath edge at the powered electrode, while at the grounded electrode the excitation maximum shifts from the collapsing sheath edge to the expanding sheath edge. Thus, at this low frequency of 5 MHz, the discharge operation mode changes from the DA-mode to a hybrid α-DA mode as the number of harmonics is increased.
At 10 MHz, for N = 1 the discharge operates in DA-mode with strong excitation at the collapsing sheath edges. With 2 harmonics, excitation can be observed at both sides. During sheath expansion at the grounded electrode side, the excitation is significantly stronger compared to the powered electrode side. Under these conditions the discharge operates in α-DA mode. For  , the discharge operates in pure α-mode characterized by strong excitation at the grounded electrode side. Similar behavior of the excitation dynamics is found for 15 MHz, the highest fundamental frequency studied here: while the discharge operates in α-DA mode at N = 1, increasing the number of harmonics enhances excitation at the grounded electrode during sheath expansion at that side, leading to pure α-mode operation of the discharge. These transitions of the discharge operation mode are well confirmed by the spatio-temporal distributions of the electric field under these conditions (shown in figure 5, second and third rows): for 10 MHz high electric field in the plasma bulk can be seen for N = 1 and 2, while for 15 MHz a high electric field outside the sheath is found only in the case of N = 1. At 15 MHz, for
  , the plasma series resonance effect [55] is also observed.
In figure 6 the effects of the number of harmonics in valley-type voltage waveforms on the DC self-bias,  ion flux at the electrodes, mean ion energy at the electrodes, and electronegativity of the discharge are presented for different fundamental frequencies. In panel (a) normalized values of the DC self-bias,
  , obtained experimentally and from PIC/MCC simulations are plotted. The low values of η measured for N = 1 (
 ) prove that the experimental setup is nearly symmetrical. For
  a positive DC self-bias is formed as a result of the amplitude asymmetry. η increases with increasing the number of harmonics, both in simulations and experiments. The experimental trends are well reproduced by simulations, even the higher values of the self-bias obtained for the lowest fundamental frequency for
  , compared to the values obtained for higher fundamental frequencies. However, differences between the calculated and measured values of the DC self-bias are found, the values obtained from simulations being higher by a factor of up to 1.73. The highest value of η is obtained at 5 MHz for N = 4 (
 = 27% in the experiment, compared to
  = 42% in the simulation). For
  , the DC self-bias decreases as the fundamental frequency is increased. This is in agreement with previous findings for electronegative CF4 discharges [27], where the absolute value of the negative DC self-bias, obtained for peaks-type voltage waveforms for N = 4 and constant amplitude asymmetry, becomes much larger for lower base frequencies.

Figure 6. (a) Normalized DC self-bias,  , obtained experimentally and from PIC/MCC simulations, (b)
  ion flux and (c) mean ion energy at the powered and grounded electrodes, and (d) the electronegativity of the discharge as a function of the number of driving harmonics, N, valley-type waveforms, for different values of the base frequency, f1 = 5, 10, and 15 MHz. p = 150 mTorr and
  = 400 V.
Download figure:
Standard image High-resolution imageIn figure 6(b) the simulated  ion flux at the powered and grounded electrodes is shown. The flux of ions is higher at the grounded electrode compared to the powered electrode and increases with increasing N, except with a 5 MHz base frequency, where a slight decrease of the ion flux is observed as the number of harmonics is increased. At 15 MHz, the ion flux can be tuned by a factor of 1.5 and 3.5 at the powered and grounded electrodes, respectively, by changing N. At 10 MHz the ion flux remains nearly constant at the powered electrode, while it changes by a factor of about 1.8 at the grounded electrode by increasing the number of harmonics from 1 to 4; at 5 MHz a small change (by a factor of about 0.7) is seen at both electrodes by varying N. The mean ion energy can also be controlled by varying N (see figure 6(c)): an increase by a factor of about 2.5, and a decrease by a factor of about 1.8 can be achieved at the grounded and powered electrode, respectively, by increasing N.
Figure 6(d) shows the electronegativity of the discharge, obtained from the simulations. At 5 MHz the electronegativity increases (from 30 to 45) as N is increased from 1 to 4. At 10 and 15 MHz, the discharge is highly electronegative at N = 1 (with electronegativity of 55 and 42, respectively). With increasing N, a strong decrease of the electronegativity is induced (to 6 at 10 MHz, and to 0.5 at 15 MHz). This change of the electronegativity at 10 and 15 MHz reflects the change of the discharge operation mode discussed above: in case of low electronegativity the discharge operates in α-mode, while at high values of the electronegativity α-DA mode is found.
The effect of gas pressure on the excitation patterns is illustrated in figure 7. In the first row the experimentally observed excitation rate of the O(3p3P) excited state (derived from the 844.6 nm PROES measurements) are displayed, while in the second row the rates of dissociative excitation obtained from the simulations are plotted, for f1 = 15 MHz. Three different pressures are investigated: 50 mTorr (first column), 150 mTorr (second column), and 700 mTorr (third column), for three harmonics (N = 3); the peak-to-peak voltage amplitude is 400 V in all cases. For all pressures, the excitation maxima occurs at the grounded electrode side. Strong excitation is observed in front of this electrode during sheath expansion. Further excitation at the powered electrode side is seen near the expanding sheath edge, which is enhanced at higher pressures, but remains significantly lower compared to the excitation at the grounded electrode side. Under these conditions excitation induced by electrons near the expanding sheath edge is dominant, thus the discharge operates in the α-mode. However, at the highest pressure (700 mTorr) excitation in the bulk is also observed in the experimental results, but this is not observed in the simulations.

Figure 7. Spatio-temporal maps of the excitation rates obtained from PROES measurements (first row) and PIC/MCC simulations (second row) for different pressures p = 50 mTorr (first column), 150 mTorr (second column), and 700 mTorr (third column), valley-type waveforms, f1 = 15 MHz, N = 3,  = 400 V, and
  . The powered electrode is located at x = 0, while the grounded electrode is at
  2.5 cm. The color scales are given in arbitrary units in the first row, while in 1019 m−3 s−1 in the second row. The sheath edges obtained from simulations are shown as white lines.
Download figure:
Standard image High-resolution image3.2. Slope asymmetry
The SAE in O2 plasmas is studied here using the driving voltage waveforms given by equation (3). The same discharge conditions are investigated as for the preceding AAE study: three different fundamental frequencies (f1 = 5, 10, and 15 MHz) are considered and up to four harmonics ( ) are used at each fundamental frequency, f1. Equation (3) is used here with positive sign to generate voltage waveforms with sawtooth-down shape (see figure 1(b)). The peak-to-peak voltage is kept constant at
  = 400 V for all cases. The neutral gas pressure is set to p = 150 mTorr. A study of the effect of the gas pressure is carried out for N = 3 by performing measurements and simulations at 50 and 700 mTorr.
Figure 8 shows the distribution of the excitation rate of the O(3p3P) excited state compared to the rate of dissociative excitation obtained from PIC/MCC simulations. Different values of the base frequency are used: f1 = 5 MHz, 10 MHz, and 15 MHz in parts I, II and III, respectively. In each part of the figure, in the first and second rows the experimental and simulation results are shown, respectively. Results obtained for different numbers of harmonics are plotted: N = 1 (first column), 2 (second column), 3 (third column), and 4 (fourth column). All plots show one period of the given fundamental frequency ( ). The sheath edge positions are shown as white lines in the simulation plots. The spatio-temporal distributions of the electric field obtained from the simulations for the above conditions are displayed in figure 9.

Figure 8. Spatio-temporal maps of the excitation rates obtained for different numbers of harmonics N = 1 (first column), 2 (second column), 3 (third column), and 4 (fourth column), sawtooth-down type waveforms. The base frequencies are f1 = 5 MHz, 10 MHz, and 15 MHz, in parts I, II and III, respectively. In each part the first row shows experimental data derived from PROES measurements, while in the second row PIC/MCC simulation results are presented. p = 150 mTorr,  = 400 V, and
  . The powered electrode is located at x = 0, while the grounded electrode is at x = 2.5 cm. The sheath edges obtained from simulations are shown as white lines. The color scale is in arbitrary units.
Download figure:
Standard image High-resolution image
Figure 9. Spatio-temporal maps of the electric field obtained from PIC/MCC simulations for different numbers of harmonics N = 1 (first column), 2 (second column), 3 (third column), and 4 (fourth column), sawtooth-down type waveforms, for different values of the base frequency, f1 = 5 MHz (first row), 10 MHz (second row), and 15 MHz (third row). p = 150 mTorr,  = 400 V,
  . The powered electrode is located at x = 0, while the grounded electrode is at x = 2.5 cm. The color scales (one specified for each f1) are given in 103 V m−1.
Download figure:
Standard image High-resolution imageThe agreement between the measurements and the simulations is very good, especially for the lowest fundamental frequency (f1 = 5 MHz). However, even at higher f1, the main features of the observed plasma emission are well reproduced by the simulations for all N. At f1 = 5 MHz, for N = 1, the discharge operates in DA-mode. High electric fields are observed in the bulk plasma region (see figure 9, first row) which are created to ensure current continuity for low electron density conditions, inducing significant excitation in the bulk plasma and at the collapsing sheath edges. Similarly to the case of O2 discharges driven by valley-type voltage waveforms generated by using a low fundamental frequency of 5 MHz (see previous section), specific distributions of the bulk electric field and spatial striations in the excitation rates are also found here. Increasing the number of harmonics leads to stronger excitation at the powered electrode side compared to the grounded electrode sheath at times of sheath collapse at both electrodes (N = 2). For  the excitation is mainly concentrated near the powered electrode collapsing sheath edge. Therefore, at f1 = 5 MHz, the discharge operation mode is not changed when the number of harmonics is increased for the sawtooth voltage waveforms under the conditions studied here, and the DA-mode is dominant for all N. However, the excitation maximum vanishes at the grounded electrode side as N is increased, and strong excitation builds up at the powered electrode side.
At 10 MHz, for N = 1 the discharge operates in the DA-mode with excitation maxima at the collapsing sheath edges. Increasing the number of harmonics to 2, excitation at the expanding sheath edge at the grounded electrode is generated, with strong excitation at the powered electrode at the same time. Therefore, the discharge operates in hybrid α-DA mode. Further increase of N enhances the excitation near the expanding grounded electrode sheath (N = 3) and the α-mode becomes dominant at N = 4. In this case excitation is also generated at the powered electrode during sheath expansion. In agreement with these findings, a high electric field is observed in the plasma bulk (figure 9, second row) for low N, while at high values of N the electric field is low in the bulk. A similar scenario is seen at f1 = 15 MHz (see figure 8, part III, and figure 9, third row), where the transition from α-DA mode to α-mode takes place at lower N.
In figure 10 the DC self-bias,  ion flux at the electrodes, mean ion energy at the electrodes, and electronegativity of the discharge are presented as a function of the number of harmonics at different fundamental frequencies. Normalized values of the DC self-bias,
  , obtained experimentally and from PIC/MCC simulations are plotted in panel (a) of figure 10. The experimental and simulation results are in good agreement. For f1 = 5 MHz, a positive DC self-bias is formed for all N; η increases with increasing N up to 3, followed by a decrease of η at N = 4. Similar trends were seen in CF4 discharges excited by sawtooth-down waveforms at 5.5 MHz base frequency, where a small decrease in the DC self-bias is observed when increasing N from 3 to 5 [33]. The dependence of the DC self-bias on N for f1 = 10 MHz is similar to that observed for f1 = 5 MHz. However, at this higher base frequency η changes sign and drops below 0 for N = 4. For f1 = 15 MHz, negative DC self-bias values are obtained, and η decreases with increasing N.

Figure 10. (a) Normalized DC self-bias, η, obtained experimentally and from PIC/MCC simulations, (b) ion flux and (c) mean ion energy at the powered and grounded electrodes, and (d) the electronegativity of the discharge as a function of the driving harmonics, N, sawtooth-down type waveforms, for different values of the base frequency, f1 = 5, 10, and 15 MHz. p = 150 mTorr and  = 400 V.
Download figure:
Standard image High-resolution imageFigure 10(b) shows the  ion flux at the powered and grounded electrodes obtained from the simulations. The flux of ions is higher at the powered electrode, except for a 15 MHz base frequency, where the ion flux is slightly higher at the grounded electrode for
  . At f1 = 5 MHz the ion flux remains nearly constant at the powered electrode as N is increased, while the mean ion energy decreases by a factor of about 1.4 (figure 6(c)). At the grounded electrode the ion flux increases by a factor of about 4.5 as N is increased from 1 to 4 at f1 = 5 MHz, while the mean ion energy remains nearly constant. Such separate control of the ion properties is not possible at higher f1: at 10 MHz only small changes in the ion flux and mean ion energy are induced at both electrodes by changing N; at f1 = 15 MHz both the ion flux and mean ion energy increases by increasing N.
In figure 10(d) the electronegativity of the discharge is shown as a function of N for different fundamental frequencies. For f1 = 5 MHz, the electronegativity increases from 31 to 47 as N increases from 1 to 4. For f1 = 10 MHz, the electronegativity decreases from 56 to 37 with increasing N. In case of f1 = 15 MHz, increasing N causes the electronegativity to drop from 40 at N = 1 to 7 at N = 4. At high electronegativity, the discharge operates in the DA-mode: at f1 = 5 MHz, where the discharge is highly electronegative for all N, excitation occurs in the bulk and at the collapsing sheath edge (figure 8, part I); for f1 = 10 MHz and 15 MHz, a transition from DA- to the α-mode can be observed as the electronegativity of the discharge decreases with increasing N (figure 8, part II and III).
Figure 11 presents the effect of the gas pressure on the spatio-temporal excitation. The experimental results are shown in the first row, while in the second row the rates of dissociative excitation obtained from the simulations are plotted for N = 3 and f1 = 10 MHz at three different pressures: 50 mTorr (first column), 150 mTorr (second column), and 700 mTorr (third column). The peak-to-peak voltage amplitude is 400 V in all cases. The agreement between the simulations and the experiment is acceptable, with a significant difference appearing between the excitation patterns only at the highest pressure (700 mTorr), where an excitation maximum at the powered electrode side is seen in the experiment, while in the simulation the strongest excitation is located in front of the grounded electrode. At 50 mTorr, the discharge operates in the DA-mode and strong excitation at the powered electrode collapsing sheath edge is found. At the higher pressure of 150 mTorr, the excitation maximum is shifted to the grounded electrode side. Strong excitation in the plasma bulk and at the collapsing sheath edge are also found. Under these conditions the discharge operates in a hybrid α-DA mode. At the highest pressure studied here (700 mTorr) excitation due to both α- and DA-modes are found.

Figure 11. Spatio-temporal maps of the excitation rates obtained from PROES measurements (first row) and PIC/MCC simulations (second row) for different pressures, p = 50 mTorr (first column), 150 mTorr (second column), and 700 mTorr (third column), sawtooth-down type waveforms, f1 = 10 MHz, N = 3,  = 400 V, and
  . The powered electrode is located at x = 0, while the grounded electrode is at
  2.5 cm. The color scales are given in arbitrary units in the first row, while in 1019 m−3 s−1 in the second row. The sheath edges obtained from simulations are shown as white lines.
Download figure:
Standard image High-resolution image
4. Summary
We have performed a systematic investigation of low-pressure capacitively coupled oxygen discharges driven by customized voltage waveforms both experimentally and by PIC/MCC simulations. Pulse-type (peaks/valleys) and sawtooth-type voltage waveforms were used to study the AAE as well as the SAE. The discharges studied are operated in the 50–700 mTorr pressure range. The driving voltage waveforms comprised the sum of up to four consecutive harmonics of a given fundamental frequency. Three different base frequencies were studied, 5, 10, and 15 MHz. The effects of the number of harmonics, the fundamental frequency, and the gas pressure on the discharge electron heating mode, the excitation dynamics and the degree of control of the ion properties at the electrodes were investigated for both types of voltage waveforms.
Experimental data on the DC self-bias and spatio-temporal excitation rates, derived from PROES measurements, were compared to simulation results. The measured spatio-temporal distributions of the excitation rate of the O(3p3P) excited state are well reproduced by the simulations except at the highest pressure of 700 mTorr, where in case of sawtooth-down type waveforms the excitation is maximal at the powered electrode side in the experiment, while in the simulation the strongest excitation is located in front of the grounded electrode. Transitions of the discharge electron heating mode from the DA-mode to the α-mode were found by changing the number of consecutive harmonics included in the driving voltage waveform or by changing the gas pressure. The number of harmonics in the customized waveforms was found to have a strong effect on the electronegativity of the discharge, on the generation of the DC self-bias and the degree of control of ion properties at the electrodes for both pulse-type, and sawtooth-type driving voltage waveforms.
At the lowest fundamental frequency of 5 MHz the discharge remains strongly electronegative for all cases studied. For higher values of the fundamental frequency the electronegativity decreases strongly as the number of harmonics is increased. With a fundamental frequency of 5 MHz the electron power absorption and excitation due to the DA-mode is dominant independent of the number of harmonics, whereas for 10 and 15 MHz a transition from the DA-mode or hybrid combination of α-DA mode is found as N is increased. When an amplitude asymmetric waveform is used, independent control of ion properties can be achieved at the powered electrode for 5 and 10 MHz base frequencies by changing the number of harmonics: the ion flux remains nearly constant, while the ion energy changes by a factor of 1.8. With a slope asymmetric waveform at 5 MHz the ion flux at the powered electrode is almost independent of N, while the mean ion energy decreases by a factor of about 1.4. At the grounded electrode the ion flux increases by a factor of about 4.5 as N is increased, while the mean ion energy remains nearly constant.
We investigated the effect of varying the surface quenching coefficient of  on the spatio-temporal distribution of the dissociative excitation rate. Comparison of the simulation results to the excitation rates obtained via PROES measurements shows that the measured plasma excitation patterns are well described by simulations performed for
  . This represents further confirmation of a suitable choice of the surface quenching probability of oxygen singlet delta
  molecules in [26] and supports the use of this value for α also in the present work. Therefore, in the simulations the surface quenching probability of oxygen singlet delta
  molecules was fixed at
  . We note that keeping α constant for all discharge conditions covered in this study is probably an oversimplification. As we obtained good agreement between simulation and experiment for most cases, we decided not to vary this parameter, even though using a different value for α at high pressures would have been justified.
Acknowledgments
This work was supported by the Hungarian National Research, Development and Innovation Office (NRDI Office) via grants 119357 and PD-121033. This work was performed within the LABEX Plas@par project, and received financial state aid managed by the Agence Nationale de la Recherche, as part of the programme 'Investissements d'avenir' under the reference ANR-11-IDEX-0004-02 and ANR project CleanGRAPH (ANR-13-BS09-0019). Support through the UK EPSRC (EP/K018388/1) and the York-Paris Low Temperature Plasma Collaborative Research Centre is also acknowledged.