
Abstract
For strong central heating the interdependency of the particle and energy balances is invoked to show that the particle source required for steady-state conditions is related to the power deposition through the ratio of particle to energy fluxes. Consequences of this relationship for high-performance plasmas in the Wendelstein 7-X (W7-X) stellarator are investigated for long-pulse scenarios in which only electron cyclotron resonance heating is employed. If neoclassical transport is predominant in the core region, as is demonstrated to have been the case for comparable plasmas in the previous experiment, Wendelstein 7-AS, then hollow density profiles are shown to be inevitable in W7-X given the expected recycling properties of the device and the refueling capabilities of the present pellet-injection system.
Export citation and abstract BibTeX RIS

Original content from this work may be used under the terms of the Creative Commons Attribution 3.0 licence. Any further distribution of this work must maintain attribution to the author(s) and the title of the work, journal citation and DOI.
1. Introduction
The Wendelstein 7-X (W7-X) experiment was conceived and designed with the explicit goal of demonstrating the reactor potential of the advanced stellarator concept [1]. Ultimately, this will entail the development of high-performance operational scenarios under (quasi-) steady-state conditions. High performance is used here as a synonym for maximization of the fusion triple product of plasma density, ion temperature and energy confinement time,  , and is a self-explanatory goal of fusion research. The capability of a power reactor to provide the grid with a continuous source of electricity is also a considerable advantage and steady-state operation of W7-X without the need of induced or externally driven plasma currents is envisioned as an actual demonstration of the advantages that stellarators offer in this regard compared with tokamaks.
'Steady-state' electron cyclotron resonance heating (ECRH) of W7-X plasmas is provided by ten gyrotrons, each of which has been specified to provide 1 MW of continuous-wave power over a time interval of 1800 s, which is far in excess of all time scales relevant for plasma performance and operation of the device. The gyrotron frequency of 140 GHz is resonant at the second harmonic for a magnetic field strength of B = 2.5 T with cutoff densities of nc = 1.2 × 10²⁰ m−3 for waves with extraordinary-mode (X2) polarization and 2nc for ordinary-mode (O2) polarization. At these densities and for W7-X plasma volumes of ∼30 m3 the collisional transfer of energy from electrons to ions should be excellent so that Ti ≈ Te can be expected even without a direct means of heating ions.
An additional argument for high-density operation is provided by the favorable influence it is seen to exert on the energy confinement time in stellarators [2]. Indeed, it would appear that high density must be considered a prerequisite for high performance in W7-X but this will also pose challenges for steady-state scenarios heated solely by ECRH. Unlike neutral beam injection (NBI) heating, ECRH provides the plasma with no source of particles so that high-performance scenarios will likely require an independent means of replenishing the central density as neutral recycling and gas puff will be effective only for refueling the periphery of high-density plasmas. For stellarators, such a situation is further complicated by the lack of any physical mechanisms known to cause a 'particle pinch'—without an ohmic current there can be no Ware pinch and thermo-diffusive (temperature gradient driven) particle transport is directed radially outwards in all neoclassical regimes of relevance [3].
This paper provides an assessment of the difficulties that must be overcome to achieve density-profile control in high-performance W7-X plasmas heated solely by ECRH. It begins in section 2 by invoking the interdependency of the particle and energy balances to demonstrate that the particle source required to maintain steady-state conditions is related to the power deposition through the ratio of particle to energy fluxes when strong central heating is applied. Thus, central heating without central particle sources is only possible if the central particle fluxes become vanishingly small and it is shown that this will require hollow density profiles to counteract thermo-diffusion if neoclassical transport is assumed predominant within the core region of W7-X. The relevance of neoclassical transport for understanding experimental results in stellarators is then demonstrated in section 3 by revisiting an 'optimum confinement' discharge at the previous Wendelstein device, W7-AS, where neoclassical thermo-diffusion is shown to provide an explanation for the 'ECRH pump-out' observed in such plasmas. The implications for W7-X are investigated by means of predictive 1D transport simulations, beginning in section 4, where it is verified that central heating will require central particle sources if flat density profiles are to be maintained. In section 5 it is demonstrated for high-performance W7-X plasmas that such particle sources cannot be expected from recycling or by pellet refueling with the available blower gun. In section 6 these realistic particle sources serve as input to further 1D transport simulations, which confirm that hollow density profiles appear unavoidable for high-density operation. Consequences for the W7-X experimental program, especially during its early years, are provided in the conclusions in section 7.
2. Theoretical background
In the equations for the particle balance
and the energy balance
it is widely recognized that a first-principles description of the transport leads to a particular relationship between the particle (Γ) and energy (Q) flux densities but the resulting consequences for the particle (S) and energy (P) sources are often overlooked. Both balance equations have essentially the same form, however, with the divergence of a flux balanced by a source (in steady state) so that if the fluxes are related in a particular fashion, it should come as no great surprise that the sources must also be related. The determination of these relationships and their implications for high-performance stellarator plasmas is the topic of this section.
With regard to the remaining notation in the two balance equations, α is the species index (with e used for electrons and i denoting ions), n is the density, T is the temperature, V is the volume enclosed by the flux surface with label r and the prime denotes differentiation with respect to r. It should also be noted that particle and energy sinks are accounted for within S and P. For example, separated into individual contributions, one has

where Pheat is the heating power, Pex describes the power gain/loss by collisional energy exchange among species and Ploss denotes the power losses due to radiation and charge exchange. The remaining term quantifies the power gain/loss of the species with charge q due to its particle flux in the presence of a radial electric field, Er. As a final word of note, the flux densities are expressed in s−1 m−2 and W m−2 so that the source terms have units of s−1 m−3 and W m−3, respectively.
The balance equations allow one to draw certain conclusions concerning the relationship of fluxes and sources even without detailed knowledge of the transport processes. This is best illustrated by considering the combined energy balance which, for a pure hydrogen plasma, has the steady-state form
where  is the 'total' energy flux density and
  is the 'net' power density available to the plasma; to obtain this expression use has been made of the obvious
  along with the ambipolarity constraint, Γe = Γi = Γ. Additionally, a dimensionless ratio of flux densities is introduced
and by substituting this definition into the combined energy balance and also making use of the steady-state particle balance, one then obtains
It is instructive to assess the relative magnitudes of the two terms appearing on the right-hand side of this equation. The first term is largest in regions with significant power deposition; assuming centralized plasma heating with a uniform power density over the region r < rx allows a simple 'geometric' approximation  to be made within this region—thus, values exceeding 10 m−1 will not be unusual. The second term is the logarithmic radial gradient of the ratio of energy to particle fluxes. In the plasma core, terms of this type can typically be ordered as a fraction of a−1 so that for W7-X plasmas of radius
  m its value should reach at most 1 m−1 (although substantiation of this claim will require knowledge of the transport mechanisms). Thus, when the assumed ordering holds,
  in steady state and as the
  terms will generally be small throughout the plasma core it follows, for cases in which the ratio of flux densities varies little, that the shapes of the particle-source and power-deposition profiles must be nearly identical.
Unlike NBI heating, which unavoidably couples sources of energy and particles, there are few options that will allow fulfillment of such a requirement in high-performance plasmas heated solely with ECRH. A primary candidate for particle refueling is the injection of frozen hydrogen pellets into the plasma, a method employed at a number of tokamaks and at the Large Helical Device (LHD) [4], a stellarator of the heliotron type. For pellet injection, the particle deposition profile is influenced by the mass of the pellet and by its velocity but central refueling cannot be expected for devices the size of LHD or W7-X. Highly localized refueling is likewise impossible as pellets undergo ablation continuously over the course of their trajectory. This inability to either centralize or localize the particle sources from pellet injection may be compensated for, at least to a degree, by applying some portion of the heating off-axis so as to broaden the ECRH power-deposition profile. Otherwise, lacking an independent means of providing the plasma core with a source of particles, the only recourse is to accept S = 0 in this region while simultaneously demanding a combination of transport coefficients and thermodynamic forces, which also makes Γ negligibly small. The ramifications of this necessity are investigated in the remainder of this section, assuming the predominance of stellarator neoclassical transport throughout the plasma core.
Neoclassical theory provides a first-principles description of plasma transport relating radial fluxes to the thermodynamic forces that cause them. For stellarators it is a standard assumption that strong rotation of the plasma is impossible due to the unavoidable viscosity arising from trapped particles. This allows linearization of the drift kinetic equation assuming the distribution function deviates little from a local Maxwellian at rest in the laboratory frame. If the transport processes are also taken to be radially local then the number of thermodynamic forces is limited to only three—the radial electric field and the gradients of density and temperature—and the neoclassical particle and energy flux densities,  and
and  , respectively, may be expressed in the form [5]
where the Lij are the (thermal) transport coefficients that are obtained from differently weighted energy convolutions of the single 'mono-energetic' coefficient D
where  is the normalized kinetic energy. Thus, the K dependence of D fixes the relationships among the different Lij, a fact which underscores the coupling of particle and energy transport within the neoclassical theory. Conventional terminology refers to L11 as the neoclassical diffusion coefficient,
  as the neoclassical thermo-diffusion coefficient and
  as the neoclassical energy diffusivity. The notation used throughout this section is taken from a special-topics paper on neoclassical transport in stellarators [5] with the exception that D is used here in place of D11 as the other two mono-energetic transport coefficients are of no relevance to the radial transport in the stellarator long-mean-free-path regime, making the use of indices superfluous here.
As the energy dependence of D directly influences the relative magnitudes of the Lij, it is worthwhile at this point to briefly summarize results from the theoretical literature in this regard for high-temperature stellarator plasmas. To do so it is sufficient to consider a simple heuristic description of random-walk diffusion processes,  where
where  is the fraction of particles participating in the process, Δr is the characteristic step size of such particles and νeff is the frequency with which a step is taken. In the present case, for which the transport is due to pitch-angle scattering, one can replace the 'effective' step frequency with
  where ν is the collision frequency appearing in the Lorentz collision operator, so that the heuristic expression becomes
  , leaving only Δr and
  to be determined for the cases of interest.
As in other stellarators, the variation of magnetic field strength over the flux surfaces of W7-X leads to significant regions of phase space in which particles with small parallel velocity will find themselves trapped in local ripples of B. Unlike the case of tokamak banana orbits, the radial drift velocity of such 'localized' particles does not time average to zero over their (nearly) periodic bounce motion and the assumption of radially local transport used in deriving the drift kinetic equation remains warranted only if the poloidal  precession frequency of localized particles, ΩE, is sufficiently large to circumscribe the deviation of their drift surfaces from flux surfaces or if collisions are frequent enough to limit the time particles remain localized by scattering them out of the ripples. In the latter case, the characteristic step size of the random-walk process is Δr = vd/νeff, where
  is the magnitude of the radial drift velocity with R0 the major radius of the torus and B0 the average magnetic field strength. The fraction of particles comprises those that are localized but this depends only on the topology of B and not on the particle energy and can therefore be ignored here, leading to
  [6]. Where this result holds, particles are said to be in the '1/ν regime', an obvious reference to the scaling with collision frequency. Taking the energy dependence of this frequency to be well approximated by ν ∝ K−3/2 leads to a mono-energetic transport coefficient scaling as
  .
.
For Te ≈ Ti the electron collision frequency is nearly two orders of magnitude larger than that of the ions, implying a massive imbalance in particle fluxes if both species are assumed to be in the  regime. Intrinsic ambipolarity does not hold for neoclassical transport in magnetic fields lacking an ignorable coordinate and a radial electric field must appear to suppress the ion transport, largely by reducing their characteristic step size to Δr = vd/ΩE, where ΩE = Er/(rB0). Collisions may still be responsible for particles entrapping in and detrapping from local ripples but in stellarators the trapping state can also change due to particle drifts and two different results arise depending on which of these processes is assumed to dominate. When collisions have the upper hand, localized particles within a collisional 'boundary layer' of relative width
  make up the fraction of participating particles and the '
 regime' is the result with
  [6]. When trapping and detrapping occurs due to particle drifts the fraction of such 'transition' particles is a largely geometric quantity and one obtains
  , which is referred to as the 'ν regime' [7].
At the conclusion of this brief summary of theoretical results concerning neoclassical transport in stellarators it should be recalled that reduction of such transport was an explicit goal of the W7-X optimization [8]. This was achieved with a magnetic field topology that significantly reduced the geometrical factors associated with the three regimes described above but which did not affect the physical mechanism responsible for the transport. For example, the value of 'effective' ripple for 1/ν transport,  eff [9, 10], is small compared with the local variation of B for W7-X but the K7/2 dependence of 1/ν transport is unaffected by the optimization.
Although the energy convolution performed in calculations of the Lij will invariably lead to a 'mixture' of results from different regimes, it is nevertheless instructive to consider the idealized limits obtained by assuming only a single regime contributes to the integral. Under such an assumption the normalized (by L11) transport coefficients appearing in Γneo and Qneo
will have purely numerical values as the Lij all share identical geometrical factors. Having the K dependence of the mono-energetic transport coefficient in terms of a power law allows use of the so-called gamma function to determine δij and its values may be found in table 1 for all regimes of importance in stellarators [3], with the plateau regime included as it may be of relevance to the calculation of the Lij for small K. Note for each of these regimes that the value of δ12 is identical with the exponent characterizing the energy dependence of D and that all values are positive so that neoclassical thermo-diffusion in stellarators will be directed outwards (assuming a negative temperature gradient) regardless of the individual regime or the combinations thereof. A negative value of δ12, and thus, a thermo-diffusive particle 'pinch', will arise only if the mono-energetic transport coefficient is a decreasing function of kinetic energy, as, for example, occurs for the tokamak banana regime with D ∝ K−1/2 due to a characteristic step size given by the banana width, Δr ∝ K1/2, and a banana fraction that is a purely geometric quantity. The  values for the banana regime have been included at the bottom of table 1 but are highlighted with gray shading to emphasize the fact that they are of no relevance for describing neoclassical transport in stellarators.
Table 1. Normalized transport coefficient values for regimes of relevance to stellarator neoclassical theory. For comparison, results of the tokamak banana regime are also given, distinguished by gray shading to emphasize that this regime does not exist in stellarators.
| Regime | δ12 | δ21 | δ22 |
|---|---|---|---|
| Plateau | 3/2 | 3 | 15/2 |
| 1/ν | 7/2 | 5 | 45/2 |

|
5/4 | 11/4 | 99/16 |
| ν | 1/2 | 2 | 3 |
| Tokamak banana | −1/2 | 1 | 1/2 |
As was already stated above, the neoclassical radial particle fluxes are not intrinsically ambipolar for stellarators so that the ambipolarity constraint  must be solved to determine the radial electric field established within the plasma. Taking ne = ni = n but allowing for different electron and ion temperatures yields the result
where e is the elementary charge. As was also noted above, the ion transport coefficients are functions of the radial electric field so that this equation is of little use for actually determining Er and, instead, one must resort to root-finding techniques [11]. The expression can nevertheless be put to use here by substituting it into the neoclassical radial particle-flux densities to obtain
Assuming predominant neoclassical transport in the stellarator core one must then have a density profile satisfying
to achieve vanishingly small particle flux in this portion of the plasma and thereby obviate the need for particle sources in this region. In the limiting case of a high-performance plasma with Te = Ti = T this simplifies to
so that for 1/ν electrons and  ions the ratio of the logarithmic gradients of density and temperature must have the value of −19/8, which implies not only a hollow density profile but a hollow pressure profile as well. Even taking the ions to be in the more favorable ν regime yields a ratio of −2, which represents only a marginal improvement.
Substituting the ambipolar radial electric field into the expression for the neoclassical energy flux density, one can also determine this quantity under the conditions of vanishingly small neoclassical particle flux density. This is found to have a surprisingly compact form
in which only the transport coefficients and the temperature gradient of the species in question appear. Examining the entries in table 1, one notes that δ22/δ21 − δ12 = 1 in all regimes so that this expression simplifies yet further to  . This result is at least somewhat encouraging as it demonstrates that significant radial energy transport will occur in the core of stellarators even when the radial particle transport is negligibly small in this portion of the plasma. The consequences this has for high-performance W7-X plasmas heated with ECRH will be demonstrated here in sections 4 and 6.
3. Evidence of neoclassical transport in W7-AS experiments
The expectations for predominant neoclassical transport within the core of high-performance W7-X plasmas are due to the particle and energy confinement observed at the previous Wendelstein stellarator, W7-AS [12], in experiments with central densities in excess of 5 × 10¹⁹ m−3 and central temperatures exceeding 1 keV for both electrons and ions. These discharges have been given the sobriquet 'optimum confinement' in the literature [12, 13] as they also exhibit energy confinement times more than a factor of two larger than expected from empirical scaling laws [14], thereby possessing all the ingredients necessary for attractive high-performance scenarios. In this section, a sequence of such discharges is revisited, the vagaries of which may be used to offer an explanation for so-called 'ECRH pump-out' (also referred to as 'density clamping') [12, 15] in terms of neoclassical thermo-diffusion, thereby providing further evidence that neoclassical theory is of relevance to understanding W7-AS experimental results.
In the published literature, the results revisited here appear under the designation of W7-AS shot #34609 [16], although this particular number should be understood as a generic label for the set of 'identical' discharges belonging to the series #34595–#34611. Series of this type were a necessity at W7-AS as measurements of the ion temperature and radial electric field—using neutral particle analysis (NPA) and charge-exchange recombination spectroscopy (CXRS) to detect signals produced with a diagnostic neutral beam injector—were possible at only one radius during a single discharge so that radial profiles of these quantities required multiple shots.
For this series of discharges, a W7-AS configuration with a rotational transform value of  was chosen having very little vacuum shear. The average magnetic field strength was approximately 2.5 T to provide second-harmonic resonance for ECRH at 140 GHz and a vertical field of Bz = 0.026 T was used to shift the plasma column inwards so that the outer flux surfaces of the configuration were intercepted by a set of graphite limiters. The particle and heat fluxes to the limiters provided for an effective conditioning of these plasma-facing components and for the 0.5 s discharges of this series the recycling coefficient assumed values well below one. This 'low recycling' led to small values of the edge density with the density profile becoming rather narrow and exhibiting steep gradients over the outer half of the plasma radius. Discharges were initiated using X2-polarized ECRH of a single gyrotron to ionize a small amount of seed gas, after which a density ramp was undertaken with a strong gas puff of 3.5 × 10²¹ particles per second for 50 ms and, during this period, the heating was increased by the addition of three NBI sources. Subsequently, gas was supplied in much smaller amounts with the goal of establishing a constant line-integrated density of
  by feedback control using interferometer measurements along a chord of approximately 0.5 m passing through the plasma minor axis as actuator. This value of line-integrated density was the strict upper limit for optimum confinement discharges as it led to core ne slightly in excess of 1020 m−3 and thus uncomfortably close to the X2 cutoff density of 1.2 ×10²⁰ m−3. The target value of
  was achieved 200 ms into the discharge and steady-state conditions were established before an additional 100 ms had elapsed, by which time the gas-puff rate had dropped to the level of 1020 particles per second. Thomson scattering was available at W7-AS for measuring profiles of ne and Te and employed a 20-channel 'single-shot' system, with the sole measurement of the electron density profile for this series of discharges taken at t = 300 ms during this steady-state phase. This is also the time point at which the transport analysis given in figure 5 of reference [16] was performed. In addition to the Thomson measurement, Te profiles are also available at 10 ms intervals from the 24 channels of the electron cyclotron emission (ECE) diagnostic following a time average of signals at each ECE frequency during this period.
The magnetic field strength produced by the nonplanar coils of W7-AS exhibited a rather complex topology, possessing numerous secondary minima within a single field period; for examples, see figure 8 of reference [12] showing contour plots of B for different flux surfaces of two W7-AS configurations. Accounting for this complexity in calculations of the neoclassical transport coefficients made the use of numerical methods mandatory, and the Drift Kinetic Equation Solver (DKES) [17, 18] was used to prepare data sets of the three mono-energetic transport coefficients needed to determine the neoclassical radial fluxes and parallel flows [5]. The mono-energetic coefficients are functions of the flux-surface label, collisionality and normalized radial electric field so that a DKES data set must typically comprise several thousand individual calculations if it is to adequately cover the experimentally relevant parameter range for a given equilibrium. During the last decade of the 20th century, the preparation of such complete data sets was prohibitively expensive in computational resources and their number consequently very small. It was therefore common practice to 'scale' these existing results when calculations for W7-AS equilibria lacking a complete data set were needed. This was done by comparing a handful of low-collisionality DKES runs with Er = 0 for the case of interest with those of the 'most similar' existing data set and fixing the ratio of these results for D as the factor used for scaling purposes. For the present example, a data set for a vacuum field with  but with Bz = 0 was used for performing the transport analysis with the inward shift accounted for by a scaling factor somewhat less than one at all plasma radii.
While use of such a scaling factor allows an accurate description of the 1/ν electron transport, it cannot be said to provide the same for ions in the  or ν regimes. Fortunately, at the present time, creation of a DKES data set no longer represents a major computational investment and is possible in somewhat more than 24 h for W7-AS equilibria on a typical computer cluster even if a premium is placed on accuracy by choosing a large number of Fourier–Legendre harmonics for the DKES test functions so as to reduce the variational bounds on the results at low collisionality. As a first step in reassessing W7-AS shot #34609, it is therefore appropriate to calculate anew the neoclassical radial particle and energy fluxes using a data set prepared expressly for the equilibrium of this discharge at t = 300 ms and repeat the comparison with experimental results first undertaken in reference [16]. This comparison is given in the plots of figure 1 with results for electrons shown in red and those for ions in blue. Thomson scattering measurements of the electron density and temperature are depicted using filled-in circles and ECE values of Te are shown as diamonds. Measurements of the ion temperature from NPA and CXRS are shown by squares and triangles, respectively. With the exception of CXRS, these diagnostics provide 'full' radial profiles of the measured quantities—that is, measurements are taken over the entire plasma cross section, and the appropriate flux-surface label is calculated for a specified equilibrium given the diagnostic's line(s)-of-sight. The profile fits to the experimental data that were used for neoclassical calculations are given by curves in the plots of ne and Tα with comparisons of the theoretical and experimental particle and energy fluxes given in the second column. For the particle flux a single plot suffices as the contribution from impurities is assumed negligibly small and ambipolarity then dictates that electron and ion particle fluxes be identical. This is not the case for the energy fluxes, however, and the electron and ion contributions are therefore depicted in separate plots. The ambipolarity constraint also provides a theoretical prediction for the radial electric field profile, which is shown in the Er plot by the x-chain and compared with measurements by active (filled-in circles) and passive (triangles) CXRS.
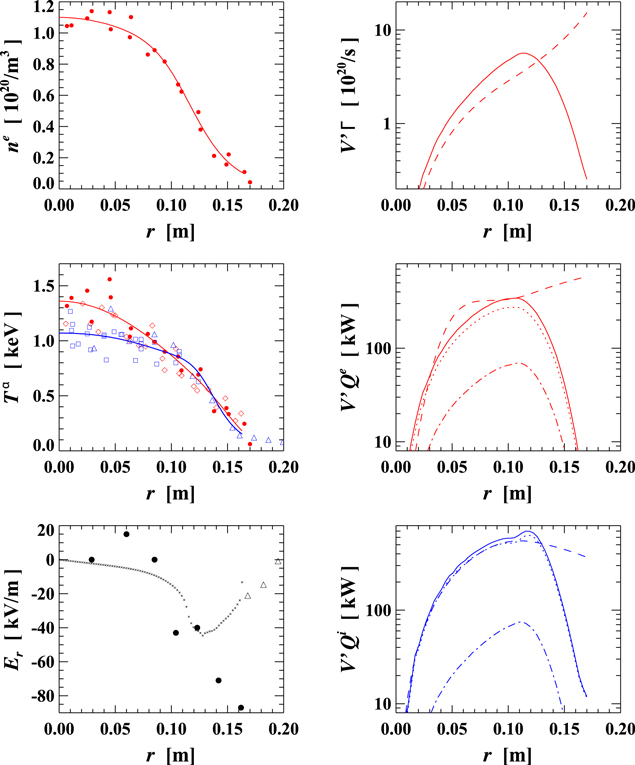
Figure 1. Results for a series of 'identical' W7-AS discharges that included shot #34609. Left column: symbols are used to depict experimental measurements of density, temperature (red for electrons, blue for ions) and radial electric field (see text for the diagnostic corresponding to each symbol); profile fits used for transport analysis are shown by continuous curves, Er from the ambipolarity constraint by the x-chain. Right column: comparison of experimental (dashed curve) and neoclassical (continuous curve) results for the particle flux and the energy fluxes of electrons and ions. The total neoclassical energy flux is the sum of  (dotted curve) and
  (dot-dash curve).
Download figure:
Standard image High-resolution imageThe particle and energy sources and sinks that were integrated to obtain the experimental fluxes are shown in figure 2. These are included here for completeness as they were not provided among the data of reference [16]. The adjective 'experimental' is somewhat misleading in this context, however, so that an explanation of how the sources and sinks were actually determined is warranted at this point. Particle sources were provided to the plasma by gas puff, recycling and neutral beam fueling. NBI fueling and heating of W7-AS plasmas were calculated using Monte Carlo techniques implemented in the FAFNER code [19]. Neutral beam injection was nearly tangential at W7-AS due to favorable access provided by enlarging the 'corner' nonplanar coil of each field period (see figures 4 and 7 of [12]). This provided rather long path lengths through the plasma (as much as 2.5 m), resulting in very low shine-through for high-density conditions. Given the full neutral particle energy of E0 = 45 keV for hydrogen, the ratios of E0, E0/2 and E0/3 species for the NBI sources, the beam-line geometry, the magnetic equilibrium and the plasma profiles, FAFNER calculated a birth profile of fast ions and then followed their orbits until thermalization or loss from the plasma. Losses were due to orbits leaving the plasma and fast-ion charge-exchange processes, the latter modeled assuming the neutral density varies only as a function of the flux-surface label. All three beam lines injected in the co-direction, which helped keep orbit losses small [20], especially as the plasma profiles prevented any significant contribution to fast-ion birth at outer radii. Losses due to fast-ion charge-exchange processes, on the other hand, were quite significant. Unfortunately, the FAFNER results do not separate power sources and sinks but a 'net' ion heating power of 500 kW was calculated along with  kW and a particle source of 3.05 × 10²⁰ s−1 and these numbers can only be reconciled by charge-exchange losses of approximately 300 kW. Such a large value was by no means unusual at W7-AS, where, in extreme cases, fast-ion charge-exchange losses could be as large as half the injected power [14]. The ECRH provided an additional 330 kW to the electrons with the power-deposition profile determined by ray tracing. Radiative losses of 210 kW were measured by bolometers at the time point of the transport analysis and the effective charge state of the plasma was estimated to have the value
  . The radiation profile of figure 2 was calculated assuming losses largely due to line radiation of iron with an additional mixture of carbon and oxygen impurities added to obtain the observed value of Zeff. Recycling was calculated numerically with EIRENE [21] for the plasma conditions of interest and the code results were then calibrated to the experimental situation using Hα observations of one of the limiters and a portion of the stainless steel vacuum vessel. The calibration was also adjusted to account for the particle source due to gas puff, which is considered an acceptable approximation as long as the gas-puff contribution remains a small portion of the total. The energy loss due to charge exchange of the recycling neutrals is also calculated in the course of EIRENE simulations but is negligible for the plasma parameters of such discharges.
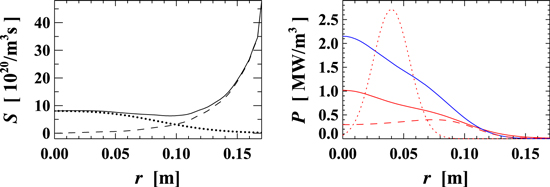
Figure 2. Particle and energy sources and sinks for W7-AS shot #34609. The particle sources are from NBI fueling (dotted curve) and recycling (dashed curve); their sum is given by the continuous curve. NBI power to electrons and ions is shown by continuous curves (red for electrons and blue for ions), the ECRH power deposition is given by the red dotted curve and the radiated power by the red dashed curve. Ion power loss due to fast-ion charge-exchange processes has been accounted for but is not plotted separately due to the bookkeeping employed by FAFNER.
Download figure:
Standard image High-resolution imageIt should be noted that the comparisons of neoclassical and experimental results for the particle and energy transport given in figure 1 have been plotted in units of s−1 and kW (and thus as fluxes and not as flux densities), respectively, so as to conform with the depiction of results in reference [16]. In what follows, the particle and energy flux densities will be modeled by sums of neoclassical and 'anomalous' contributions

where the 'an' subscript denotes quantities associated with the latter. In steady state, the neoclassical particle flux as a function of the flux-surface label, r, is then simply  , whereas two terms contribute to the total neoclassical energy flux
  and these two have been plotted both collectively and individually in figure 1. The experimental fluxes (denoted with subscript: exp) have been calculated by radial integration of the sources and sinks
where the power gain/loss due to qαΓαEr is calculated from the experimental value determined for the particle flux density and the value of the radial electric field obtained from the ambipolarity constraint.
Cursory examination of figure 1 shows that the neoclassical particle and energy fluxes match their experimental counterparts well for  m but underestimate the transport considerably at the outermost radii; an identical conclusion was reached for this series of discharges in the earlier analysis [16]. Undertaken in greater detail, comparison shows that even the quantitative differences in the present and previous results are quite small. For example, having the full DKES data set for the appropriate equilibrium leads to a neoclassical particle flux that is ∼10% larger than that of the previous calculation using a scaled data set. The neoclassical energy fluxes are increased by a similar amount although a portion of this increase is due to the inclusion of the small
  contribution that was ignored in the previous results. An additional term included here but neglected previously is the power exchange among species caused by Er that appears in the experimental energy fluxes (and was mentioned at the end of the previous paragraph). This term is of negligible magnitude for radii of r < 0.1 m in the present analysis but is responsible for the moderate increase (decrease) of the electron (ion) energy flux which occurs in the plasma periphery.
Before concluding this comparison, one peculiarity of this series of discharges should also be mentioned and its influence on the analysis elucidated. As not uncommon at W7-AS, deuterium was used as the working gas for all shots of this series but NBI heating was performed with hydrogen so as to minimize neutron production. The differing locations of the particle sources—largely central for hydrogen and almost exclusively at the periphery for deuterium—must lead to different density profiles for the two species but experimental documentation of this difference is lacking. Fortunately, this ignorance introduces only a rather small uncertainty into calculations of the neoclassical fluxes as the electrons are the rate-controlling species for these discharges (meaning that the radial electric field lowers ion particle transport to the electron level). The collisionality of electrons is, to a very good approximation, independent of the ion mass so that their neoclassical transport coefficients are unaffected by the relative amounts of hydrogen and deuterium in the plasma. As a consequence, the neoclassical electron fluxes are altered only to the degree that the value of Er needed to satisfy the ambipolarity constraint is modified. Calculating these fluxes for the limiting cases in which the bulk ion species is either pure deuterium or pure hydrogen, one finds at most a 10% difference in Γneo and a 5% difference in Qeneo, with both neoclassical fluxes larger for deuterium at flux surfaces with r < 0.11 m. The ion mass is of greater consequence for Qineo due to its influence on the ion collisionality and due to the Er dependence of Liji but, nevertheless, the relative difference in ion energy flux is at most 40% (and is typically closer to 20%), again with larger values in the plasma interior for pure deuterium. The neoclassical results plotted in figure 1 have been calculated for an atomic mass number of 1.5 so as to depict an 'average' of the two limiting cases. The uncertain ratio of hydrogen isotopes in these discharges is also not expected to be of significance for the particle and energy balances, at least not in the plasma core. The EIRENE calculation of the particle source due to recycling neutrals was performed assuming a pure deuterium plasma and, although recycling hydrogen would penetrate somewhat more deeply into the plasma, the consequences for core refueling remain negligible compared with the particle source from NBI. FAFNER calculations were also performed for a pure deuterium plasma but this assumption has no influence on the NBI fast-particle birth profile and little effect on subsequent collisional processes so that the particle and power sources from neutral beam heating are largely unaffected by a mixture of hydrogen isotopes. In the energy balance the collisional energy exchange between ions and electrons scales inversely with the ion mass but also linearly with the temperature difference, Ti − Te, so that the total power transferred from electrons to ions is small in the present analysis regardless of the mixture of hydrogen isotopes.
Although the adjective 'identical' has been used to describe all shots of the W7-AS series #34595–#34611, such a characterization applies only to the initial 400 ms of these discharges. Typically at this time point either the NBI or the ECRH was switched off, leaving only the remaining system for plasma heating during the last 100 ms of the discharge. Loss of density control was observed in this final phase for the shots lacking ECRH, signified by a slow, but steady increase in the line-integrated density over the entire 100 ms, even though feedback control had promptly closed the gas valve once the target value of  had been exceeded. Such behavior was not at all unusual at W7-AS, where loss of density control was the rule for plasmas heated solely by NBI when Pheat ≳ 700 kW [14], a restriction which was not overcome until the discovery of the HDH-mode (high-density H-mode) [22]. Beyond the closing of the gas valve, a further reduction of the particle source at the plasma periphery after ECRH switch-off was indicated by a drop in the Hα intensity at the limiter of roughly 10%. The loss of density control in spite of the reduction in recycling and also turning off the external gas feed argues strongly for a significant reduction in the particle transport once ECRH is no longer heating the plasma.
The time evolution of the Te profile during this final phase in such discharges is available from the ECE diagnostic and an example of such data is provided here in figure 3 for the shot #34601. The ECE antenna in W7-AS was situated so as to view the plasma from the low-field side of the toroidal symmetry plane having flux surfaces of (roughly) elliptical shape. In this figure the full radial profile is plotted with the frequencies of the ECE channels decreasing from left to right; negative values of r are thus to the inboard side of the plasma minor axis while positive values are on the outboard side. The ECE profile at  , 50 ms before the ECRH is switched off, is shown using red circles; the profile fit to the Te data of figure 1 is also plotted to provide corroboration that this electron temperature profile is very similar to the one used for the transport analysis of this series of discharges. After ECRH has been switched off the central values of Te are reduced, thereby flattening the core temperature profile, as shown by the ECE measurements taken at t = 0.45 s and plotted using blue diamonds. One notes, however, that the reduction in Te is more pronounced for the ECE channels on the outboard side of the plasma so that the ECE profile becomes unusually (and unexplainably) asymmetric in the vicinity of the plasma axis. At outer radii the lack of ECRH has far less impact making only modest reductions in the values of Te without any appreciable change in the gradient. The third profile, plotted with black squares, was taken at t = 0.49 s, just before the end of the discharge, and presumably depicts a situation in which the density exceeds the cutoff value for several of the central ECE channels.
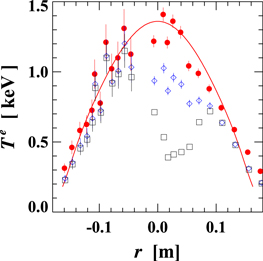
Figure 3. ECE profiles of the electron temperature for W7-AS shot #34601 at t = 350 ms (red circles), t = 450 ms (blue diamonds) and t = 490 ms (black squares); measurement uncertainties are indicated by 'error bars' when these extend outside the symbols. The Te fit at t = 300 ms from figure 1 is shown by the red curve for reference.
Download figure:
Standard image High-resolution imageGiven that the core transport observed in this series of W7-AS shots conforms with the expectations of neoclassical theory during the steady-state portion of the discharges, it is logical to ask whether this theory will also provide an accurate description of experimental results during the final phase in which the density control is lost. A possible explanation is easily found. Central power deposition to electrons is reduced substantially when ECRH is terminated so that central values of Te fall and their profile flattens. Both effects diminish the neoclassical particle flux of electrons, the former due to the T7/2 dependence of all 1/ν transport coefficients, the latter responsible for an additional reduction of the thermo-diffusive contribution to  . Any change in electron particle transport is crucial as electrons are the rate-controlling species and the radial electric field must respond so as to maintain ambipolarity by decreasing
  . If this reduction of neoclassical particle flux is sufficient to prevent exhaust of the NBI particle source then loss of density control is the likely result.
Although plausible, such an explanation accounts only for profile effects that reduce the central particle transport while ignoring any counteracting increase in Γ that would arise if strong central peaking of the density profile were to result. As the time evolution of the density profile could not be ascertained with the W7-AS diagnostics, the expected temporal behavior will instead be simulated here using the predictive version of the 1D transport code NTSS [23, 24]. This numerical tool will be used throughout the remainder of this paper and the full set of equations it can deal with is presented at the beginning of the next section. For the moment, however, it is sufficient to state that NTSS determines density and temperature profiles by solving the particle and energy balances while simultaneously enforcing the ambipolarity constraint to obtain the Er profile. The model chosen to describe the radial transport in this simulation is given by equation (3) with the neoclassical transport coefficients determined using the same DKES data set employed for the neoclassical analysis of figure 1. In this manner, the time evolutions of Γneo and  —due to changes in n, Tα and Er—are properly accounted for, neglecting only the influence of small changes to the equilibrium. Radial profiles of the anomalous diffusion coefficient, Dan, and the anomalous energy diffusivities,
  , are chosen so as to reproduce the experimental fluxes observed during the steady-state portion of the discharge (i.e. those of figure 1), with the additional requirement that the anomalous contributions to all fluxes become negligibly small for flux surfaces with r < 0.1 m. Values of the anomalous transport coefficients determined in this manner are held fixed during the course of the simulation so as to limit, as far as possible, the influence of transport in the plasma periphery on the results. It should be evident that this model has been designed so as to test the hypothesis that termination of ECRH and the consequent changes in core neoclassical confinement provide an explanation for the temporal evolution of plasma observables during the final phase of these W7-AS discharges.
Although the model just described is formally without free parameters there are, nevertheless, inconsistencies associated with its straightforward application as it does not reproduce an exact solution to the balance equations during the steady-state portion of the discharge. This is indicated by the (small) differences in the theoretical and experimental fluxes within the core region that are noticeable in figure 1. In particular, the neoclassical particle flux exceeds its experimental counterpart throughout the region r < 0.1 m, which, in terms of the chosen model, implies that the central particle source has been underestimated and/or that Γneo has been overestimated. Any increase in S in this portion of the plasma would be difficult to justify, however, as the central particle source is almost exclusively provided by NBI for which both shine-through and fast-particle orbit losses are already at a minimum. In performing the NTSS calculations it will therefore be assumed that the particle and power sources determined with FAFNER are accurate and for simplicity these sources are held constant throughout the simulation. The particle source from recycling calculated by EIRENE is handled in an identical fashion. Additionally, no attempt will be made to 'adjust' the plasma profiles of figure 1 so as to reduce the differences between experimental and neoclassical fluxes, assuming these differences to be small in comparison to those that will arise once the 330 kW ECRH is switched off. Nevertheless, it is obvious that this choice will cause ∂n/∂t < 0 initially and thus delay, by some small amount of time, the density increase that is ultimately expected.
The NTSS results obtained with these assumptions are depicted in figures 4–5. In the first of these two figures, profiles for the density, temperatures and radial electric field are plotted at three different time points during the simulation, starting with the initial conditions at t = 400 ms (dashed curves) followed by the results at t = 450 ms (dotted curves) and concluding with those at t = 490 ms (continuous curves). The simulation commences with a reduction of the power source as the ECRH is discontinued. Given that the energy confinement time is approximately 25 ms for this discharge, the subsequent relaxation of the temperature profiles is largely complete after 2τE so that the similarity of the Tα profiles at this time point and 40 ms later is in accordance with expectations. Without the localized ECRH power deposition it is also no surprise that  is established throughout the entire plasma at these densities. The ne profile follows a different temporal evolution with the reduction of core particle transport leading mostly to a broadening of the profile during the first 50 ms of the simulation after which the density increases roughly uniformly for all radii with r < 0.1 m. A central peaking of the density profile does not occur at either time point. The changes in plasma profiles also lead to a considerable reduction in the magnitude of Er occurring on the τE time scale. Plotted at the upper right in figure 4 is the line-integrated density as a function of time and it will be noted that the slope of this curve is roughly constant throughout the course of the simulation. This result compares favorably with the interferometer measurements of
  during the final 100 ms of shot #34601, which were observed to increase linearly from 3.8 to 4.5 × 10¹⁹ m−2.
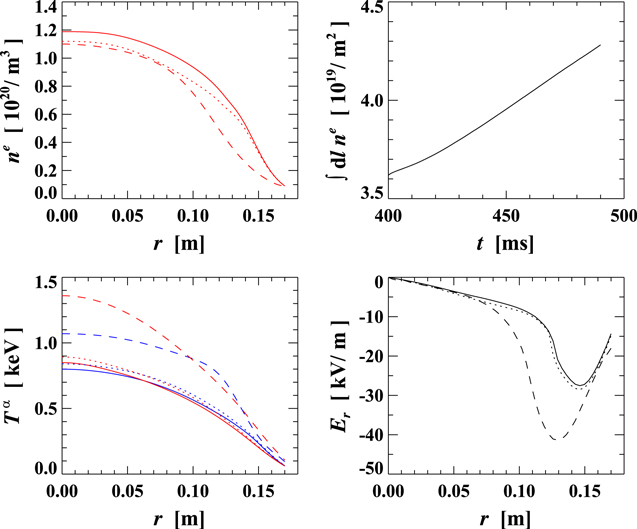
Figure 4. Profiles from NTSS for the density (upper left), temperature (lower left, with Te in red and Ti in blue) and radial electric field (lower right) at t = 400 ms (dashed curves), t = 450 ms (dotted curves) and t = 490 ms (continuous curves). Also shown is the temporal evolution of the line-integrated density (upper right) over the course of the simulation.
Download figure:
Standard image High-resolution image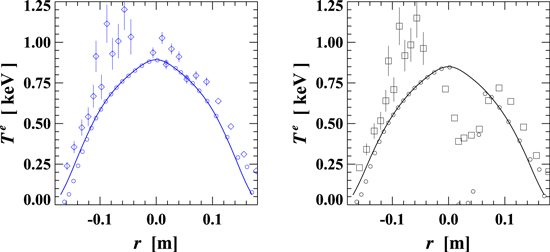
Figure 5. ECE measurements of Te at t = 450 ms (left) and at t = 490 ms (right) are compared with NTSS results at these two times (continuous curves). The symbols used to depict the ECE results are the same used in figure 3. Also shown by the small circles are the theoretical expectations for the ECE signals from ray tracing at these time points, assuming the NTSS density and temperature profiles.
Download figure:
Standard image High-resolution imageThe experimental Te profiles from ECE at t = 450 ms and at t = 490 ms are compared with NTSS calculations in figure 5. As was mentioned previously, in the first of these plots the central ECE channels exhibit considerable asymmetry in their radiated temperature values on either side of the magnetic axis. The NTSS results, shown by the continuous curve, provide a strong indication that the outboard ECE channels are more trustworthy at this time point as taking the central Te values from the inboard channels would maintain the  at nearly the levels observed during the earlier phase with ECRH and thus result in losses well in excess of the NBI heating power alone. Also shown by the small circles are simulated values of the radiated temperature obtained from standard ray-tracing approximations by applying TRAVIS [25] to the NTSS plasma profiles. None of the simulated ECE channels are in cutoff at this time point so that the TRAVIS calculations merely reproduce the Te profile determined by the transport code. This is no longer the case at t = 490 ms, however, as the central density has risen sufficiently by this time to place simulated outboard channels having r < 0.06 m into cutoff, corresponding well with the radial extent over which the actual electron cyclotron emission suffers the same fate (see the right-hand plot of figure 5). The NTSS simulation probably underestimates slightly the peak value of ne at this time point, however, as the TRAVIS results at r = 0 m indicate the cutoff density has yet to be reached at this radius whereas the corresponding ECE channel appears to have just exceeded this threshold. One notes again in this plot that the Te values obtained from the central inboard ECE channels exceed those of the NTSS simulation by a considerable amount, again implying a level of neoclassical energy flux that cannot be reconciled with the energy balance. Given the asymmetry observed in the central ECE values at t = 450 ms it can be conjectured that similar results would also be observed at this later time point if the outboard channels had not entered cutoff.
Admittedly, the experimental data that is available over the final 100 ms for this series of W7-AS optimum confinement discharges are not complete enough to allow a detailed comparison with the simulation results of NTSS. Nevertheless, concerning the loss of density control in the absence of ECRH, the modeling reproduces the experimental behavior rather well. First, both exhibit a nearly linear rise in the line-integrated density during this final phase, resulting in an increase of roughly 7 × 10¹⁸ m−2. Second, the radial extent over which electron cyclotron emission is predicted to experience cutoff corresponds well with that of the actual ECE channels, indicating an accurate modeling of the central density increase during the course of the simulation. The perplexing disparity of central Te values measured by inboard and outboard ECE channels is not understood but the inboard values appear suspect as they show only a small reduction of Te after the ECRH has been switched off (see figure 3). On the balance of evidence it would thus appear that neoclassical theory provides an accurate description of the experimentally observed transport during the final phase of these W7-AS optimum confinement discharges as well as during the previous steady-state phase. ECRH pump-out for such discharges may thus be largely attributed to neoclassical thermo-diffusion, some characteristics of which were pointed out in the previous section of this paper. And, while neoclassical thermo-diffusion proved beneficial for maintaining density control in W7-AS plasmas heated by a combination of ECRH and NBI, it will present difficulties in situations where the central particle source provided by NBI is lacking. Examples for high-performance W7-X scenarios are presented in the following section and in section 6.
Before leaving this section it should be noted that optimum confinement conditions were also realized in W7-AS after installation of an island divertor [26, 27] although the documentation of such discharges is not as complete as for the limiter plasmas revisited here. Steep density gradients over the outer third of the plasma were again observed although the positions of the principal recycling regions had been shifted to locations near the tips of strongly elongated plasma cross-sections, a situation which had not allowed optimum confinement in W7-AS plasmas bounded by a combination of top and bottom rail limiters. The divertor was also found to reduce the impurity content of the plasma with radiation losses falling to only 10% of the deposited heating power. This compatibility of optimum confinement and island divertor was not discovered until shortly before the end of the W7-AS experimental program but the assessment of whether such a combination can produce equally favorable results for W7-X will certainly receive considerable attention once operation with an island divertor commences in this device.
4. Predictive simulations with prescribed density profiles
The 1D transport code NTSS [23, 24] was described very briefly in the previous section. Some additional information concerning this numerical package is now provided, concentrating on points of relevance for the predictive simulations described in the remainder of this work. In the previous section, the particle and energy balances were the only differential equations solved as iterative root-finding was entirely sufficient for solving the ambipolarity constraint to determine the Er profile. More generally, however, NTSS solves the poloidal force balance
to determine the radial electric field. In this equation is the plasma permittivity and DE serves to fix the width of the transition layer which occurs when Er undergoes bifurcation at a radius for which more than one solution of the ambipolarity constraint exists. Solving a differential equation in such a case is advantageous from a numerical standpoint as it not only provides a unique solution for the radial electric field but also prevents unphysical 'jumps' in the value of Er at neighboring radii [28]. One notes, however, that the ambipolarity constraint is recovered when the left-hand side of this equation becomes vanishingly small.
NTSS also solves a fourth differential equation to allow an assessment of whether plasma currents are of relevance to the equilibrium
where ψp is the plasma-induced poloidal magnetic flux, σ∥ is the parallel electric conductivity, μ0 is the permeability of free space and Jcd and Jbs are the heating-driven and bootstrap current densities, respectively. This equation has little influence on the results presented in this paper, however, as plasma currents have been purposely minimized by using balanced heating scenarios so as to avoid any current drive and by choosing a W7-X configuration expected to have negligible levels of bootstrap current over the anticipated range of plasma parameters. Such a scenario reduces, as far as possible, the influence of the plasma currents on the equilibrium's rotational transform,  , so as to avoid altering the location of naturally occurring magnetic islands. This is of special relevance here as W7-X is a low-shear stellarator with N = 5 field periods and will therefore have islands of significant radial extent for integer values of M satisfying
  . Situating one such resonant value of the rotational transform at the plasma edge provides the basis for a so-called island divertor [29]—with M x-points channeling outward-flowing plasma to divertor regions where recycling and exhaust are to take place—but large islands within the plasma confinement region are to be avoided.
During the initial commissioning and operation phase of W7-X, from 10 December 2015 until 10 March 2016, outward-flowing particles and energy were intercepted by graphite limiters mounted on the inboard side of each of the device's five bean-shaped symmetry planes. Prior to the subsequent operational phase, which began in the second half of 2017, these limiters were replaced by an uncooled test divertor unit (TDU) and experimental efforts have been initiated to achieve high-performance plasmas in W7-X and to identify promising scenarios for later steady-state operation once the TDU has been replaced with an actively cooled high-heat-flux divertor (expected in 2020). As the numerical simulations presented here investigate a problem likely to arise already during the TDU phase, they have been performed with assumptions reflecting the operational conditions expected during this time. In particular, heating power has been limited to the conservative value of 5 MW, which is regularly available and the particle refueling by pellet injection has been simulated using the performance capabilities of the available blower gun and the two lines of flight foreseen for pellet launch.
Single-pass absorption of ECRH power is influenced both by the wave polarization and by the plasma parameters. At W7-X, the best results will occur with X2 heating for which the optical depth satisfies τ ≫ 1 even at modest values of electron density and temperature so that power absorption will approximate that of a black-body. For O2 polarization, however, τ ≈ 1 holds for the expected range of plasma parameters and single-pass absorption thus falls to a level between 50% and 80% for scenarios assuming that 10 MW of ECRH is launched into the plasma [30]. This makes it imperative to protect the inner vessel wall of W7-X, opposite to the ECRH launch position, and by doing so with an array of microwave reflectors it becomes possible to re-direct the unabsorbed power on a second pass through the plasma center while also maintaining mode purity. This scheme even foresees a third pass of the remaining power through the plasma following the subsequent reflection from a stainless steel panel. In spite of the benefits offered by such a multi-pass scheme, satisfactory power deposition with O2 heating will not be achievable unless the electron temperature of the plasma also exceeds a certain value. This is due to the fact that O2 power absorption increases quadratically with Te in the relevant parameter range but only linearly with ne. For the simulations performed here, the maximum value of unabsorbed ECRH power following three passes has been fixed at 1 MW in keeping with design specifications for the in-vessel components of W7-X, which must be able to withstand amounts of stray radiation consistent with this value.
The poor power absorption of O2 polarization at low electron temperature makes it unsuited for plasma start-up. Instead, X2 heating will be used initially to achieve sufficient values of Te in plasmas of moderate density before switching the polarization of the electron cyclotron beams to O2 and then taking steps to increase the density. The ECRH deposition will be altered substantially during the course of this process, first through equilibrium changes (principally the reduction of B due to the diamagnetic effect) and second due to the quite different optical depths of X2- and O2-polarized waves. For example, if on-axis power deposition with O2 heating is the final goal, one must initiate the discharge with X2 absorption localized far off-axis [31]. As the TDU has been designed for a maximum discharge energy of 80 MJ; this leaves a time period on the order of 10 s to achieve high-performance conditions in W7-X with 5 MW of heating.
As stated previously, the W7-X configuration chosen for simulations is one for which negligible bootstrap current is expected over the relevant range of plasma parameters. This configuration is quite similar to the one of reference [31] with  islands at the plasma edge to provide the divertor topology but with certain minor changes made to reduce the loss of plasma volume caused by non-zero plasma pressure, β. To be specific, the Pfirsch–Schlüter equilibrium currents are found to increase the size of
  boundary islands when VMEC [32] equilibrium calculations are augmented with results of EXTENDER [33], which uses the virtual-casing principle [34] to determine an equilibrium's influence on the magnetic field outside the last closed flux surface. Encroachment of the islands into the confinement volume has been limited here by a slight reduction of the rotational transform across the plasma cross section so as to recover confinement volumes in excess of 29 m3 (corresponding to an 'effective' plasma minor radius larger than 0.5 m). Taken alone, this decrease in
  would lead to a bootstrap current in excess of 10 kA, which is sufficient to displace the M = 5 x-points by an amount inconsistent with a proper functioning of the island divertor. This is counteracted here with a choice of W7-X coil currents producing a slightly larger toroidal-mirror harmonic in the Boozer-coordinate representation of B (b0,1 at the axis of the 'new' vacuum configuration is increased from 0.108 to 0.119; see [31] for a clarification of the notation) so as to return the bootstrap current to the negligible values (a few kA at most) obtained with the original configuration.
For the simulations presented below, NTSS again models the particle and energy flux densities using the model of equation (3) with the neoclassical losses determined from DKES data sets for appropriate equilibria and with the parallel flows corrected so as satisfy conservation of momentum [35]. It is widely accepted within the fusion community that micro-turbulence is an additional important cause of radial transport in toroidal devices; indeed, for tokamaks, turbulence-driven transport commonly dwarfs its neoclassical counterpart. Calculation of the turbulent transport in W7-X by numerical solution of a gyrokinetic equation is far too resource intensive to be of use in predictive 1D simulations, however, and simplified models coupling turbulent particle and energy transport have yet to emerge for stellarators. This is the reason for the rather crude description of anomalous losses chosen here for the modeling in which only an energy diffusivity, χan, and a diffusion coefficient, Dan, appear. In keeping with experimental observations made at W7-AS for plasmas heated solely with ECRH, χan is taken to be inversely proportional to density [36] with a value at the plasma edge of ∼1 m2 s−1 and the anomalous particle and energy transport are coupled by fixing Dan at some fraction of χan. It will also be assumed that the anomalous particle fluxes are intrinsically ambipolar, which is indeed the case for any such turbulence satisfying the gyrokinetic orderings [37, 38]. For this model the density gradient is the only thermodynamic force of relevance to anomalous particle transport—as in the case of stellarator neoclassical theory, lack of a central particle source will require the appearance of a hollow density profile for any steady-state solution of the balance equations. A thermo-diffusive contribution to the turbulent particle fluxes, as invoked to explain experimental observations in tokamaks [39], will not be considered here as an analytical basis for such an ansatz is lacking for stellarators and numerical results are still too scarce to provide any certainty whether such a contribution would be directed inwards or outwards [40]. Even if such a contribution were to be included it would only be of relevance to the simulation results at radii where it becomes comparable to (or exceeds) the neoclassical thermo-diffusive particle flux.
Effects due to plasma impurities will also be handled in a very simplified manner by assuming a hydrogen plasma with effective charge number of Zeff = 1.5 at all radii. Assuming fully ionized carbon as the only impurity, the ion densities are then given by  and nC = ne/60 and it becomes sufficient to solve the particle balance for electrons alone. Energy losses due to radiation are also easily determined as they are entirely due to bremsstrahlung. Additionally, a small reduction in the magnitude of Er occurs when carbon is accounted for in the ambipolarity constraint.
Simulation results are now presented for the high-mirror W7-X configuration described above by combining VMEC equilibrium and NTSS transport calculations in a self-consistent manner: for an initial VMEC equilibrium the DKES data set of mono-energetic transport coefficients is prepared and then used by NTSS to determine the pressure and current density profiles to be used in the subsequent VMEC calculation. This process is repeated until the profiles at consecutive steps remain unchanged, which is possible here with a single iteration due to the extremely small values of bootstrap current. For the simulations presented in this section the density profile has been chosen to match that of previous calculations [31] and is depicted in figure 6. With the density specified the particle balance may then be solved to determine the required particle-source profile. Given the discussion at the beginning of section 2, one will expect the shape of this particle source to coincide closely with that of the ECRH power-deposition profile, which NTSS calculates by making direct use of the TRAVIS ray-tracing code [25]. A first set of results is given in the plots of figure 7 for a scenario chosen to provide central power deposition of the O2-polarized electron cyclotron waves as depicted in the upper left-hand corner. The central power densities are sufficient in this example to provoke the appearance of the so-called 'electron-root' solution for Er [11] in the plasma core—this is indicated by plotting all three solutions of the ambipolarity constraint when multiple solutions exist (the electron root is most positive, the ion root is most negative and a thermodynamically unstable root lies between them), whereas the curve depicts the solution of the differential equation for Er. The electron root promotes peaking of the electron temperature, attaining a central value of 3.6 keV in this example, with the benefit of improved O2 absorption; of the 5 MW launched into the plasma only 250 kW remains unabsorbed after three passes. The temperatures of electrons and ions are nearly identical outside of the power-deposition region, indicative of the excellent collisional transfer of energy occurring at these densities. Comparison of the ECRH power-deposition profile with that of the particle source confirms their shapes are indeed nearly identical in the plasma core; an additional particle source is necessary in the plasma periphery to maintain the density gradient in this region.
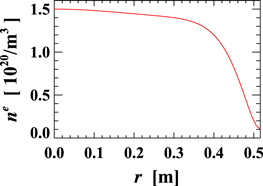
Figure 6. Electron density profile assumed for the two simulations described in this section.
Download figure:
Standard image High-resolution image
Figure 7. NTSS results are plotted for a simulation with on-axis ECRH assuming the density profile depicted in figure 6. Top row, left: deposition profile for O2-polarized ECRH. Top row, right: temperature profiles of electrons (continuous, red line) and ions (dashed, blue line). Middle row, left: particle source required to maintain the assumed density profile. Middle row, right: the radial electric field profile is given by the black curve while red dots indicate roots of the ambipolarity constraint. Bottom row: radial profiles of electron (left) and ion (right) transport coefficients used in the simulation with  given by the continuous magenta curves,
  by the dotted magenta curves,
  by the continuous light-blue curves,
  by the dotted light-blue curves, Dane by the continuous black curve and
  by the dotted black curves.
Download figure:
Standard image High-resolution imageRadial profiles of the neoclassical and anomalous transport coefficients for electrons and hydrogen ions are shown in the bottom row of figure 7. Note that the neoclassical coefficients have been plotted in the form  so as to make the various quantities in Γneo and Qneo multiplying the gradients of density (continuous curves) and temperature (dotted curves) easily comparable. For both species the neoclassical coefficients are larger in the plasma interior with the anomalous coefficients predominant only in the periphery. The ratio of
  has been set to 7.5 for these results which is consistent with the observation that the empirical ISS04 scaling law for the energy confinement time,
  , has dependences nearly identical to those of the plateau regime [41] (see the entry for δ22 in table 1).
Although the total bootstrap current for this simulation is only 2.7 kA, comparatively large net current densities of as much as −18 kA m−2 are reached in the plasma core. The Jbs profiles for this simulation and their influence on the rotational transform profile are plotted in figure 8. Although a small region of negative shear appears,  remains above the natural 5/6 resonance at all radii so that such an alteration is expected to be without harmful consequences. In the plasma periphery Jbs alters the rotational transform only slightly and will thus have negligible influence on performance of the island divertor.
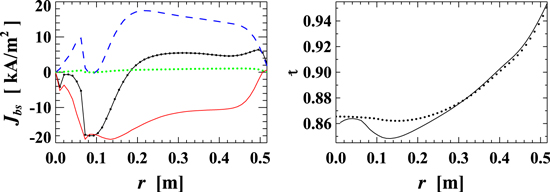
Figure 8. Profiles of the bootstrap current densities (left) and the rotational transform (right) are plotted for the simulation of figure 7. The total Jbs is given by the black continuous curve, which is the sum of electron (red continuous curve), hydrogen-ion (blue dashed curve) and carbon-impurity-ion (green dotted curve) contributions. The  profiles accounting for and neglecting Jbs are given by continuous and dotted curves, respectively.
Download figure:
Standard image High-resolution imageGlobal parameters of interest for this simulation include the volume-averaged plasma pressure of  , the energy confinement time of
  and the stored plasma energy of W = 2.55 MJ. The power loss due to bremsstrahlung amounts to
  kW.
kW.
Demands for a highly localized central particle source should be relaxed if the ECRH power deposition is broadened with substantial off-axis heating. This is illustrated by repeating the previous simulation but at a magnetic field strength reduced to 96% of its initial value. This choice shifts the power deposition of X2-polarized ECRH in the start-up phase towards the plasma axis while moving the later O2 deposition to the high-field side of the bean-shaped cross section. The O2 power-deposition profile is again included with the results for this simulation in figure 9 and peaks at a flux surface with r > 0.15 m. The required particle source in the plasma interior is again found to have a very similar shape, once more confirming theoretical expectations, although one notes that this source is far smaller than that necessary at the plasma periphery.

Figure 9. NTSS results are plotted for a simulation with off-axis ECRH assuming the density profile depicted in figure 6. Top row, left: deposition profile for O2-polarized ECRH. Top row, right: temperature profiles of electrons (continuous, red line) and ions (dashed, blue line). Middle row, left: particle source required to maintain the assumed density profile. Middle row, right: the radial electric field profile is given by the black curve while red dots indicate roots of the ambipolarity constraint. Bottom row: radial profiles of electron (left) and ion (right) transport coefficients used in the simulation with  given by the continuous magenta curves,
  by the dotted magenta curves,
  by the continuous light-blue curves,
  by the dotted light-blue curves, Dane by the continuous black curve and
  by the dotted black curves.
Download figure:
Standard image High-resolution imageThe broadened power deposition leads to a noticeable flattening of the temperature profiles attaining maximum values of T ≈ 2.2 keV for which the amount of unabsorbed ECRH power increases to 750 kW. This is the principal drawback of significant off-axis heating using O2 polarization and prevents the consideration of scenarios for which the power deposition is shifted yet further outwards. Plasma performance also suffers with global parameters reduced to  s and W = 2.19 MJ. Bremsstrahlung losses also fall to
  kW.
kW.
With off-axis deposition it is no longer possible to establish a core electron root and the ambipolarity constraint has only the ion root as a solution (see the Er profile). As a consequence, Jbs becomes very small in the plasma core and therefore has no effect on the rotational transform as depicted in figure 10. Indeed, although the total bootstrap current of 2.2 kA is but little different than that of the previous simulation, the quite different current density profiles makes alterations of the rotational transform barely discernible in this example.

Figure 10. Profiles of the bootstrap current densities (left) and the rotational transform (right) are plotted for the simulation of figure 9. The total Jbs is given by the black continuous curve which is the sum of electron (red continuous curve), hydrogen-ion (blue dashed curve) and carbon-impurity-ion (green dotted curve) contributions. The  profiles accounting for and neglecting Jbs are given by continuous and dotted curves, respectively.
Download figure:
Standard image High-resolution image5. Particle refueling
To maintain a flat density profile in a region of the plasma with substantial ECRH power deposition will thus necessitate provision of substantial particle sources in the same region (the total number of particles required for the examples of the previous section is roughly 5 × 10²⁰ per second) and it is natural to ask whether this can be achieved for high-performance W7-X plasmas. In keeping with the practice used elsewhere in this paper the options will be limited to those available to the experiment during the TDU phase and will therefore consider only recycling and pellet injection using a blower gun previously in operation at ASDEX Upgrade [42].
The particle source provided by recycling neutrals has been calculated using the EMC3-Eirene code package [43, 44]. As input the appropriate VMEC equilibrium is employed, augmented by EXTENDER results, to obtain the magnetic field outside the last closed flux surface. Geometry and location of all plasma-facing components must also be provided, most particularly for the divertor targets, the baffles and the vacuum vessel. The bulk plasma is described with density and temperature profiles obtained from NTSS simulations and slight variations thereof have also been considered. A sample of results is given in figure 11 for simulations in which 5 MW of power has been assumed to cross the last closed flux surface and enter into the scrape-off layer (SOL) for separatrix densities of  m−3 and 2 × 10¹⁹ m−3. These two densities are just below and just above, respectively, the separatrix density at which the transition from low to high recycling occurs in front of the divertor targets. This transition is clearly indicated by the higher densities and lower temperatures in the SOL region (reff > 0.51 m) of the
  m−3 results. (Note: reff is defined in the SOL region using the volume enclosed by the radial shells placed concentrically about the last closed flux surface, which EMC3 employs in constructing the mesh used for its numerical algorithm.) With regard to the present investigations these two examples are of particular interest as they yield the largest ionization sources for the bulk plasma since the neutral screening effects of the edge islands strengthen rapidly if nes is increased any further. Nevertheless, the number of recycling neutrals reaching inner radii of r < 0.25 m is at most 3 × 10¹⁹ per second and thus far below that necessary to maintain the density profiles assumed in the previous section.
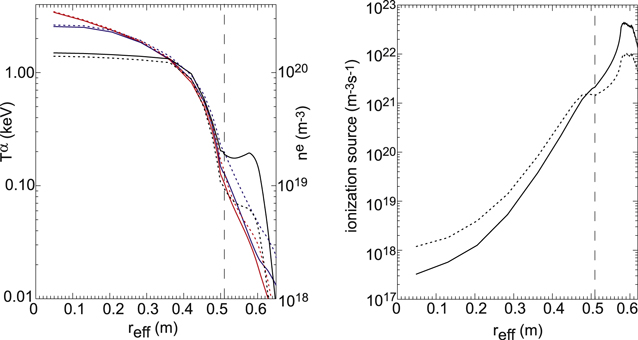
Figure 11. Results from EMC3-Eirene for a W7-X 'high-mirror' equilibrium with 5 MW crossing the last closed flux surface for separatrix densities of  m−3 (dotted curves) and 2 × 10¹⁹ m−3 (continuous curves). Profiles of density (black curves with values taken from the vertical axis at the right) and temperature (red curves for Te and blue curves for Ti with values taken from the vertical axis at the left) are given on the left and the particle source provided by recycling neutrals is shown on the right.
Download figure:
Standard image High-resolution imageParticle sources to be expected from the injection of frozen hydrogen pellets have been calculated for high-performance W7-X plasmas with a version of the HPI2 code [45, 46] capable of describing the drift of neutral gas shielded plasmoids (which form after the initial ionization of the pellet ablatant) in 3D magnetic fields. Such drifts are used to explain the experimental observation that net particle deposition is shifted inwards in tokamaks when pellet injection is switched from the low-field side (LFS) to the high-field side (HFS) of the device. Two ports are foreseen for pellet injection in W7-X during the TDU phase, one having positive ∇B along the pellet's line of flight and the other having negative. Employing tokamak terminology, these two options will be referred to here as LFS and HFS launch, respectively, but these designations should be understood in a qualitative sense, as shown in the left-hand side of figure 12. The launch geometry of the ports is such that the two lines of flight are not coplanar but both have nearest points of approach to the magnetic axis in planes with toroidal angle ϕ ≈ 232°. These planes have been chosen as the projection surfaces used in the figure, for which a number of flux surfaces and contours of constant  are also depicted for an equilibrium with
  . The deepening of the magnetic well with increasing plasma pressure is of particular relevance here as, taken alone, it amplifies the poloidal component of the ∇B drift of ions and electrons within the plasmoid and the resulting charge separation leads to an
  drift of the plasmoid towards the center of the plasma. HPI2 results for pellet ablation and the consequent particle deposition profiles accounting for all drift effects are plotted in the right-hand side of figure 12 for the two launch geometries. Cylindrical hydrogen pellets of 2 mm length and 2 mm diameter (containing ∼3 × 10²⁰ particles) with an injection velocity of 300 m s−1 have been assumed in accordance with the technical specifications of the blower gun [42]. For refueling purposes, HFS launch is seen to be more favorable although the particle deposition profiles are not significantly different due to the somewhat deeper pellet ablation obtained for LFS launch. In neither case, however, is significant particle deposition possible for r/a < 0.5 so that internal refueling is not to be expected with pellet injection unless some other mechanism, e.g. a plasma instability, brings the ablated material deeper into the core.
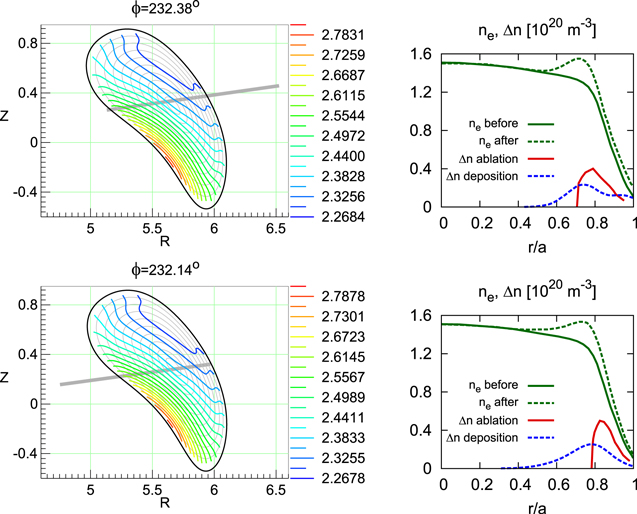
Figure 12. Lines of flight for pellet launch from LFS port AEK41 (top) and for HFS port AEL41 (bottom) are shown in gray. The coordinates used are cylindrical (R, ϕ, z) with origin at the point where the major axis intersects the symmetry plane. Also shown are nested flux surfaces and contours of constant  in the ϕ plane where the line of flight comes closest to the magnetic axis. On the right, pellet ablation profiles are shown by the continuous (red) curves in the plasma periphery and particle deposition profiles (Δn) including drift effects by the dashed (blue) curve. The continuous (green) curves extending over the entire plasma cross section depict the density profile before pellet injection while the dashed curve is the sum of initial density and particle deposition profiles.
Download figure:
Standard image High-resolution image6. Predictive simulations with prescribed sources
The transport simulations of section 4 were performed for a density profile conducive to attaining 'highest performance' in W7-X, with the particle balance used to determine the particle source required for such scenarios. As was shown in the last section, however, these requirements cannot be met in high-density W7-X plasmas by the particle sources to be expected from recycling or by pellet refueling with the available blower gun. Thus, one faces the situation treated theoretically in section 2 for which hollow density profiles become unavoidable. This will be looked at in more detail in this section by performing NTSS simulations assuming 'plausible' heating and particle sources and then solving the energy and particle balances to obtain the resulting temperature and density profiles. As a simplification, the particle source will be assumed constant in time—temporal evolution of the profile due to discrete pellet injection is not treated here.
The results of such a simulation are given in the plots of figure 13. ECRH has been applied off-axis again in this example so as to flatten the temperature profiles and thereby moderate the extent to which the core density is reduced by neoclassical thermo-diffusion. The self-consistent power deposition and temperature profiles obtained with this strategy are plotted in the second row of the figure and are quite similar to the corresponding results of the previous simulation with off-axis heating (see figure 9). The particle source used for the simulation and the density profile calculated by NTSS are plotted in the top row of figure 13. The former is shown by the continuous curve that combines the recycling fluxes (dashed curve) with the contribution provided by pellet injection (dotted curve). The density profile is indeed hollow and to a sufficient extent that the pressure profile (right-hand plot of the third row) shares this characteristic as well, in accordance with the theoretical expectations derived in section 2. Nevertheless, the 'hollowness' is less than predicted and this is due to the influence of anomalous transport on the simulation results as will now be demonstrated.
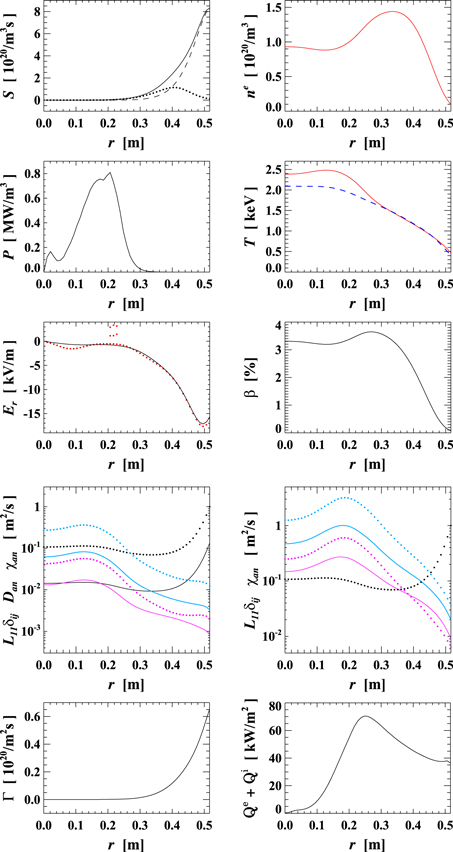
Figure 13. NTSS results are plotted for a simulation with off-axis ECRH and a particle source from neutral recycling and pellet injection. Top row, left: the total particle source is shown by the black continuous curve which sums contributions from recycling (dashed curve) and pellet deposition (dotted curve). Top row, right: electron density profile. Second row, left: deposition profile for O2-polarized ECRH. Second row, right: temperature profiles of electrons (continuous, red line) and ions (dashed, blue line). Third row, left: the radial electric field profile is given by the black curve while red dots indicate roots of the ambipolarity constraint. Third row, right: normalized plasma pressure profile. Fourth row: radial profiles of electron (left) and ion (right) transport coefficients used in the simulation with  given by the continuous magenta curves,
  by the dotted magenta curves,
  by the continuous light-blue curves,
  by the dotted light-blue curves, Dane by the continuous black curve and
  by the dotted black curves. Bottom row, left: radial profile of the electron particle flux density. Bottom row, right: radial profile of the sum of electron and ion energy flux densities.
Download figure:
Standard image High-resolution imageAs anomalous transport is assumed here to be intrinsically ambipolar it might be thought to have no relevance in determining the value of Er required to insure ambipolarity of the neoclassical particle fluxes and, indeed, equation (1) retains its validity. There is the additional constraint, however, that the total particle flux must vanish for core flux surfaces if this region cannot be provided with a particle source—for the present example S = 0 for radii with r < 0.25 m and Γe = 0 must hold in the same region (see the left-hand plot of figure 13 in the bottom row). Accounting for the anomalous contribution to the particle transport and substituting for Er, one obtains
where G is the dimensionless quantity
Whether this result differs significantly from that of equation (2) is thus dependent on the ratio  and it is apparent that the slope of the density gradient required to satisfy Γe = 0 will decrease as G increases. Thus, anomalous particle transport can indeed influence the value of Er needed to satisfy the ambipolarity constraint in the plasma core if it leads to a modification of the density profile in this portion of the plasma. Substituting the required density gradient into equation (1) yields
so that the anomalous particle transport is seen to alter the result for Er by modifying the coefficients that multiply the logarithmic temperature gradients of ions and electrons. The radial profiles of neoclassical and anomalous transport coefficients depicted in figure 13 have  throughout the plasma core whereas L11i is roughly an order of magnitude larger—the resulting profiles of
  and G in this portion of the plasma are shown in the left-hand plot of figure 14. Thus, perhaps counter intuitively, when calculating Er for the present example it is only the ion temperature gradient that receives considerable additional weighting due to the anomalous particle transport, thereby counteracting, to some extent, the substantial disparity in the
  values expected for ions and electrons. This will tend to balance the contributions of the two terms appearing in equation (4), thereby making it more likely that solutions occur for which
  becomes so small that the ordering assumptions of the 'conventional' drift kinetic equation become questionable for ions. Formally, in such cases, it would be necessary to solve a kinetic equation in which the poloidal drift of particle trajectories contains both
  and
and  contributions [47] (DKES accounts for only the first of these two) and which, under extreme conditions, allows for solutions producing a non-local contribution to the radial transport [48].
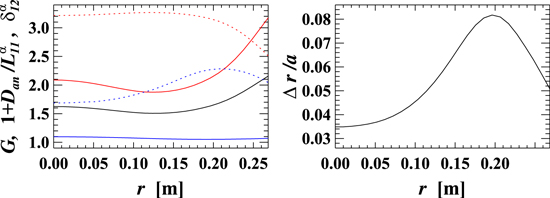
Figure 14. The radial profile of G for the simulation of figure 13 is given by the black curve in the left-hand plot for the portion of the plasma without particle sources. Also shown in this plot are  (continuous curves) and
  (dotted curves) for electrons in red and for ions in blue. The right-hand plot shows the radial displacement of ion drift surfaces from flux surfaces,
  , normalized to the plasma radius a.
Download figure:
Standard image High-resolution imageSuch resource-intensive descriptions of the ion transport will not be undertaken here, however, as two considerations argue against doing so. First, as just demonstrated, small  in the plasma core is fostered in the present example by having
  in this portion of the plasma. Such a level of anomalous particle transport in this region is by no means certain, however, and actually arises here from the value of Dan needed in the plasma periphery to obtain a balance of particle transport and recycling along with the 1/n dependence this anomalous transport coefficient is assumed to possess across the entire plasma. Second, the assumption of local electron transport is justified even for vanishingly small
  given the plasma parameters of this simulation and—for the chosen transport model—it will remain impossible to satisfy Γe = 0 in the plasma core without a hollow density profile. The degree of hollowness, however, will be influenced by the ion transport so it is appropriate to assess the radial extent of the region for which the standard neoclassical description of ion transport becomes questionable. This is done by including a second plot in figure 14 that shows the normalized radial displacement of drift surfaces from flux surfaces for collisionless trapped-ion orbits having K = 1. This quantity is proportional to T/ΩE and is the characteristic 'diffusive' step size for both the
  and ν transport regimes. One sees that this normalized displacement exceeds 0.05 for
  and also that
  for these radii so that a 1/ν contribution to the neoclassical transport coefficients is clearly indicated for larger values of K.
Not surprisingly, the hollow density profile leads to a degradation of the global plasma performance, yielding  ,
,  and W = 1.99 MJ with bremsstrahlung losses of
  kW (compare these values with those of the previous simulation of off-axis heating assuming a flat density profile). Reduction of the core density does allow achievement of a somewhat higher central electron temperature and, consequently, the unabsorbed ECRH power drops to 655 kW, but this small improvement is the only benefit attributable to the change of density profile. Fortunately, suppression of the bootstrap current is but little affected by a hollow density profile as the Jbs curves of figure 15 illustrate; the net current attains the value of Ibs = 3.1 kA and alters the rotational transform profile only to a very small degree.

Figure 15. Profiles of the bootstrap current densities (left) and the rotational transform (right) are plotted for the simulation of figure 13. The total Jbs is given by the black continuous curve, which is the sum of electron (red continuous curve), hydrogen-ion (blue dashed curve) and carbon-impurity-ion (green dotted curve) contributions. The  profiles accounting for and neglecting Jbs are given by continuous and dotted curves, respectively.
Download figure:
Standard image High-resolution image
Although hollow density profiles are not uncommon in the stellarator experimental literature, no claims have been made for the appearance of a positive pressure gradient except, perhaps, for an instant of time following particle deposition by means of pellet injection [49]. The hollow pressure profiles obtained here must therefore be treated with some degree of skepticism. Indeed, it is found that the local Mercier stability criterion is violated throughout the region having positive pressure gradients, and calculations with CAS3D [50] show that unstable, global, linearized ideal MHD modes arise that have a radial extent covering this region. The growth rates for such modes are very rapid, having e-folding times of roughly 15 μs. It is thus conceivable that instability-induced flattening of the pressure profile could aid with central particle refueling although the accompanying drop in the core electron temperature and the associated degradation of O2 power absorption would have to be quite limited for such a scenario to be viable. On the basis of experimental evidence such a scheme cannot presently be considered as more than speculative.
A logical question at this point, given the results presented for W7-AS in section 3, is whether hollowness of the central density profile can be avoided by replacing some fraction of the ECRH with NBI heating. NTSS simulations do indeed predict this to be possible for 2 MW of the former and 3 MW of the latter with the density profile even becoming slightly peaked for off-axis ECRH power deposition. While certainly of experimental interest, such 'mixed-heating' schemes are not compatible with the high-level strategic goals of W7-X [1] that target the development of steady-state reactor-relevant scenarios. The neutral beam injectors at W7-X are limited to pulse lengths of 10 s and even when postulating the existence of steady-state NBI, its use for particle refueling of a future stellarator reactor is unattractive due to the large recirculating power requirements such a system would demand. Such considerations provide the principal impetus for restricting the scenarios considered in this paper to those in which only ECRH is used to heat the plasma.
7. Consequences
The purpose of this paper has been to demonstrate the requirements that neoclassical thermo-diffusion sets on power and particle deposition for W7-X high-performance scenarios. These requirements are not unique to W7-X—indeed, they will arise in any large stellarator for which 1/ν transport reaches an observable level—but the reliance of this device on ECRH can be expected to complicate the search for a means of controlling the density profile so as to enable steady-state operation.
Although a true steady state will not be possible with the test divertor unit during the W7-X experimental campaigns of 2017–18, the 80 MJ limit placed on the time-integrated-heating power of individual discharges during this TDU phase will nevertheless provide ample opportunity to test various schemes for particle fueling, during both the initial density ramp and for subsequent stages when the target density has been reached, so as to provide a basis for later operation with the water cooled, high heat flux divertor. Of particular importance here will be the results obtained with the blower gun in assessing the needs for future upgrades to the pellet system. Documentation of these results must receive high priority to determine whether theoretical modeling is capable of explaining experimental observations, especially given certain LHD findings for which this is not the case. Of particular note here is the prompt increase in central density of roughly 20% observed after pellet injection on a time scale far more rapid than the particle confinement time for plasmas with initial densities of ne(0) ≈ 3 × 10¹⁹ m−3 [49]. Whether such unexplained central refueling occurs at W7-X remains to be seen, however, and whether such behavior would also persist in plasmas with higher performance. Variable repetition rates for pellet injection are possible with the blower gun [42] so that the influence of pellet frequency on particle fueling can also be investigated during the upcoming campaign under the obvious constraint that the cutoff density places on the use of ECRH. Pellets provide the plasma with a particle source but they also represent an energy sink, particularly in the electron energy balance, and the resulting reduction in Te should have the beneficial effect of allowing subsequent pellets to penetrate more deeply into the plasma. Thus, the modeling presented here, using results from HPI2 for single pellets, is likely somewhat pessimistic concerning the particle deposition profiles possible with pellet injection, but to what extent can only be assessed when experimental results become available.
During the W7-X TDU phase, there are several diagnostic systems expected to provide experimental data on particle fueling by pellet injection but one must add the caveat that many of these systems are still far from maturity at the time of this manuscript's preparation. The following list should therefore be treated as an initial set of diagnostic intentions. For example, pellet ablation will be observed with Hα (and/or Hβ) measurements and by using charge-exchange-recombination spectroscopy. It is hoped that the subsequent temporal evolution of the plasmoid may be followed with video diagnostics. Particle deposition can be ascertained from successive density profiles measured by a multi-laser Thomson scattering system employing so-called burst-mode operation [51] to attain high temporal resolution directly after pellet injection. High-time-resolution interferometer measurements of the line-integrated density are also planned.
Although particle fueling of high-density W7-X plasmas is likely to be one of the most prominent experimental topics during the TDU campaign, experience gained with the O2-polarized electron cyclotron resonance heating of such plasmas will also be of great importance. Of particular interest will be to ascertain which combinations of power levels and power-deposition profiles conform with the limits on stray radiation tolerable in the device. The efficacy of the three-pass scheme employed at W7-X to improve absorption of O2-polarized ECRH has been successfully demonstrated during initial operation of the device [52], albeit in plasmas for which the line-averaged density did not exceed 3 × 10¹⁹ m−3. At such densities, central ECRH leads to core electron-root confinement [53] with electron temperatures in excess of 5 keV, enabling the overall absorption fraction to reach approximately 95%, a value in good agreement with ray-tracing predictions. All the simulations presented in this paper were performed assuming Pheat = 5 MW and requiring that at least 80% of this power be absorbed after the third pass of the electron cyclotron waves through the plasma, a requirement fulfilled with little surplus in the examples for which the heating profile was shifted off-axis. The viability of such heating schemes is thus highly dependent on actually achieving the electron temperatures predicted in the simulations. Should experimental values of Te prove too small it is inevitable that increased heating power will be applied in an attempt to redress the shortcoming although such a strategy can only be successful if Te is increased sufficiently to reduce the unabsorbed power to levels below 1 MW, requiring an increase in the absorbed power fraction of at least several percentage points. A long-term solution providing additional flexibility would be implementation of a new multi-pass heating scheme, probably requiring at least four passes through the plasma.
More immediate options for improving the power absorption are also conceivable with extraordinary-mode polarization for the ECRH at the second or third harmonics but would entail a reduction of the plasma density or magnetic field strength, respectively. X2 heating for plasma start-up was explicitly assumed for all the simulations presented here but its exclusive use throughout the discharge would imply ne < 1020 m−3 on average to ensure that the cutoff density is not exceeded locally due to the concentrated particle deposition immediately after pellet injection. For ECRH at 140 GHz the third harmonic is resonant at B = 1.67 T but the cutoff density increases to 1.62 × 10²⁰ m−3. Assuming the ISS04 scaling dependence  [2], maximization of the triple product
  would appear to favor slightly the X3 option although NTSS simulations would be needed to quantify the advantage. Plasma start-up with X3 heating is not possible, however, so that a means of producing a 'target' plasma with Te > 500 eV is necessary to make this a viable option.
With reference to the strategic goals of W7-X, demonstrating means of density-profile control for a large stellarator in which the plasma heating is decoupled from the plasma fueling will be of critical importance for assessing the reactor prospects of the device. Indeed, a reactor will face nearly the identical problem as α-particle heating also provides no particle source to a fusion plasma. From an economic point of view, reactor concepts requiring only a modicum of recirculating power are at a clear advantage and operation of W7-X without need for the heating to provide either current drive or particle sources would provide a strong argument in favor of such a device.
Acknowledgments
The authors would like to thank J Baldzuhn, R Brakel, R Burhenn, H J Hartfuß and M Hirsch for useful information concerning W7-AS experiments and diagnostics.
This work has been carried out within the framework of the EUROfusion Consortium and has received funding from the Euratom research and training programme 2014–2018 under grant agreement No 633053. The views and opinions expressed herein do not necessarily reflect those of the European Commission.