

Abstract
In addition to the relaxation of the pedestal, edge localised modes (ELMs) introduce changes to the divertor and scrape-off layer (SOL) conditions. Their impact on the inter-ELM pedestal recovery is investigated, with emphasis on the electron density (ne) evolution. The typical ELM cycle occurring in an exemplary ASDEX Upgrade discharge interval at moderate applied gas puff and heating power is characterised, utilising several divertor, SOL and pedestal diagnostics. In the studied discharge interval the inner divertor target is detached before the ELM crash, while the outer target is attached. The particles and power expelled by the ELM crash lead to a re-attachment of the inner target plasma. After the ELM crash, the outer divertor target moves into a high recycling regime with large ne in front of the plate, which is accompanied by high main chamber neutral fluxes. On similar timescales, the inner target fully detaches and the high field side high density region (HFSHD) is formed reaching up to the high field side midplane. This state evolves again to the pre-ELM state, when the main chamber neutral fluxes are reduced later in the ELM cycle. Neither the timescale of the appearance of the HFSHD nor the increase of the main chamber neutral fluxes fit the timescale of the ne pedestal, which is faster. It is found that during the ne pedestal recovery, the magnetic activity at the low field side midplane is strongly reduced indicating a lower level of fluctuations. A rough estimation of the particle flux across the pedestal suggests that the particle flux is reduced in this period. In conclusion, the evolution of the ne pedestal is determined by a combination of neutral fluxes, HFSHD and reduced particle flux across the pedestal. A reduced particle flux explains the fast, experimentally observed re-establishment of the ne pedestal best, whereas neutrals and HFSHD impact on the evolution of the SOL and separatrix conditions.
Export citation and abstract BibTeX RIS

Original content from this work may be used under the terms of the Creative Commons Attribution 3.0 licence. Any further distribution of this work must maintain attribution to the author(s) and the title of the work, journal citation and DOI.
1. Introduction
At the edge of magnetically confined plasmas in the high confinement mode (H-mode) regime [1], which is the intended operational regime of future fusion devices like ITER [2], an edge transport barrier (ETB) occurs. This ETB is connected to steep gradients in the density and temperature profiles, also known as pedestal, which are limited by MHD instabilities called edge localised modes (ELMs) [3, 4]. ELMs lead to a quasi-periodical collapse of the ETB and of the pedestal, and to enhanced particle and heat transport across the separatrix into the scrape-off layer (SOL). By conduction along the magnetic field lines most of the expelled plasma is guided towards the divertor. Depending on the divertor state the energy of the expelled plasma is either dumped on the target plates (attached) or dissipated in a neutral gas cushion above the target plate (detached) [5]. In a future fusion power plant a stable detached divertor operation is required [6]. For this reason the impact of transient particle and heat fluxes on the divertor condition is crucial.
At the onset of divertor detachment a region of high plasma density is formed at the entrance of the inner divertor that can extend up to the high field side (HFS) midplane. This effect is also named the high field side high density region (HFSHD) [7] and originates from a neutral particle accumulation in front of the inner target that is ionised by the SOL plasma [8]. Since the density of the HFSHD is typically an order of magnitude larger than the density at the separatrix, it also affects the pedestal density profile and therefore, the pedestal stability with respect to ELM crashes [9]. The divertor conditions and the HFSHD evolve throughout the ELM cycle, which can also impact the dynamics of the inter-ELM pedestal evolution.
Previous work at ASDEX Upgrade has identified the evolution of the outer divertor into a high recycling regime after an ELM crash [10, 11], that is connected to large plasma densities in front of the target and high  line radiation (
 ). Similar observations have been made at JET and it is suggested that the enhanced
  emission is related to outgassing of deuterium (D), which was implanted by the ELM crash [12]. However, this strong change of recycling cannot be reproduced by diffusion-trapping modelling of hydrogen in tungsten under pulsed, ELM-like plasma loads [13]. On DIII-D two-dimensional modelling of the ELM cycle reproduced a phase after the ELM crash with relatively dense and cold divertor plasma but without increased
  emission [14].
The impact of ELMs on the divertor conditions and the corresponding transport of particles has been previously studied on several experiments e.g. DIII-D [15, 16] or JET [17, 18]. Further, the dynamics of the pedestal throughout the ELM cycle were investigated [19] and compared to transport and pedestal models [20, 21]. On ASDEX Upgrade distinct pedestal recovery phases were identified [22]. Usually, in the initial phase directly after the ELM crash, the electron density (ne) and ion temperature (Ti) gradient recover [23], whereas the electron temperature (Te) gradient recovers after their establishment. Then a phase of variable duration with clamped maximum pressure gradient occurs. This phase is accompanied by magnetic fluctuations [24], which have toroidal mode numbers (n) in the region of −11 [25]. Further, modelling of the pedestal identified different regimes of turbulence being present in the distinct recovery phases [26].
This paper characterises and connects the evolution of the divertor, SOL and pedestal for a typical ELM cycle at ASDEX Upgrade and emphasises their impact on the initial ne pedestal recovery phase. It will be shown that the recovery of the pedestal ne profile is also correlated with the characteristic magnetic activity in the pedestal. Further, the particle flux across the pedestal is simply estimated by applying the continuity equation. Section 2 introduces the investigated plasma scenario and the large set of plasma edge and divertor diagnostics used in this study. In section 3 the dynamics throughout the ELM cycle at the inner and outer divertor target as well as the HFS and low field side (LFS) midplane are compared. The measured pedestal ne profiles are used to estimate the particle flux across the pedestal in section 4. This rough approximation suggests that the particle flux across the edge is reduced during the recovery of the electron density gradient ( ) and increases afterwards (section 5).
2. Investigated plasma scenario and utilised diagnostics
For the purpose of this study a plasma discharge interval (#30 701, 2.975–3.400 s) with relatively low ELM repetition frequency of approximately 70 Hz is used so that the phases of the pedestal recovery are sufficiently long and well discriminable. The discharge was performed with a standard magnetic configuration of plasma current Ip = 1.0 MA and toroidal magnetic field Bt = −2.5 T (negative sign stands for opposite direction to Ip) in lower single null with  drift direction pointing towards the lower divertor. During the analysed discharge phase a heating power, Pheat, of 5.3 MW by a combination of neutral beam injection (PNBI
  ) and electron cyclotron resonance heating (PECRH
  ) was applied. Further a moderate neutral gas puff of
  was injected from valves that are located in the private flux region. The line-averaged ne at a central chord was
  , leading to a Greenwald fraction (ne/
 ) of roughly 0.53. The overall confinement scaling factor (
 ) was on the order of 0.8.
A comparison of several discharge intervals at Ip = 1.0 MA and Bt = −2.5 T is presented in figure figure 1. Here, the pedestal top ne, Te (measured at  , figure 1(a)) and ELM frequency (
 ) (figure 1(b)) are presented for a variation of Pheat and gas puff. For typical required gas puffs at ASDEX Upgrade, which are above
  , pedestal top ne larger than
  are measured. The
  increases with Pheat, which is an important characteristic of type-I ELMs. In the shown data set, the discharge interval presented within this work is indicated by a black circle and marked by an arrow. It was chosen because of its relatively low
  , its typical pedestal conditions at an ASDEX Upgrade relevant gas puff. The relative energy losses due to ELM (
 ) of the data set are characterised in figure 2. Here,
  represents the drop of plasma stored energy (
 ) during the ELM crash and
  the energy stored in the pedestal, calculated with the plasma volume V and using two times electron pressure (pe) at the pedestal top. This approximation of the pedestal pressure is made since pedestal top electron collisionality (
 ) in the presented discharge interval is roughly 1.5 and the electron and ion profiles at the pedestal top are coupled.

Figure 1. ELMy H-mode operational space at Ip = 1.0 MA and toroidal Bt = −2.5 T: (a) pedestal top Te ( ) and (b)
  in dependency of the pedestal top ne (
 ) and gas puff. The presented plasma discharge interval (#30 701, 2.975–3.400 s) is indicated by a black arrow and was chosen to have a relatively low
  at moderate gas puff as it is usually applied.
Download figure:
Standard image High-resolution image
Figure 2. Relative relative energy losses due to ELM ( ) for the data set presented in figure 1. The presented plasma discharge is indicated by a black arrow and has a
  of roughly 12%.
Download figure:
Standard image High-resolution imageAgain, the presented discharge interval is indicated by a black circle and marked by an arrow. It has an average  of approximately 12%, which is in the average range of the presented data set. In the presented discharge the divertor conditions are as follows: before an ELM crash the inner divertor target is detached whereas the outer divertor target is attached.

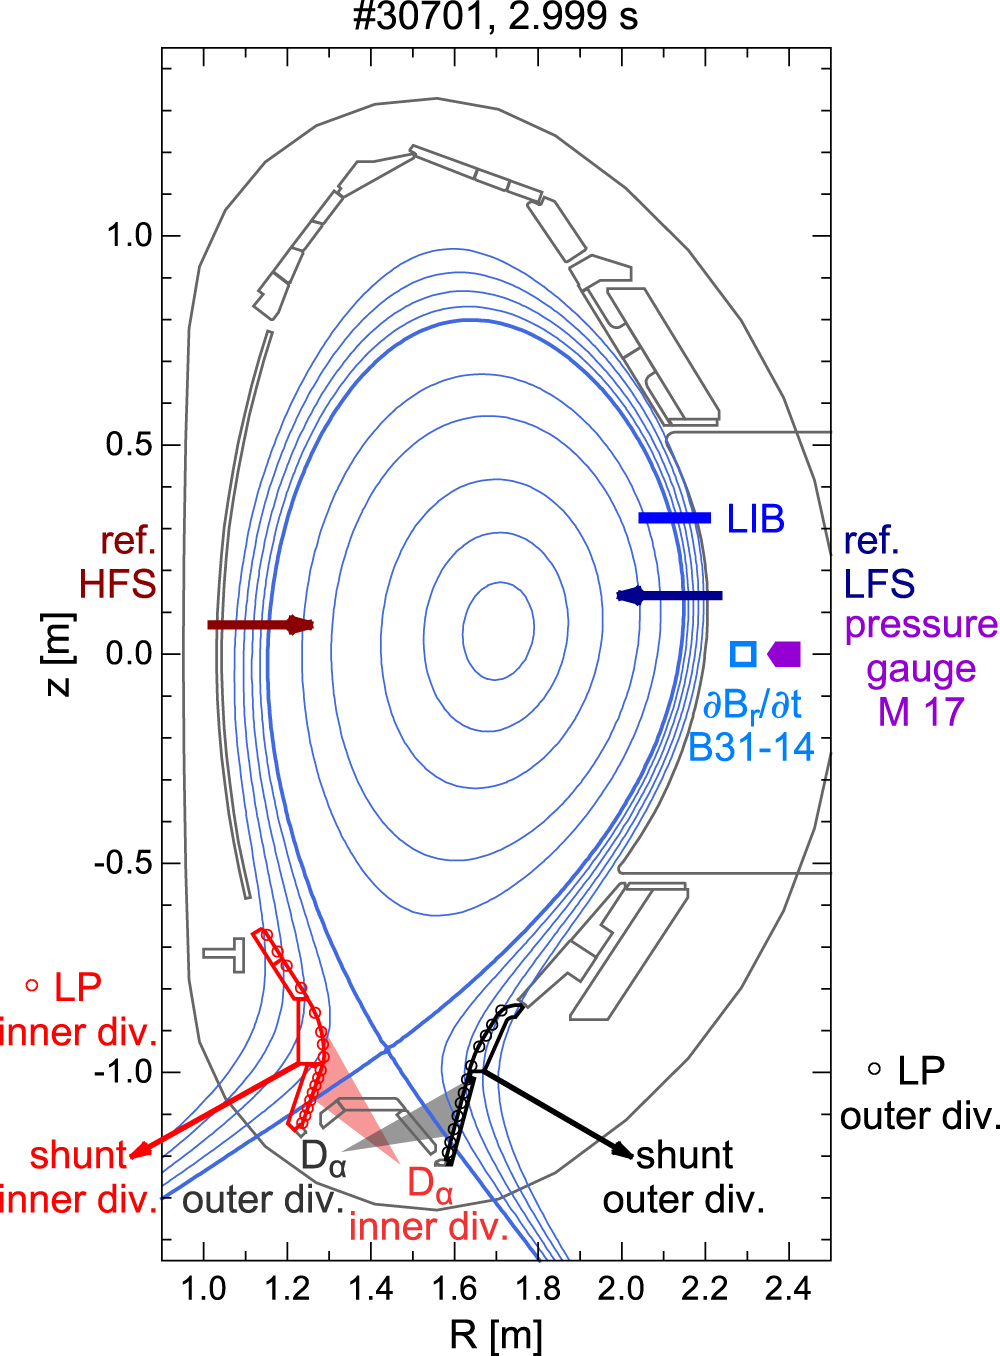
Figure 3. Poloidal arrangement of plasma edge and divertor diagnostics: the inner (red) and outer (black) divertor is diagnosed by a set of triple Langmuir probes (LPs) (circles), optical volume integrated  line radiation spectroscopy (light colours) and shunt measurements of the SOL currents (coloured tiles). The HFS and LFS SOL ne profiles are measured by O-mode reflectometry (dark red, dark blue) and lithium beam (blue). Further a ballooning coil (light blue) is utilised to measure
  and a pressure gauge that is oriented towards the plasma (violet) is used to measure the main chamber neutral fluxes.
Download figure:
Standard image High-resolution imageFigure 3 gives an overview of the plasma diagnostics, which are utilised within this study. The lower divertor of ASDEX Upgrade is equipped with a set of triple Langmuir probes (LPs) [27], which are used to measure ion saturation current (jsat), ne and the Te at the divertor target. A volume integrated spectroscopic detection of the  emission for the inner (light red) and outer (grey) divertor is installed. The
  emission intensity is a convolution of the divertor neutral density, the plasma density and the plasma temperature. Further shunts are attached to several tiles of the inner (red) and outer (black) divertor that measure the thermoelectric current in the SOL [28].
The midplane ne profiles at the HFS and LFS are measured by two O-mode reflectometers [29]. This allows the direct comparison of the HFS and LFS SOL ne [30]. Slightly above the LFS midplane a lithium beam (LIB) diagnostic is installed [31], which measures the ne profile up to the pedestal top by LIB emission spectroscopy. This enables on the one hand a comparison of the LFS SOL ne profile by two independent measurements and on the other hand a connection of the pedestal and SOL ne. The LIB ne profiles are evaluated within the integrated data analysis framework [32] by applying a collisional radiative model [33, 34]. Main chamber neutral fluxes are measured by a pressure gauge (M 17), that is located at the LFS midplane and oriented towards the plasma [35]. To detect the magnetic signature a set of toroidally distributed ballooning coils are mounted at the LFS midplane [25]. In the following one coil (B31-14) is utilised to characterise radial magnetic field fluctuations ( ) throughout the ELM cycle.
3. Inter-ELM evolution of the SOL
To understand the mechanisms, leading to the fast recovery of the ne pedestal after an ELM crash, the conditions outside the confined plasma need to be well characterised, since enhanced SOL ne or higher neutral fluxes across the separatrix can provide particles to build up the ne pedestal. For this reason, the following section characterises the divertor plasma throughout the ELM cycle as well as the dynamics of SOL ne at inner and outer midplane, which are clearly connected with the divertor evolution. Especially, the timescales on which the changes in the divertor and SOL occur are pinned down, such that they can be later compared to the timescales of the pedestal evolution (see section 4.1).
3.1. Divertor conditions in the ELM cycle
Figure 4 presents ELM synchronised time traces of the SOL current and the  emission at the inner and outer divertor target, measured in the studied discharge interval. The SOL current consists of Pfirsch–Schlüter current contributions, ohmically driven currents and thermoelectric currents, that originate from temperature differences of the inner and outer divertor plasma. In the standard ASDEX Upgrade magnetic field configuration, like the investigated plasma was performed in, the current flows through the plasma SOL from the outer to the inner target. For this reason the measurements in the inner and outer targets have opposite signs. The ELM crash appears as large burst in the SOL current and has a duration of approximately 1.5 ms. Then a period of reduced SOL current is observed from 1.5 to 7.0 ms relative to the ELM onset especially at the outer target. During this phase the
  emission at the outer target has a second peak that is of similar magnitude as the observed emission during the ELM crash. This is characteristic for a regime of high recycling [10]. For times larger than 7 ms after the ELM onset the
  emission lowers to its pre-ELM values, indicating an attached divertor plasma as it will be discussed later. At the inner divertor target the
  evolves differently than at the outer divertor. The large pre-ELM
  emission indicates that neutral radiation is already present in front of the target and that the inner target is at least partially detached. During the ELM crash the
  emission is reduced, which can be interpreted as re-attachment of the inner divertor target since a larger amount of hot particles flows to the divertor. Another effect that can also be related to the reduction of
  is the movement of the strike line during the ELM crash. This is presented in figure 5, where the location of the strike line (top) in divertor coordinates (S) as well as jsat, measured by LPs, for locations between 0.5 and 2.5 cm outside of the strike line position (
 ) in the SOL (bottom) are plotted. The S coordinate increases from the inner divertor target across the dome towards the outer divertor target. The ELM crash induced movement of the strike line in the inner divertor is roughly 4 cm in downward direction, while the movement at the outer divertor is about 2 cm. The movement of the inner strike line can also lead to an reduction of the
  emission at the inner divertor if the radiation front moves out of the view of the
  detector. Nevertheless, jsat at the inner divertor target indicates enhanced particle fluxes to the target and therefore, re-attachment. After the ELM crash the
  emission in the inner divertor increases (figure 4(a), 1.5–2.5 ms relative to the ELM onset). During this time also the strike line moves back towards its pre-ELM location (figure 5(a)). In this phase the
  emission as well as jsat is reduced, indicating a post-ELM detachment of the inner target. Then
  decreases slightly while jsat increases steadily during the high recycling period of the outer divertor, where also enhanced jsat is observed at the outer target (see figure 5(b)). In this phase the inner target fully detaches and the
  radiation front moves upwards towards the midplane and therefore, out of the lines of sight of the
  detector (see figure 4(a)). Approximately 7.5 ms relative to the ELM onset the
  emission jumps to pre-ELM values indicating, that the radiation front moves quickly towards the target again.

Figure 4. ELM synchronised evolution of the SOL current and  emission at the (a) inner and at the (b) outer divertor target: the SOL current flows from the outer to the inner target. The
  emission at the outer target increases approximately 2.5 ms after ELM onset a second time, which is not connected to another ELM crash but to high neutral recycling.
Download figure:
Standard image High-resolution image
Figure 5. ELM synchronised evolution of the strike line position in divertor coordinates (S) and the jsat at the (a) inner and at the (b) outer divertor target: for jsat, LP measurements between 0.5 cm and 2.5 cm outside the strike line ( ) are spatially superimposed. During the ELM crash the strike line moves downwards along the divertor target and jsat exhibits a peak. The second increase of jsat at the outer divertor is related to the high neutral recycling.
Download figure:
Standard image High-resolution imageA more detailed view on the state of the inner and outer divertor targets throughout the ELM cycle is given by divertor LP measurements of ne and Te. These are presented in figure 6 as ELM synchronised plots. The data is superimposed for locations between 0.5 cm and 2.5 cm outside of the strike line position ( ) in the SOL. Before the ELM onset the inner divertor is detached, Te is below 5 eV. During the ELM crash Te and ne are increasing, indicating re-attachment of the inner divertor. After the ELM (between 2.5 and 7.0 ms relative to the ELM onset) the fluxes on the inner divertor target are reduced, limiting an accurate ne and Te evaluation. Nevertheless, the reduced fluxes indicate that less plasma is reaching the inner divertor. At the outer divertor target the plasma is attached in the pre-ELM phase and Te is roughly 15–20 eV. When the ELM crash starts (between 0.0 and 0.5 ms relative to the ELM onset) a pulse of hot plasma ('electron heat pulse'; Te larger than 30 eV) is observed, that is followed by phase of larger ne (0.5–2.0 ms relative to the ELM onset). After the ELM crash, the plasma Te at the outer divertor target is approximately 5–10 eV during the period of high recycling. It is accompanied by relatively high plasma ne at the outer target, which reaches a similar magnitude as the ne peak caused by the ELM crash.

Figure 6. ne and Te at the (a) inner and at the (b) outer divertor target: ELM synchronised evolution and spatially superimposed triple LP measurements between 0.5 and 2.5 cm outside the strike line ( ). While the inner divertor is detached in the inter-ELM period, the plasma at the outer target is relatively hot and Te decreases in the period of high recycling, while ne increases.
Download figure:
Standard image High-resolution imageIn summary, the divertor conditions of the presented discharge interval evolve throughout the ELM cycle as follows: Prior to the ELM crash, the inner divertor is detached, whereas the outer divertor is attached. During the ELM crash, the inner divertor attaches. Immediately after the ELM crash, the inner divertor fully detaches on similar timescales as the outer divertor moves to a regime of high neutral recycling.
3.2. SOL ne evolution at the midplane
As shown in section 3.1 the ELM crash induces a lot of dynamics to the divertor conditions. Since the divertor plasma is coupled to the SOL plasma at the midplane, the dynamics of the SOL ne profiles at the HFS and LFS are studied in the following. Further, the timescales of their dynamics throughout are related to the evolution of the divertor conditions. The SOL ne profiles at the HFS and LFS midplane are measured by reflectometry [30] and at the LFS additionally by the LIB. ELM synchronised profiles are presented for three different time intervals relative to the ELM onset in figures 7 (a)–(c). The superimposed reflectometry profiles, which were measured in the corresponding time interval relative to the ELM onset, are fitted by a spline curve. The LFS reflectometry profiles are shown in dark blue, whereas the HFS profiles are shown in dark red. For comparison the LIB ne profiles, which are also averaged in the corresponding time interval relative to the ELM onset, are shown in blue. Both independent LFS diagnostics measure similar SOL ne profiles in all time intervals relative to the ELM onset. In the pre-ELM phase the HFS and LFS SOL ne profiles are similar and below  . A large asymmetry is found in the post-ELM phase in figure 7(b), when the inner divertor target is fully detached and the HFSHD is present, which in this case reaches up to the midplane causing the strong difference of the HFS and LFS SOL ne profiles. Similar asymmetries and behaviour of the inner divertor have been found also in L-mode [30]. The HFS-LFS asymmetry decreases, when the HFSHD is reduced as seen in figure 7(c).

Figure 7. Comparison of the HFS and LFS ne profiles from reflectometry (ref.) and lithium beam (LIB): (a) pre-ELM (averaged between −2.0 and −1.0 ms relative to ELM onset), (b) post-ELM (averaged between 3.0 and 4.0 ms relative to ELM onset) and (c) far post-ELM (averaged between 7.0 and 8.0 ms relative to ELM onset) profiles. The shaded areas represent the statistical uncertainties of the spline fit to the ne profiles. The LFS ne profiles of reflectometry and LIB agree very well. When the HFS-LFS asymmetry is largest, the HFSHD extends up to the midplane and radially outwards to the inner heat shield (vessel wall).
Download figure:
Standard image High-resolution imageThe dynamics of the SOL ne profiles for HFS and LFS are presented in figure 8. On four radial positions from near to far SOL, ne is tracked. After the ELM crash the HFS ne at the tracked positions is larger than the cut-off ne for the reflectometer. The decay of the HFSHD has a similar timescale as the measurements in the divertor would suggest. During the presence of the high recycling regime in the outer divertor also an increased ne in the LFS SOL is measured. A similar observation was previously named the SOL ne shoulder and its formation is suggested to be associated to a change of the SOL transport regime [36].

Figure 8. Comparison of the inter-ELM (a) HFS and (b) LFS SOL ne evolution: ne at four different radial positions ( ) from near (1.01) to far (1.04) SOL. After the ELM crash a strong asymmetry between LFS and HFS SOL ne is observed, which timescale corresponds to the appearance of the HFSHD. During this period the SOL density shoulder appears at the LFS.
Download figure:
Standard image High-resolution imageIn this section it was shown that a large asymmetry between HFS and LFS SOL ne profile exists at the midplane, when the inner divertor is fully detached. Under these conditions the HFSHD expands up to the HFS midplane. Further, it has been described in detail, that the HFSHD is strongly impacted by ELMs, implying that it is changing throughout the ELM cycle and therefore, not stationary. The evolution of the HFSHD can impact on the inter-ELM recovery of the ne pedestal, which is studied in the following.
4. Inter-ELM pedestal evolution
The inter-ELM evolution of the SOL and divertor plasma is closely related to the inter-ELM evolution of the pedestal, because SOL and divertor represent the boundary of the pedestal. It was previously discussed that the inter-ELM pedestal evolution of ne and Te profiles at ASDEX Upgrade exhibits different timescales [22]. First, the maximum electron density gradient ( ) is established, then the maximum electron temperature gradient (
 ) builds up. In the following the recovery of the ne pedestal will be analysed in detail and connected to the magnetic activity at the LFS midplane and the main chamber neutral fluxes.
4.1. ne pedestal recovery and LFS magnetic activity
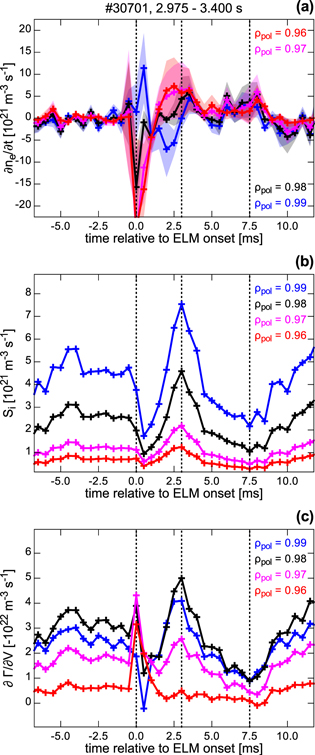
The recovery of the ne pedestal usually takes of the order of less than 2 ms. This short timescale indicates that lost particles due to the ELM are immediately replaced after the ELM crash. A larger neutral particle source caused by neutralisation of the plasma, which is expelled by the ELM crash, the appearance of the HFSHD or a change of the particle transport in the pedestal are possible reasons to explain the short recovery timescale of the ne pedestal. Figure 9 presents ELM synchronised frequency histograms of radial magnetic field fluctuations ( ) at the LFS midplane, LFS midplane neutral fluxes measured by the manometer M 17 (see figure 3), which were temporally shifted by −1.5 ms, ne and
  at four radial positions in the confined plasma. The temporal shift of the neutral fluxes was applied to align the increase of the fluxes due to the ELM crash with the actual ELM onset. Because of the finite volume and the small aperture of the manometer, an intrinsic response delay of roughly 1.5 ms is estimated, in which the gas streams into the manometer and fills its volume.

Figure 9. Correlating the ELM synchronised ne pedestal recovery with the magnetic activity and the main chamber neutral fluxes: (a) ELM synchronised frequency histogram of  measured at the LFS midplane, (b) LFS midplane neutral fluxes (shifted by −1.5 ms), (c) ne and (d)
  at four radial positions (
 ) in the confined plasma from the pedestal top (0.96) to the steep gradient region (0.99). During the recovery of
  in the steep gradient region (between 1.5 and 3.0 ms) a phase of low magnetic activity is found. During this period also the neutral particle flux in the main chamber is enhanced, well before the
  emission and ne increase in the outer divertor and the appearance of the high recycling regime.
Download figure:
Standard image High-resolution imageThe  at the LFS midplane (figure 9(a)) shows low activity between 1.5 and 3.0 ms relative to the ELM onset for all frequencies. During this period the ne pedestal and, respectively,
  in the steep gradient region recover (figure 9(d)). Remarkably, the steepening of the gradient is not solely attributed to a rise of the ne pedestal but also related to a ne decrease in the confined region close to the separatrix (figure 9(c)), i.e. at
  . This is an indication for a reduced particle flux across the pedestal region. The neutral fluxes at the LFS midplane (figure 9(b)) stay high while the ne pedestal recovers. It is unknown, whether in addition to the time delay, also a temporal smearing of the measured neutral fluxes occurs. This would lead to a longer detected period of higher neutral fluxes. However, if present, a similar timescale as the one of the intrinsic response delay could be assumed, which would be in the region of 1 ms. An indication that the fast ne pedestal recovery is not directly linked to the evolution of the source is that between 3.0 and 5.0 ms relative to the ELM onset, the neutral flux slowly decays. In this period neither
  nor the pedestal top ne evolution are affected by this decrease of the source. For this reason the ne pedestal recovery is not directly related to the evolution of the source, especially the prompt saturation of the
  at 3.0 ms relative to the ELM onset. This will be studied in detail in section 4.2.
As an asymmetry between HFS and LFS during the ELM crash of the ne pedestal has been observed on JT-60U [37], the fast recovery of the ne pedestal could be also caused by a symmetrisation of the HFS and LFS ne pedestal. Unfortunately, this can not be directly addressed using experimental measurements since the ne pedestal recovery at the HFS can not be measured because of the presence of the HFSHD in the SOL, which 'obscures the view on the pedestal' for the HFS reflectometer. Nevertheless, the timescale of the symmetrisation process of HFS and LFS ne in the confined plasma is determined by the parallel connection length and the ion sound speed. For the post-ELM parameters of this discharge interval this timescale is around 200 μs, which is definitively faster than the observed ne pedestal recovery time.
Temporally correlated to the stagnation of the ne pedestal recovery is the onset of medium frequency fluctuations in the range of 30–150 kHz approximately 3.0 ms relative to the ELM onset (see figure 9(a)). These fluctuations could cause an additional particle flux across the pedestal, leading to the saturation of  and causing the high recycling phase in the outer divertor. Roughly 7.5 ms after the ELM onset the
  is clamped and high frequency fluctuations (
 ) set in. The period between 3.0 and 7.5 ms is also the timescale of the high recycling in the outer divertor and the HFSHD is present. These two effects are not temporally correlated to the establishment of
  and the fast recovery of the ne pedestal, which already takes place before. The experimental data suggest that a reduced particle flux is connected to the fast recovery of the ne pedestal or vice versa an increased particle flux across the pedestal causes the stagnation of the ne recovery as well as the second
  peak in the divertor.
4.2. Estimation of the particle flux across the pedestal
A simple estimation of the particle flux (Γ) across the pedestal can be done by applying the continuity equation:

The particle flux into the volume ( ) and ionisation source (
 ) including the proportionality factor (α) determine the temporal evolution of electron density recovery rate (
 ). The evolution of ne at certain positions from figure 9(c) can be used to determine
  . Figure 10(a) presents
  at four radial positions in the pedestal region.
  profiles are determined using the 1.5D neutral transport code KN1D [38]. Of course a spatial 1D treatment of the neutral distribution is a very simplistic picture in a toroidal plasma. But the LFS main chamber has been found to be the main region for neutral fuelling [8], especially when the HFSHD is present. The neutral flux at the LFS midplane as shown in figure 9(b) was used as condition at the wall and the ne profiles of the LIB diagnostic, which are measured at the LFS served as input. Since there are no midplane SOL Te measurements with the required temporal resolution available, the SOL Te was parametrised by an exponential decay with a characteristic decay length according to the H-mode scaling for ASDEX Upgrade [39]. With this procedure a possible variation of the SOL Te throughout the ELM cycle is not considered. Further, the SOL Ti is assumed to be equal to Te, which is reasonable in the sense that the cross sections of ion-neutral collisions do not have strong dependencies on Ti in the relevant Ti range. Another particle source, providing particles to the confined plasma region is the neutral beam injection, which was applied. The injected particle particle rate was
  , which is roughly a factor of ten smaller than the applied external gas puff. This already points into the direction that the effect of beam fuelling is of secondary order in the presented case. The amount of beam fuelled particles per volume, assuming roughly an equal distribution over the whole plasma volume of
  , is even two orders of magnitude smaller in comparison to the estimated
  in the pedestal region. The evolution of the
  profiles is presented in figure 10(b). They are mainly determined by the evolution of the midplane neutral fluxes, which strongly increase after the ELM crash between 2.5 and 6.0 ms relative to the ELM onset. When the SOL ne is higher, e.g. during and shortly after the ELM, only few neutrals can penetrate into the confined plasma region, leading to a reduction of
  .
.
Figure 10. Estimation of the particle flux across the pedestal: (a) electron density recovery rate ( ), (b) ionisation source (
 ) and (c) estimated particle flux (Γ) at four radial positions (
 ) in the pedestal (pedestal top (
 ) to the steep gradient region (
 )). After the ELM, owing to the increasing
  also the outward particle flux across the edge increases. This takes place in a similar phase, when the magnetic fluctuations at the LFS midplane set in.
Download figure:
Standard image High-resolution image
To adapt the  profiles, α is utilised. In the pre-ELM phase between −4 and −1 ms relative to the ELM onset α can be determined since
  is close to zero and the pedestal gradients are clamped. Therefore, Γ can be chosen in such a way that the diffusion coefficient (D) is in agreement with the ones that are observed in H-mode [35]:

The assumption of solely diffusive transport in the steep gradient region is rather rough and based on previous results of modelling the L–H transition [40]. Here, a small pinch velocity could not be excluded, but the transport at the edge was dominantly diffusive. Nevertheless, within this work the assumption of diffusive transport is solely used to determine α. A radially dependent D profile linearly increasing from  at the separatrix to
  at the pedestal top is assumed between −4.0 and −1.0 ms relative to the ELM onset, which results in a continuous profile of α ranging from 1.5 at the separatrix to 15.0 at the pedestal top. Within the applied approach, α also scales
  for effects, which were not incorporated in the neutral modelling, e.g. toroidal geometry or reflected, non-thermal neutrals from the wall, which lead to a higher source towards the pedestal top.
Having α fixed throughout the ELM cycles, the temporal evolution of  , shown in figure 10(c), is determined from the continuity equation (equation (1)) at every timestep. The ELM onset leads to an outward burst of plasma particles. After the ELM crash the particle flux across the pedestal is strongly reduced. During this period
  is largest for the pedestal top and no magnetic activity is present in figure 9(a). When
  increases after the ELM crash, then also
  goes up since
  is already reduced. This is another indication that the fast recovery of the ne pedestal is more related to a reduced particle flux in the gradient region than to an increased particle source. When
  decreases roughly 5.0 ms after the ELM onset,
  is also reduced, indicating the strong coupling between these quantities. Since the magnetic activity in the medium frequency range is only slightly reduced in this period, the reduction of
  cannot be related to a change of turbulent transport in the pedestal.
5. Discussion
The inter-ELM dynamics in the divertor, SOL and in the pedestal and their corresponding timescales can be summarised in a consistent picture. The phases of the ne pedestal recovery can be well related to the magnetic activity in the pedestal and to the conditions in the divertor and SOL. The ELM crash expels heat and particles to the SOL, causing a re-attachment of the inner divertor target. During the recovery of  the magnetic activity in the pedestal is reduced significantly. Further, the corresponding timescale of the
  recovery is only reproduced by the change in the magnetic activity. When
  is recovered, approximately 3 ms relative to the ELM onset, medium frequency fluctuations between 30 and 150 kHz set in. Further, the LFS SOL ne increases, which is accompanied by high recycling in the outer divertor and full detachment of the inner divertor target and the HFSHD appears. In the following,
  decreases and
  evolves much more slowly than directly after the ELM crash. Because
  is high in this period, Γ through the edge is also large to balance it. When
  decreases, also Γ does so. High frequency magnetic fluctuations (around 240 kHz) set in approximately 7.5 ms relative to the ELM onset. In this phase the pedestal
  as well as the electron temperature gradient (
 ) are clamped, the latter suggests an additional heat flux towards the SOL. The recycling in the outer divertor is reduced because no additional neutrals are provided for ionisation, leading to a hotter SOL plasma, which is related to the Te increase at the outer target. Further, the HFSHD is reduced and the inner divertor moves to a detached state. In summary, the dynamics in the divertor and SOL are well connected with and likely caused by the evolution of the pedestal, because changes in the heat and particle fluxes across the pedestal introduce transient changes to the SOL plasma.
6. Summary and outlook
The fast recovery time of the ne pedestal, respectively the stagnation of the pedestal top ne, can neither be explained by the appearance of the HFSHD nor by an increased source provided from neutrals. Because their timescales in the ELM cycle are much longer than the re-establishment of the pedestal  . The lower magnetic activity during the ne pedestal recovery suggests a lower fluctuation level and consequently lower particle flux across the edge. This is also supported by the rough estimation of the particle flux throughout the ELM cycle. It is clear that especially modelling of neutral fluxes and ionisation source profiles is more complex than estimated here. Nevertheless, the presented approximation is a first step towards modelling of the particle transport across the edge in the ELM cycle. Further, it gives an idea, which mechanisms contribute to the ne evolution. Future work will emphasise on a more accurate modelling of the source profile, i.e. with 3-D neutral codes as B2-EIRENE [41] and use more advanced transport solvers as ASTRA [42].
Acknowledgments
Fruitful discussions with A Scarabosio are warmly acknowledged. F M Laggner is a fellow of the Friedrich Schiedel Foundation for Energy Technology. The TU Wien University Library is acknowledged for the financial support through its Open Access Funding Program.
This work has been carried out within the framework of the EUROfusion Consortium and has received funding from the Euratom research and training programme 2014–2018 under grant agreement No. 633053. The views and opinions expressed herein do not necessarily reflect those of the European Commission.