

Abstract
A summary is given on recent experiments in L-mode with ion cyclotron resonance heating (ICRH) of hydrogen minority in deuterium plasmas on EAST. Experiments show a degradation of confinement with increasing power. Furthermore, the energy confinement time increases with plasma current and magnetic field, whereas it is insensitive to line averaged density. Minority heating has been found to be efficient, and parameters were optimized to maximize its efficiency. ICRH in lower hybrid waves heated plasma was also investigated.
Export citation and abstract BibTeX RIS
1. Introduction
Ion cyclotron resonance heating (ICRH) has several advantages among other radio frequency (RF) methods: technological feasibility of the RF system for this frequency range (f = 20–120 MHz), no density limit for fast Alfvén (compressional) waves to access plasma core, and existence of several damping mechanisms allow to fulfill various heating scenarios [1]. The principles of ICRH have been analyzed extensively [2, 3]. Only a brief review of the theoretical basis of ICRH on EAST is given here. In general, heating in the ion cyclotron range of frequencies (ICRF) is related to resonance layers, such as the ion cyclotron resonance and the ion–ion hybrid resonance. To provide a wave electric field component in the correct direction, ICRF waves have to be applied to EAST at the fundamental frequency, to heat a hydrogen minority in a D bulk plasma D(H). In detail, ICRH aims at coupling electromagnetic power to the perpendicular motion of plasma ions, through the fundamental ion cyclotron resonance:

In equation (1),  is the wave frequency,
  is the ion cyclotron frequency (
 is the ion charge and
  its mass),
  its velocity along the magnetic field
B
, the wave being launched with a propagation vector
k
(
its velocity along the magnetic field
B
, the wave being launched with a propagation vector
k
( being its component parallel to
B
). Besides, minority heating (MH) mechanism consists for the wave to drive suprathermal minority ions which heat the bulk by colliding with ions and electrons. In general, the averaged energy of the suprathermal ions is such that they mainly slow down on the bulk electrons, leading to a predominant electron heating.
being its component parallel to
B
). Besides, minority heating (MH) mechanism consists for the wave to drive suprathermal minority ions which heat the bulk by colliding with ions and electrons. In general, the averaged energy of the suprathermal ions is such that they mainly slow down on the bulk electrons, leading to a predominant electron heating.
The minority scenario is the most widely used scenario for ICRH on existing machines, such as JET [4–6] ASDEX-Upgrade [7, 8] and Tore Supra [9, 10]. In JET, to maximize the constructive interference effect, plasma and ICRH parameters are pushed close to technical limits obtained in D-T experiments [11, 12]. Mode conversion heating [13–15] has been proven to heat electrons. On EAST, fundamental heating of a hydrogen minority in D majority plasma [16–20] is successfully performed. Besides, significant performances of this heating method have also been demonstrated [21] and ICRH-induced high confinement have been achieved on EAST [22].
This paper presents a summary of ICRH experiments performed during EAST 2015/2016 campaigns. The experimental setup is described in section 2 and the confinement is analyzed in section 3 [23, 24]. Heating behavior of EAST plasmas during the application of ICRH is detailed in section 4.
2. Experimental setup
EAST ICRF system can operate in a frequency range from 25 to 70 MHz and eight 1.5 MW ICRF systems have been put into use. ICRF system includes high-power and wide-frequency radio amplifier, the phase shifter system, the matching system and two 4-straps antennas. The transmission line size is 9 inch, the characteristic impedance is 50 Ω, and dry nitrogen gas is filled at the pressure of 3 atm between inner and outer conductor [25].
All discharges were fulfilling the following criteria: major radius R = 1.85 m, minor radius a = 0.45 m, plasma current IP = 0.4–0.6 MA and toroidal magnetic field BT = 1.7–2.4 T, plasma line averaged density ne = (2.0–4.4) × 1019 m−3, ICRH power (difference value between injected and reflected power) PICRH = 0.73–2.1 MW. The diagnostics used on EAST involved in this paper are summarized as follows [26]: ne is measured by a 3-channel HCN interferometer, BT is measured by flux loops, IP is obtained by the Rogowski loops, Usurf is loop voltage measured by flux loops. Furthermore, the radiated power measurement is given by fast bolometer. Finally, electron temperature and ion temperature are measured by tangential x-ray crystal spectrometer [27].
3. Confinement of hydrogen MH in D plasma
Characterization of energy confinement in tokamak is essential for developing and testing candidate theories and models, which are used for energy confinement and identifying the parameters. Under limited ranges, parameters used in scaling law expression are; total heating power (ohm heating power and auxiliary heating power) P, BT, IP, elongation k, R, a, ne, and isotopic mass M [28]. The strong dependences of τE with ne, IP,  and BT will be investigated respectively in section 3.2. In this section, a method to calculate the energy confinement time, based on the exponential property of the diamagnetic energy is introduced. Results are compared with the ITER89-P scaling law.

3.1. Calculation of the global energy confinement time
In zero-dimensional analysis, the plasma stored energy W evolution measured on EAST by the diamagnetic loops diagnostic, is ruled by the power balance equation [29]

In equation (3),  is the energy confinement time.
And the solution is [30]

In equation (4),  is the starting time of the rise or fall of energy.
  is the energy value at
  and
and  is the final energy value when the energy tends to be constant
 and
and  which can been obtained from the diamagnetic signal, together with
  (assuming an initial value, usually 50 ms) are applied to equation (4), then fitting can been done.
  is then determined by Newton interpolation. Figure 1 shows an example of the fitting. When the curve is perfectly fitted to the diamagnetic energy, the final value of
  can been confirmed.

Figure 1. An example shot of the fitting calculation method.
Download figure:
Standard image High-resolution image3.2. Global characteristics of only H minority ICRH plasmas confinement
The key problem of tokamak research is the accessibility of confinement regimes with  values sufficiently high to reach ignition. Since the ion energy distribution function becomes non-thermal while ICRH is applied, particular care has been devoted to the evaluation of the energy confinement times. In this section, the effect of ne, P, BT and IP on the energy confinement time will be summarized. The energy confinement time values are normalized to the values of the Ohmic phase of the respective discharges—
 where
where  —in order to eliminate or at least significantly reduce isotope effects due to different species compositions (H, D) of the plasmas [2].
Firstly, the global confinement time dependence on plasma line averaged density  was investigated in figure 2. Main parameters for figure 2 are BT = 1.7–2.5 T, IP = 0.4–0.6 MA, ne = (2.0–4.0) × 1019 m−3, PICRH = 1.3–2.0 MW. A change of the particle density (by gas puff, pellets or impurity seeding) during the discharge produces a radial current, implicitly a rotation that can modify the state of confinement. Besides, in reactor-grade plasma, the confinement can be strongly influenced by adequate particle fueling [31].
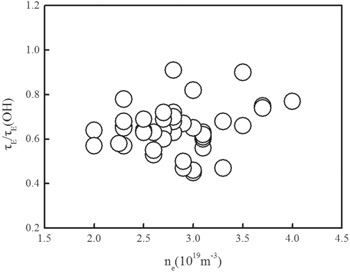
Figure 2. Dependence of energy confinement time (normalized to the value of the Ohmic phase) on plasma line averaged density.
Download figure:
Standard image High-resolution imageAs shown in ITER89-P scaling law energy confinement time is related with total heating power  Considering that when the energy tending to be constant, time derivative of stored energy tends to be zero
  then:
then:
where  is the total absorbed power of plasma due to ohm heating and ICRH,
  is ohmic heating power and η is the heating efficiency of ICRH (will be detailed in section 4). Summarizing a large number of experimental results, as shown in section 4, the averaged heating efficiency of ICRH is estimated as 0.35. In figure 3, the confinement degradation found in regimes with localized and distributed on-axis heating agrees well with ITER scaling predictions (corresponding values
  = 0.45–0.99). Main parameters for figure 3 are BT = 2.24–2.4 T, ne = (2.0–4.4) × 1019 m−3, IP = 0.37–0.46 MA, PICRH = 0.93–2.0 MW. With the increase of P, plasma confinement degrades.
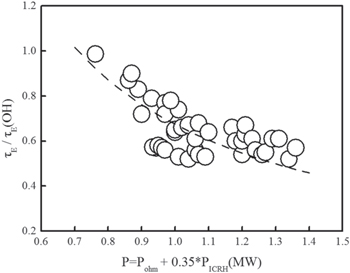
Figure 3. Dependence of energy confinement time (normalized to the value of the Ohmic phase) on total heating power.
Download figure:
Standard image High-resolution imageInfluence of  on BT and IP are shown in figures 4 and 5, respectively. Main parameters involved in figures 4 and 5 are the same with figure 2. The
  increases with BT in these discharges, although BT changes only in three values. Similarly,

Figure 4. Dependence of energy confinement time (normalized to the value of the Ohmic phase) on toroidal magnetic field.
Download figure:
Standard image High-resolution image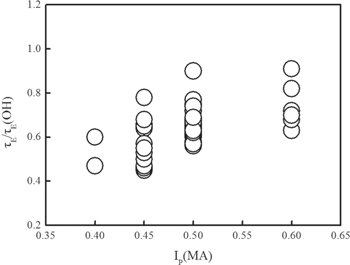
Figure 5. Dependence of energy confinement time (normalized to the value of the Ohmic phase) on plasma current.
Download figure:
Standard image High-resolution image4. Heating efficiency of H MH
With reference to equation (3), the change in the stored energy is very small  when stored energy reaches a maximum. So setting the left side of equation (3) to zero, the heating efficiency
  can be expressed as:

In equation (5),  is the increment of internal stored energy when the ICRH power is applied,
 is the change of ohmic heating power,
  is the increment of the radiated power.
Figure 6(a) shows the variations of heating efficiency with gap between the ICRH antenna and the last closed flux surface. Main parameters for figures 6(a) and (b) are  = 0.4–0.5 MA,
  = (2.0–2.5) × 1019 m−3,
  = 1.14–2.1 MW,
  = 2.4 T. Heating efficiency reaches the maximum value when the gap is around 2 cm. For smaller gaps impurities cause more of the stored energy to be radiated away, which can be seen in figure 6(b). Furthermore, for smaller gaps, experimental results show that the coupling efficiency is reduced due to an increase of the evanescent layer's width [32]. These inosculate with the discovery that the band structure—observed on the lower divertor outer shelf—depends on the gap, perhaps suggesting RF rectification may play a role in the deposition [33]. Unfortunately, compared to what was found in the literature for other machines, ICRH heating efficiency on EAST is much lower. Here are some reasons: on EAST, RF power deposition in the SOL can be large and follows the magnetic field lines from the antenna to divertor regions. Furthermore, the strong SOL deposition and the spiral formation lead to low heating efficiency. Moreover, ICRH transmission line length is about 80 m long, so RF power dissipation on lines due to conductor loss and medium loss is high, RF power transmission system has a low power propagation efficiency [34].

Figure 6. (a) ICRH heating efficiency η as a function of the gap between the ICRH antenna and the plasma last closed flux surface; (b) radiation power along with the change of gap.
Download figure:
Standard image High-resolution imageThe increase of electron and ion temperature are summarized in figure 7, the main plasma parameters are  = 0.45–0.5 MA,
  = 2.3 T,
  = (2.0–3.8) × 1019 m−3,
  = 0.52–1.57 MW. The increase of central electron temperature due to ICRH power is found to be significantly higher than that of the central ion temperature, which agrees qualitatively with theoretical expectations [35]. In H MH scenario, ICRH can create high energy H+ ions, which slow down through Coulomb collisions with electrons, giving rise to strong electron heating at the fundamental resonance layer [36].
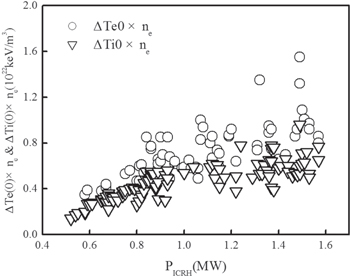
Figure 7. Scatterplot of  and
and  (in 1022 keV m−3) indicative of the increase of plasma electron energy density and ion energy density versus applied ICRH power (in MW) obtained with the ICRF antenna system on EAST.
Download figure:
Standard image High-resolution imageFurthermore, the electron and ion temperatures in EAST experiments are also summarized in figure 8. The main parameters are the same as for the data shown in figure 7. The figure shows the central electron and ion temperatures against the rate of power per particle by  . The maximum of central electron temperature increment is 0.45 keV result from the ICRH power, which is larger than ions one, indicating that strong electron heating was found in fundamental heating of a hydrogen minority in D majority plasma on EAST.
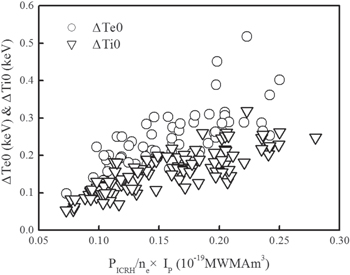
Figure 8. Increment of central electron and ion temperatures plotted against power per particle times  The proportionality to current takes account of the scaling of confinement with
Download figure:
Standard image High-resolution imageFigure 9 shows a typical shot of the ICRF heating in combination with lower hybrid wave (LHW) injection, which includes the time evolution of plasma stored energy, total radiated power, loop voltage, plasma line averaged density, and power of ICRH and LHW. The plasma is sustained by the ICRH and LH (4.6 GHz) heating. It was obvious that the plasma stored energy and total radiated power rose significantly and the other parameters such as plasma density and the LH power almost remain constant during the injection of ICRH power.

Figure 9. Typical shot of the ICRF heating in combination with lower hybrid wave injection, the LH power is not changing during the ICRF pulse.
Download figure:
Standard image High-resolution imageFigure 10(a) shows the dependence of ICRH efficiency on ne under different auxiliary heating conditions. Main parameters for figures 10(a) and (b) are  = 0.45–0.5 MA,
  = 0.82–2.6 MW,
  = 0.74–1.71 MW,
  = (2.0–4.0) × 1019 m−3,
  = 2.3 T. The ICRF heating in combination with LHW injection produced a higher heating efficiency. As shown in figure 9, the LH power is not changing during the ICRF pulse. Furthermore, the increment of the stored energy and the total radiated power are due to ICRH power injection. In figure 10(a), the heating efficiency increases with the increase of ne. An increase in density leads to: 1) an increase in collision rates between electrons and ions; 2) an increase in antenna loading resistance
  ; and 3) modify the confinement. The heating efficiency is significantly improved with the increase of ne. Besides, the heating efficiency can be improved by combining ICRH with LH heating [37]. The dependence of the global ICRH efficiency on ne is also illustrated in figure 10(b). Considering the increase of plasma energy content per megawatt of ICRH power launched, it increases with the density. And it has been found to depend on the other target plasma conditions, such as temperature and impurity level. Moreover, the global ICRH efficiency is found to be higher in ICRF and LH heated plasmas than in purely ICRF heated plasmas.

Figure 10. (a) The dependence of ICRH heating efficiency calculated by equation (5) on ne; (b) heating efficiencies of ICRH, defined as the increase of plasma energy content per launched megawatt of ICRH power,  versus ne.
Download figure:
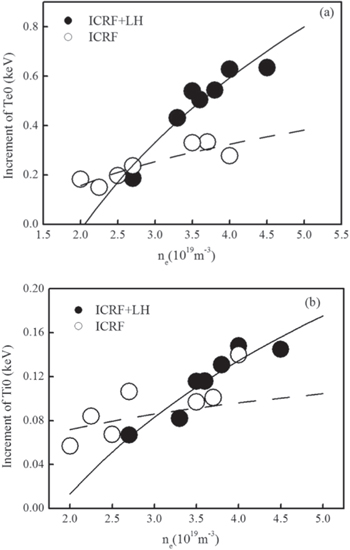
Standard image High-resolution imageFigure 11 summarizes the increase of electron and ion temperature of ICRH discharges and ICRH+LHW discharges. The main plasma parameters are same with figures 10(a) and (b). With the increase of ne, electron temperature and ion temperature increase and electron temperature rise more. Furthermore, electron and ion temperatures increase larger when the plasma is heated by a combination of ICRF and LH, which corresponds to the higher heating efficiency of ICRH under this condition.
Figure 11. (a) The increase of electron temperature due to ICRH versus the average line density ne; (b) the increase of ion temperature due to ICRH versus the average line density ne.
Download figure:
Standard image High-resolution image
5. Conclusions
The heating and confinement characteristics with ICRH were investigated in detail in Ohmic heated target plasmas and in plasmas where ICRH was combined with LHW. The energy confinement time increases with plasma current and magnetic field and decreases with the heating power. The results obtained show L-mode confinement that is in good agreement with the ITER89-P empirical scaling expressions. Besides, heating in the MH scheme has been found to be efficient, the heating efficiency has been estimated to be around 35%. ICRF core heating efficiency is low perhaps due to RF edge deposition along the magnetic field lines in the SOL, as seen on NSTX, and the large loss in the long transmission lines. The noteworthy, ICRH specific impurity problems, such as the strong release of heavy metal impurities, are mitigated by extensive lithiumisation. However, impurity is still another important topic of further investigations.
Acknowledgments
The authors would like to acknowledge the support of the EAST operation and diagnostics group. This work was supported partly by National key research and development program (grant nos 2016YFA0400600 and 2016YFA0400601). This work was supported partly by National Magnetic confinement Fusion Science Programme (grant nos 2015GB101001 and 2013GB106001B). This work was also supported partly by the National Natural Science Foundation of China under grant nos 11375235, 11675213 and 11375236. This work was supported partly by the JSPS-NRF-NSFC A3 Foresight Program in the field of Plasma Physics (NSFC no. 11261140328). Gary Taylor and Joel Hosea are supported at PPPL by US DoE contract no DE-AC02- 09CH11466. Y Lin and S Wukitch are supported at MIT by US DoE contract no DE-FC02-99ER54512.