
Abstract
Objective. To explore noise characteristics and the effect physiological activity has on the link between impedance and noise. Approach. Dry-printed electrodes are emerging as a new and exciting technology for skin electro-physiology. Such electrode arrays offer many advantages including user convenience, quick placement, and high resolution. Here we analyze extensive electro-physiological data recorded from the arm and the face to study and quantify the noise of dry electrodes, and to characterize the link between noise and impedance. In particular, we studied the effect of the physiological state of the subject (e.g. rapid eye movement sleep) on noise. Main results. We show that baseline noise values extracted from dry electrodes in the arm are in agreement with the Nyquist equation. In the face, on the other hand, the measured noise values were higher than the values predicted by the Nyquist equation. In addition, we studied how different electrode properties affect performances, including electrode size, shape, and material properties. Significance. Altogether, the results presented here provide a basis for understanding dry electrode performances and substantiate their great potential in electro-physiological investigations.
Export citation and abstract BibTeX RIS

Original content from this work may be used under the terms of the Creative Commons Attribution 4.0 licence. Any further distribution of this work must maintain attribution to the author(s) and the title of the work, journal citation and DOI.
1. Introduction
Dry-printed electrodes for electro-physiological monitoring are gaining increased attention owing to a range of benefits over gel electrodes (Acar et al 2019, Huttunen et al 2022, Reis Carneiro et al 2022, Xie et al 2022). Foremost, is their stability and simplicity, as they do not require gel application and are easy to place on the body. Furthermore, dry electrodes benefit from a great design versatility that can optimally accommodate a wide range of applications, such as facial EMG (Inzelberg and Hanein 2019, Inzelberg et al 2020), gait analysis (Popović et al 2019), gesture recognition (Ben Ari et al 2023), and sleep monitoring (Shustak et al 2019, Oz et al 2023). With the ease of their application to the skin, thin dimensions and dry nature, these electrodes are ideal for electro-physiological investigations of freely behaving humans (Inzelberg and Hanein 2019). However, as dry electrodes have no gel to mediate the contact between the electrode and the skin, the skin-electrode impedance is a major concern and special care has to be directed to designing the electrode arrays (Bareket et al 2016, Kam et al 2019).
Baseline noise is one of the most critical parameters in electro-physiological measurements, in particular in applications where very low signals (in the μV range) are anticipated. Commonly, noise values are predicted from the electrode-skin impedance which is used to quantify the quality of the interface and to predict contact quality (Grimnes 1983, Huigen et al 2002, Kim et al 2014, Krachunov and Casson 2016, Roy et al 2020, Pîslaru-Dănescu et al 2022, Xie et al 2022). In wet electrodes, the conducting gel reduces the skin-electrode impedance and ensures low baseline noise levels (Li et al 2017). In EEG, the gold standard is 5–10 kΩ at 30 Hz (Lee et al 2021). In EMG, reported numbers vary considerably, owing to large variability in experimental conditions primarily electrode position and signal amplitude.
Indeed, the electrode skin impedance is expected to be affected by various parameters. One crucial parameter is the electrode position on the body (e.g. hand, neck, face). Specifically, significant differences in impedance values of wet electrodes were observed between cephalic skin and palmar skin (Picton and Hillyard 1972). More recently, Bora and co-workers (Bora and Dasgupta 2020) measured the contact impedance (CI) at 10 different body locations showing that impedance values in the face have the highest inter-subject variability. Kappel et al measured the impedance at two different areas of the ear and demonstrated a significant change in impedance values (Kappel et al 2019). Skin electrodes also tend to show a process of time-dependent stabilization (Levit et al 2023). Previous investigations showed that impedance values in the scalp were 15–50 kΩ · cm2 before stabilization and after 15 min, the impedance was reduced to 5–15 kΩ · cm2. In the realm of dry electrodes, several recent investigations reported novel electrode materials and fabrications for bio-potential measurements. Impedance values are within the range obtained with gel electrodes suggesting that good signal-to-noise ratio (SNR) values could be obtained (see table 1).
Table 1. Impedance values and noise for EMG and EEG frequency bands, from the head and neck a .
| Electrode type | Surface area (mm2) | CI (10 Hz) (kΩ) | Norm. CI (10 Hz) (k Ω · mm2) | CI (30 Hz) (kΩ) | Norm. CI (30 Hz) (kΩ · mm2) | RMS Noise (μV) | Source |
|---|---|---|---|---|---|---|---|
| 88 | <3 | 260 | <2 | 16 | 8 (EEG) | ||
| 110 | <3 | 340 | <2 | 230 | 5 (EEG) | ||
| 3D-printed polylactic acid coated with silver | 140 | <3 | 410 | <2 | 280 | 16 (EEG) | Krachunov and Casson (2016) |
| 64 | <4 | 250 | <2 | 130 | 16 (EEG) | ||
| 28 | <4 | 110 | <2 | 56 | 6 (EEG) | ||
| Drytrode (Ag/AgCl dry) | 31 | <2 | 62 | <2 | 62 | 1 (EEG) | |
| Polyimide-based flexible microneedle array (PI-MNA) by micromolfding | 36 | 4 | 150 | 4 | 130 | <10 (EMG) | Li et al (2022) |
| Polyimide-based flexible microneedle array (PI-MNA) by micromolding coated with Au | 36 | 110 | 4000 | 56 | 2000 | <10 (EMG) | |
| Pre-gelled Ag/AgCl J92SG (Covidien) | 1900 | 250 | 480 000 | — | — | 150 (EMG) | |
| Polyamide coated with silver textile electrode | 1600 | 180 | 280 000 | — | — | 130 (EMG) | |
| 630 | 330 | 200 000 | — | — | 130 (EMG) | ||
| 23% copper, 20% nickel and 57% polyester textile electrode | 1600 | 450 | 720 000 | — | — | 130 (EMG) | Kralikova et al (2022) |
| 630 | 650 | 410 000 | — | — | 130 (EMG) | ||
| 17% silver and 83% nylon textile electrode | 1600 | 580 | 930 000 | — | — | 130 (EMG) | |
| 630 | 770 | 48 000 | — | — | 130 (EMG) | ||
| Dry screen-printed SCa | 64 | 140–670 | 9000–42 000 | 93–430 | 5900–28 000 | 4.8 (EMG) | This study |
| 7.2 (EEG) | |||||||
Although impedance values of dry electrodes were previously reported, studies focusing on noise are scarce. This gap is particularly challenging as the link between impedance and noise is not straightforward (Huigen et al 2002). Primarily, although it is common to attribute the noise to thermal noise associated with the skin-electrode interface impedance (Nyquist equation), this link was not substantiated in measurements performed with wet electrodes. Clearly, a similar investigation is needed for dry electrodes. In this paper, we revisit Huigen et al (2002) to explore the link between electrode-skin impedance and noise in dry electrodes. To do so, we conducted extensive mapping of electrode-skin impedance and noise values under various conditions. The noise was derived from the baseline of multiple electro-physiological sessions. To explore whether thermal noise plays a dominant role we used data recorded from the face and the hand and compared it with thermal noise values derived from impedance measurements. Finally, impedance values of different electrodes were measured to explore the effect of size, location, and material properties.
2. Methods
2.1. Electrodes
Four electrode types were used in this investigation: Commercial pre-gelled electrodes, inkjet-printed PEDOT:PSS electrodes, screen-printed carbon electrodes (soft and hard), and inkjet-printed carbon electrodes.
2.1.1. Commercial pre-gelled Ambu
Commercial pre-gelled Ambu electrodes of 40 mm in diameter (Ambu BlueSensor Q ECG electrodes) were used. These electrodes contain a wet gel area in the silver/silver chloride sensor region and an adhesive surrounding to stick them into the skin.
2.1.2. Inkjet-printed PEDOT:PSS electrodes
A fabrication process for inkjet-printed electrodes was used as described previously (Levit et al 2023). In short, a PixDro LP50 inkjet printer was used to fabricate silver—poly(3,4-ethylene dioxythiophene):polystyrene sulfonate (PEDOT:PSS) dry electrodes on TPU substrates. The substrates were of the same type as the ones used for the screen-printed samples. To optimize ink wetting, the TPU was heated in a vacuum oven (120 °C for 10 min, 5 mbar, Memmert VO) and subsequently treated in an Ar plasma oven (Pico, Diener) for 30 s. All inks were filtered through a 0.45 μm PVDF filter prior to deposition. The silver ink (Silverjet, Sigma-Aldrich) was printed with a Sapphire QS-256/10 AAA printhead (drop volume of 10 pL, Fujifilm) at a resolution of 1000 dpi and cured on a hotplate at 120 °C for 5 min.
Before the deposition of the second layer (PEDOT:PSS), the samples were treated with an additional 60 s of Ar plasma. The PEDOT:PSS ink (Clevios F HC Solar, Heraeus) was degassed in an ultrasonic bath for 20 min and then printed with a Dimatix Materials Cartridge (10 pL, Fujifilm; 1200 dpi). Subsequent heat treatment on a hotplate (120 °C, 10 min) was used to enable the crosslinking process of the (3-Glycidoxypropyl)methyldiethoxysilane in the ink (for details see (Levit et al 2023)) and thereby increase the resistance to water and delamination of the PEDOT:PSS film. Finally, a double-sided adhesive was used as passivation and the samples were mounted on a printed circuit board (PCB) analogously to the screen-printed carbon electrodes.
2.1.3. Screen-printed carbon electrodes
Screen-printed carbon electrodes for electrophysiological and bio-impedance measurements were fabricated as described previously (Inzelberg and Hanein 2019, Inzelberg et al 2020). First, electrodes traces were screen-printed with silver ink (from Creative Materials) (125-13T) on 50 and 80 μm polyurethane sheet (Breathable transparent medical grade polyurethane/urethane/TPU film on a paper carrier from DelStar Technologies, Inc.). Following silver printing, films were dried on a heater at 50 °C for 15 min. Next, carbon electrodes (124-50 T and C200 (Creative Materials)) were printed in alignment with the silver traces. Next, the printed electrodes were dried again on the heating plate at 50 ◦C for 15 min. After printing, traces were passivated with a double adhesive 80 μm PU film (from Delstar EU94DS) which was cut to leave the carbon electrodes exposed. For impedance measurements, the arrays were bonded to metallic traces on a custom-made printed circuit board (PCB) which was designed to support BNC connections.
2.1.4. Inkjet-printed carbon electrodes
Inkjet-printing of the carbon electrodes was performed using the industrial inkjet printer njet lab of Notion Systems GmbH (Schwetzingen, Germany) with an industrial Konica Minolta KM1024i print head. PU substrates (Delstar EU94DS) were first activated by UV ozone treatment. After this pretreatment, two layers of the silver ink Ag-LT-20 (Fraunhofer IKTS, Dresden, Germany) were printed at a resolution of 720 dpi and sintered in an oven at 150 °C. These silver structures serve as conductor paths and contact pads. Onto these structures, the electrodes were then printed with the carbon ink JR-700HV (Novacentrix, Austin, USA). Two layers of carbon were printed at a resolution of 720 dpi. The carbon electrodes were larger than the underlying silver to guarantee the covering of the entire silver in the electrode area, which is in contact with the skin. After printing, a pre-structured medical grade double-sided adhesive (3M 1524) was laminated on the PU substrate with the electrodes. This tape has openings in the electrode areas and acts as an insulation layer and as an interface to the skin (Velten et al 2021).
2.1.5. Electrode rigidity characterization
A set-up for rigidity characterization of the flexible electrodes was developed to assess the mechanical properties of various electrode configurations and material combinations. The test samples were placed on a metal block that comprised two small holes with 1 mm diameter and was connected to a pump (supplementary figure A1). Negative pressure sucked the foil samples (one without and one with printed layers) into the small hole. Pressure differences of 250, 500, and 750 mbar were applied and the resulting deformation of the samples was directly measured by a mechanical profilometer (DektakXT Stylus). The test samples comprised carbon electrodes, silver electrodes, and combinations of carbon and silver, each produced on a 80 μm thin PU film by screen-printing and inkjet-printing.. All samples showed the expected linear deformation behavior and the measurements demonstrated the dependency of the extent of deformation on the layer thickness (supplementary figure A1). The thickest screen-printed electrode (C200) had the lowest flexibility, whereas the thinner screen-printed electrodes (silver and carbon) and the inkjet-printed electrodes from one single material (carbon or silver) were most deformed. The thin inkjet-printed structures with thicknesses below 10 μm have a similar influence on the deformation as the thicker screen-printed structures.
2.2. Impedance measurements
Bio-impedance measurements were performed with MFIA Impedance Analyzer (Zurich Instruments) on the skin of 6 healthy volunteers (3 male and 3 female). Bio-impedance measurements were conducted under 2-terminal (2T) conditions in the 1–1000 Hz range. Electrodes were connected to the MFIA impedance analyzer and the impedance was measured 10 min after placement to allow electrodes-skin interface stabilization. The skin surface was cleaned thoroughly with an alcohol pad prior to electrode placement. For the bio-impedance measurements, as well as their corresponding bio-potential measurements, participants were sitting at a resting position. When measurements were taken from the forearm the participant's arm was relaxed and placed comfortably on a table.
Thermal noise is evaluated from the Nyquist formula (Huigen et al 2002):

where kB is the Boltzmann constant, T is the temperature, B is the bandwidth and R is the resistance. At room temperature the thermal noise is given by Huigen et al (2002):

where the units are  .
.
We compared the thermal noise to the 'measured noise', which we dub as the spectrum bio-potential signal. A 50 Hz notch was applied to the signal before the spectrum was calculated. Then, using Welch's method, the spectrum was calculated over a segment of 30 s. We evaluated the similarity between the estimated (thermal) noise and the measured noise using relative difference (in percentage relative to the relax/REM state). Not to skew the measure, detected peaks in the spectra originating from harmonic noise were smoothed (substrating running average).
2.3. Electrophysiology and noise analysis
We used baseline noise extracted from two data sets: Forearm EMG (16 electrodes, 73 sessions, 14 subjects—7 females and 7 males) from a finger gesture recognition study (Ben Ari et al 2023) and facial EMG (8 electrodes, 18 sessions, 12 subjects—4 females and 8 males) from a sleep study (Oz et al 2023). In the sleep study, participants were lying in bed. In the finger gesture recognition study, sEMG signals were measured with participants in three positions: With the hand resting comfortably on the table while the participant was sitting, with the hand in an upright position on the table while the participant was sitting, and with the hand resting comfortably by the participant's side while the participant was standing.
Data were recorded with a miniature wireless data acquisition unit (DAU, X-trodes Inc.), which was developed to allow electrophysiological measurements under natural conditions. The DAU supports up to 16 unipolar channels (2 μV noise root-mean-square (RMS), 0.5–700 Hz) with a sampling rate of 4000 S s−1, 16 bit resolution, an input range of ±12.5 mV and input impedance of 107 Ω. A 620 mAh battery supports DAU operation for a duration of up to 16 h. A Bluetooth (BT) module is used for continuous data transfer. The DAU is controlled by an Android application and the data are stored on a built-in SD card and on the Cloud for further analysis. The DAU also includes a 3-axis inertial sensor in order to measure the acceleration of the hand during the measurements.
The noise level was assessed within the frequency ranges: 0.3–35 Hz for EEG bandwidth and 30–350 Hz for EMG bandwidth. To extract the desired signals, a 4th-order bandpass filter was applied, with the respective cutoff frequencies. Additionally, a 4th order 50 Hz notch filter was applied to eliminate interference and its harmonics. The baseline noise was calculated for four different stages and modalities: Wake stage, rapid eye movement (REM) sleep stage using the sleep array, and forearm EMG.
For the Wake stage, the median RMS was determined based on the lowest 10 s of activity during 2 min of relaxation with eyes closed. This phase is characterized by relaxed muscles and the absence of eye movements, allowing the evaluation of noise levels during this quiet period. In the REM stage, the median RMS values were calculated from the lowest 10 s across all REM epochs, which were scored by sleep specialists. During REM stages, the absence of muscle atonia allows for evaluating baseline noise with minimal muscle activity. In the case of forearm EMG, the median RMS was computed for the relaxation time intervals between sessions of performing different hand gestures. Calculations were performed using a Python code.
2.4. Participants
All experiments on human skin were conducted on volunteers in accordance with relevant guidelines and regulations under approval from the Institutional Ethics Committee Review Board at Tel Aviv University (approvals 0005229-1 and 0004877-2) and the Institutional Ethics Committee Review Board at Tel Aviv Sourasky Medical Center, (approval 0336-20) in accordance with the Helsinki guidelines and regulations for human research. Informed consent was obtained from all subjects. The authors confirm that any identifiable participants in this study have given their consent for publication.
3. Results
Bio-potential measurements with soft and dry electrode arrays are typified by a high SNR and stability against mechanical artifacts (Bareket et al 2016, Inzelberg et al 2020). Figures 1(a)–(d) shows several examples of bio-potential signals recorded with screen-printed dry carbon electrodes: (a) EEG alpha waves recorded from the forehead during relaxation with eyes closed, (b) EOG REM patterns recorded with electrodes positioned at close proximity to the eyes and (c) EMG signals recorded from the chin during swallowing (calibration step), and (d) EMG recorded from the arm during finger gesturing. Figures 1(e) and (f) show the electrode arrays used to capture the signals from the face figures 1(a)–(c) and the arm figure 1(d), respectively. Electrodes were 9.5 and 4.5 mm in diameter for the facial and forearm arrays, respectively.
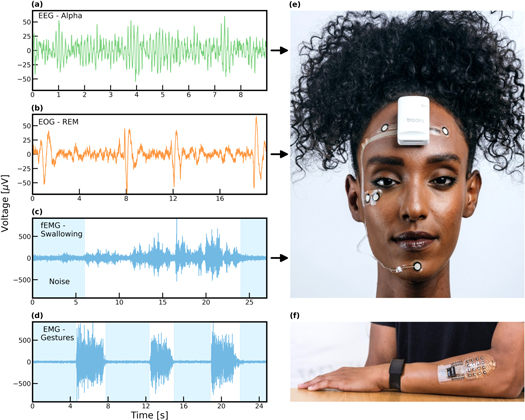
Figure 1. Screen-printed carbon electrode arrays for EEG and EMG applications demonstrate high SNR. (a) EEG signal recorded from the forehead during relaxation. (b) EOG signal recorded at close proximity to the eyes during REM. (c) EMG signal recorded from the face. (d) EMG signal recorded from the forearm. Shaded areas in the data indicate noise. (e) Facial EMG array. (f) EMG array on the forearm.
Download figure:
Standard image High-resolution imageAlthough SNR is an important parameter, it is limited in comparing different electrode technologies. Signal values vary markedly (i.e. depending on the subject and measured activity) and evaluation of data quality from SNR values is insufficient. Therefore, baseline noise estimates are needed. Here we use data from two multi-subject multi-session studies, in which we collected an extensive amount of noise data with the dry carbon electrodes (the results are published elsewhere, (Oz et al 2023)):
A sleep study (Oz et al 2023) with 18 sessions using the facial array (1(e)), and a finger gesture recognition study (Ben Ari et al 2023) (73 sessions) using a 4 by 4 electrode array (figure 1(f)). Importantly, all recorded sessions started with an initial calibration stage that included a relaxation period which was used to evaluate the baseline signal.
Baseline noise can be readily estimated from low-activity sections of the data as can be seen in figure 2. Yet, a major interfering factor in such measurements is residual electro-physiological activity (i.e. muscles, heart, brain) that may contribute to higher than expected noise values (Yacoub et al 1995, Huigen et al 2002). To demonstrate this challenge, we analyzed bio-potential data recorded before and during REM sleep. Owing to muscle atonia, typical for REM sleep in healthy individuals, EMG, EOG, and EEG signals during REM show reduced baseline, compared with other sleep stages (see figure 2 for a comparison of REM versus wakefulness recordings). Notably, the histogram of noise values (figure 2 lower panel) demonstrates the significant difference in the baseline noise that is due to changes in physiological conditions (REM: 4.8 μV versus wakefulness: 9.0 μV for EMG).
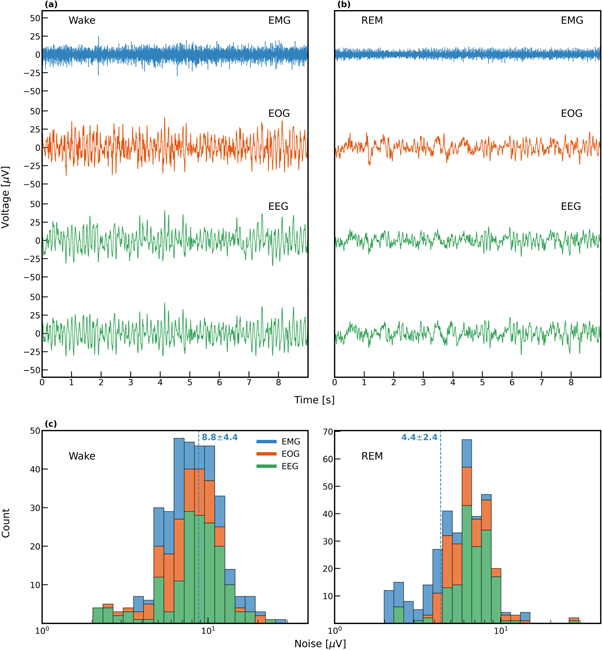
Figure 2. The effect of physiological condition on noise. EEG, EOG, and EMG data during wake (a) and REM (b) recorded with 9.5 mm dry carbon electrodes. (c) Histogram of noise levels for different dry electrodes. EEG and EOG noise levels was calculated for 0.3–35 Hz and EMG was calculated for 30–350 Hz.
Download figure:
Standard image High-resolution imageNoise values are commonly estimated using the Nyquist equation ( ), although its accuracy in physiological measurements is under debate. Specifically, it was previously argued that noise values measured in gel electrodes at rest are significantly higher than those expected from the Nyquist equation (Fernández and Pallás-Areny 1992, Yacoub et al
1995, Huigen et al
2002). Here we revisit this observation for dry electrodes in the EMG and EEG frequency bands, both at the face and the arm. We hypothesized that the previously reported discrepancy in physiological noise is associated with the electrode's location. Figure 3(a) shows measured noise spectra, of carbon electrodes positioned on the forearm during fist clenching (orange) and rest (green). The spectra were evaluated on bio-potential signals (with 50 Hz notch filter) over 30 s. Also plotted are the estimated noise derived from a two-terminal impedance measurement from the same location (blue), and the amplifier noise, obtained by short-circuiting the inputs (purple). As expected, during muscle activity (fist clenching) the signal increases in the EMG frequencies. Importantly, during relaxation, the measured noise (green) shows good agreement with the estimated noise (blue). Additionally, the magnitude of the thermal noise and the amplifier noise are close (approximately 20% averaged over the entire frequency range). The overall measured noise is the square root of the sum of the squares of the different noise sources including that of the amplifier, the skin-electrode interface thermal noise, and the physiological background noise. Since the amplitude of the amplifier noise is relatively low under most conditions, its contribution is generally insignificant. A similar measurement was performed with inkjet-printed carbon and is shown in supplementary figure C2.
), although its accuracy in physiological measurements is under debate. Specifically, it was previously argued that noise values measured in gel electrodes at rest are significantly higher than those expected from the Nyquist equation (Fernández and Pallás-Areny 1992, Yacoub et al
1995, Huigen et al
2002). Here we revisit this observation for dry electrodes in the EMG and EEG frequency bands, both at the face and the arm. We hypothesized that the previously reported discrepancy in physiological noise is associated with the electrode's location. Figure 3(a) shows measured noise spectra, of carbon electrodes positioned on the forearm during fist clenching (orange) and rest (green). The spectra were evaluated on bio-potential signals (with 50 Hz notch filter) over 30 s. Also plotted are the estimated noise derived from a two-terminal impedance measurement from the same location (blue), and the amplifier noise, obtained by short-circuiting the inputs (purple). As expected, during muscle activity (fist clenching) the signal increases in the EMG frequencies. Importantly, during relaxation, the measured noise (green) shows good agreement with the estimated noise (blue). Additionally, the magnitude of the thermal noise and the amplifier noise are close (approximately 20% averaged over the entire frequency range). The overall measured noise is the square root of the sum of the squares of the different noise sources including that of the amplifier, the skin-electrode interface thermal noise, and the physiological background noise. Since the amplitude of the amplifier noise is relatively low under most conditions, its contribution is generally insignificant. A similar measurement was performed with inkjet-printed carbon and is shown in supplementary figure C2.
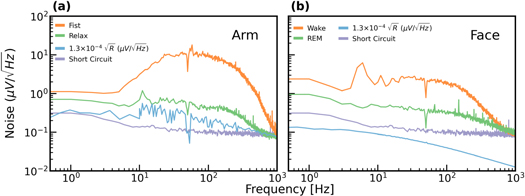
Figure 3. Thermal noise (0.13  ) and measured noise (over 30 s) versus frequency. (a) For the forearm during muscle activity and rest. (b) For the face during alpha activity and REM.
Download figure:
Standard image High-resolution imageNext, we compared the estimated and measured noise of electrophysiological signals recorded from the face. Figure 3(b) presents the thermal and measured noise (the spectra) versus frequency for carbon electrodes positioned on the face during wake (the subject was in bed and just before falling asleep) and during REM sleep. The wake segment (orange) has a clear alpha peak and significant tonic EMG activity (even though the subject was in a relaxed state, as evident by the alpha signature). The spectrum (measured noise) of the REM segment (green) has no EMG activity, and thus the noise is significantly reduced compared to the spectra during wakefulness. As in the case of the arm, muscle activity increases the noise, compared to the relaxed state. However, unlike the arm, the difference between the estimation (derived from the Nyquist equation) and the measured noise is much more pronounced, in particular for the low-frequency range. Lastly, we make note that the estimated noise, derived from the Nyquist equation and two-terminal skin-electrode impedance measurement is lower than the amplifier noise (as also reported in Maji and Burke (2021)). The difference between the two quantities increases with frequency. In the face, the noise of the amplifier is the limiting factor, and lowering the skin-electrode impedance does not greatly impact the overall measured noise.
To generalize these results, in table 2, we summarize baseline noise levels for screen-printed carbon electrodes (4.5 and 9.5 mm positioned at the arm and face, respectively) from multiple recording sessions (73 forearms EMG and 18 sleep sessions, see Methods). For each such session, a low-activity (relax) period was automatically identified and the RMS value of the noise was calculated. Typical EMG noise (30–350 Hz) values were 8.3, 9.0, and 4.8 μV for the arm, the face during wake, and during REM respectively. Typical EEG noise (0.3–35 Hz) was 9.9 and 7.2 μV for wake and REM respectively. Comparing the estimated and measured noise it is evident that in the forearm, unlike the face, measured noise values are closer to their predicted values in a relaxed state (relative difference of 27% and 87% in the forearm and face respectively, see supplementary figures D1–D2 for additional examples). In the face, even in REM where muscle activity is reduced, noise values are still higher than expected, especially in the low-frequency range, indicating the effect of other ongoing physiological activity on baseline values.
Table 2. RMS noise in the EEG (0.3–35 Hz) and EMG (30–350 Hz) bands measured from baseline noise at different locations. Sleep study sessions: 18 sessions, 8 electrodes, forearm study: 73 sessions, 16 electrodes.
| Location | State | Noise (μV) | Noise (μV) |
|---|---|---|---|
| (0.3–35 Hz) | (30–350 Hz) | ||
| Face | Wake | 9.9 ± 3.5 | 9.0 ± 3.7 |
| Face | REM | 7.2 ± 2.9 | 4.8 ± 2.2 |
Face ( ) ) | Rest | 0.61 ± 0.055 | 1.04 ± 0.14 |
| Outer forearm | Rest | 6.2 ± 5.2 | 8.3 ± 3.7 |
Outer forearm ( ) ) | Rest | 3.5 ± 0.15 | 8.4 ± 0.14 |
Having established the complex link between baseline noise and the impedance of screen-printed electrodes, we now turn to explore in more detail electrode impedance values, focusing on how different parameters affect the impedance and whether it is possible to identify parameters that may contribute to better electrode performances. We tested several alternative dry electrodes to study the effect of electrode material on the skin-electrode impedance: screen-printed (harder (C200) carbon, and softer (124–50 T) carbon inks) carbon, inkjet-printed carbon and inkjet-printed PEDOT:PSS electrodes. For simplicity, we performed most of the impedance measurements of the printed electrodes at the neck and the arm with varying electrode parameters: electrode size, passivation size, printing ink, passivation shape, and PU thickness film.
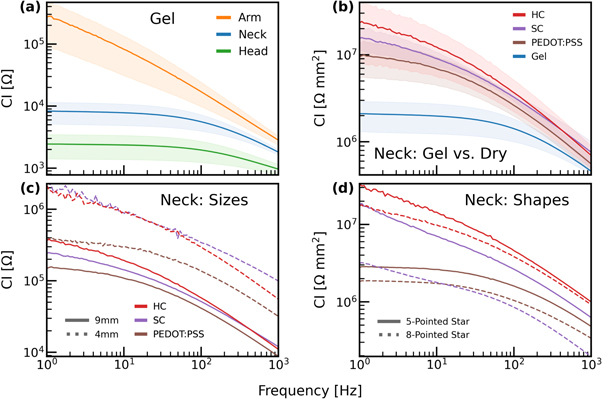
As a reference, we first present the behavior of commercial gel electrodes. In figure 4(a) we show the CI of gel electrodes at three different positions: arm, neck, and forehead for one subject. The results show that the arm demonstrates higher impedance values than the forehead and the neck, in agreement with previous reports (Bora and Dasgupta 2020). Impedance values at the neck are higher than the forehead but share with the face a similar frequency dependence. In figure 4(b) we compare the commercial gel electrodes alongside the three types of dry electrodes (PEDOT:PSS, soft carbon, and hard carbon) at the neck (values are normalized by the area of the electrode). The diameter of the commercial gel electrodes is 18 mm, and the diameter of the dry electrodes is 9 mm. Notably, the gel electrodes have a lower CI compared to all of the dry electrodes. However, this difference is reduced following normalization. In particular, close to the 1 kHz, the impedance of the different electrode types converges, suggesting negligible differences for higher frequencies. Moreover, while the difference between the dry electrodes is not striking, it should be noted that the hard carbon has the highest impedance values, followed by the SC, and finally PEDOT:PSS. Evaluation of inkjet-printed carbon compared to SC and gel electrodes is shown in Supplementary figure C1.
Figure 4. (a) Contact impedance of gel electrodes for varying locations (arm, neck, and head). (b) Comparison of the gel versus dry electrodes at the neck, normalized by area. Shaded areas indicate the variance across repetitions. (c) Comparison of dry electrodes for 9 and 4 mm (at the neck). (d) Comparison of dry electrodes for different star shapes (at the neck).
Download figure:
Standard image High-resolution image
Figure 4(c) shows the dependence of the CI on size. As expected, electrode size is negatively correlated with impedance values (i.e. big electrodes show small impedance values), independent of the electrode type. Of note, at 4 mm diameter, the soft and hard carbon electrodes have similar impedance values, and the PEDOT:PSS electrode has the lowest impedance. To evaluate the impact of the shape on the impedance values, we designed and tested two-star shapes: 5-pointed star and 8 pointed-star (see supplementary figure E1). Figure 4(d) shows the impedance values for both shapes (dry electrodes), at the neck, normalized by area to exclude the influence of the electrode surface area on the measurements. We observe that the 8-pointed star shape has lower impedance values. The superiority of the larger electrode size as well as the 8-pointed star shape is independent of the type of electrode used and is likely to be associated with the manner by which the dry electrode achieves conformal contact with the skin. Furthermore, the three dry electrodes appear to exhibit a distinct dependence on frequency. This is most apparent when comparing the slope of the carbon electrodes relative to the PEDOT:PSS electrodes. The PEDOT:PSS electrode has a flatter slope for very low frequencies (up to 10 Hz), compared to the carbon electrodes which exhibit a sharper trend. Further comparison of 9 mm, 4 mm, 5-pointed and 8-pointed star, across PEDOT:PSS, SC and HC, is shown in supplementary figure B1.
4. Discussion
In this investigation, we presented the performances of dry-printed electrodes for electrophysiological applications, specifically focusing on impedance and noise values. Here we make the distinction between printed dry electrodes which are made via a printing process (i.e. screen-printing or inkjet-printing) on soft substrates, and a wide range of other dry electrodes which have been suggested in the past and utilize a wide range of fabrication techniques (e.g. casting, microelectromechanical (MEMS) fabrication) (Fu et al 2020, Niu et al 2021). We showed that normalized impedance values of screen-printed carbon and inkjet-printed PEDOT:PSS are similar to those obtained with gel electrodes. Furthermore, the dry-printed electrodes presented here appear to show many of the hallmarks of gel electrodes: Strong dependence on size, strong dependence on position on the body, and large variability between subjects and experiments. Of the various systems we characterized, inkjet-printed PEDOT:PSS electrodes appear to have the lowest impedance values and appear to be excellent candidates for future applications. What is more, the dry-printed electrodes are printed on soft substrates allowing both easy and quick placement of large arrays and high conformity on the skin. The conformity in particular, enables subjects to move without hindering the quality of the measurement. Overall, with their excellent stability on the skin along with their stable and low noise levels, dry-printed electrodes are indeed an excellent alternative technology for many electro-physiological applications.
The main focus of our investigations was the analysis of noise values under different physiological conditions. We showed that physiological states can have a major impact on noise. In the forearm, muscle activation, as expected, impacts noise levels even at very low frequencies. In the face, noise during sleep is lower than baseline noise during wake but still higher than expected thermal noise values. An interesting and puzzling phenomenon is the persistent physiological noise under what is seemingly rest conditions. Initial measurements exploring this phenomenon are presented in the supplementary material (figure D2). By exploring the noise at different locations, and different electrode sizes (figure D1) we can clearly see locations where there is almost no discrepancy between the measured and calculated noise (Nyquist), while in some regions a clear discrepancy is observed (for example comparing the face to the arm). To explore if this issue is affected by blood pulsation, as a possible source of noise, we looked at nearby electrodes positioned on the wrist (figure D3) and how their noise was affected by blood flow blockage. Some electrodes show a pronounced increase in the noise in response to blood blockage. A possible origin for this behavior is proximity to blood vessels and their effect on the low-frequency noise (figure D3). In the face, matters are more complex: although we expect blood flow to affect the measurements in the face, we also expect some baseline neuronal activity to play a role, even in the lower part of the face. Overall, as was previously reported for gel electrodes (Huigen et al 2002), it appears that background physiological noise (which depends on the physiological state of the subject and position of the electrodes on the body) dominates measured baseline noise levels in a wide range of frequencies. This topic is beyond the scope of this paper and in the Supplementary Material we provide some more insights regarding future directions.
We contrast our results with previously reported noise data for dry electrodes (printed and otherwise). In table 1, we summarize previously reported noise and impedance values for EMG and EEG frequency bands along with results from this investigation. It is evident that low-impedance values do not contribute to reducing baseline noise, in particular for the low-frequency range and the face. This result is consistent with the results we presented above and echoes the results presented previously for gel electrodes (Huigen et al 2002). The same effect is observed in other dry electrode systems. For example, the effect of impedance on background noise was considered in dry MEMS-based electrodes. MEMS-based pyramid micro-needle electrodes for long-term electrophysiological measurement is an extensively studied approach. In these dry electrodes, the electrode-skin impedance is reduced owing to improved contact between the electrode and the skin. In agreement with the results we discussed here, the quality of EEG signals recorded by micro-needle electrodes is similar with those recorded with standard wet electrodes, despite much lower impedance (Wang et al 2013). Another type of commonly explored dry electrodes is textile electrodes. In Maji and Burke (2021) the skin-electrode interface noise performance of several un-gelled, textile-based electrodes has been characterized and contrasted with a gelled adhesive electrode. The noise associated with the electrodes themselves was found to be lower than that introduced by the amplifier, in agreement with our analysis of dry-printed electrodes. For many applications, modern high-input impedance amplifier technology supports high CI measurements and the focus on low electrode-skin impedance values should be taken with more careful consideration of technical needs (such as stability against line interference when relevant). It is likely that some of the high noise values reported previously for the EMG range (even for very low CI values) are related to experimental conditions.
Finally, in our measurements, we used very little or no skin preparation. Abrasion was not used in any of the experiments to prevent skin irritation and discomfort. For sEMG noise values obtained are sufficient for most applications and further reduction of the impedance is not necessary (save stability against line interference). For sensitive EEG measurements requiring reduced noised levels (e.g. ERP measurements), skin abrasion can help in reducing electrode-skin CI, but this reduction may not necessarily contribute to reduced noise. The skin-electrode CI depends not only on the condition of the skin, but also on the absence of hair, gender, and ethnicity of the subject. In the design of the experiment, there was an effort to have about the same number of female and male participants. Even so, variability is noticeable (see for example figures 4(a)–(b), and the variability presented in table 2) should be taken into account when proceeding with electro-physiological measurements. Although we did not specifically investigate the impact of gender, we anticipate that these variations will influence only the skin-electrode impedance rather than significantly affecting the main conclusions of this paper, which is the significant impact of physiological activity.
To summarize, in this investigation we established the baseline noise values of printed electrodes at different locations and conditions. By analyzing impedance and noise data, we demonstrated that the noise can be associated with the Nyquist equation (table 2) under some conditions (outer forearm). The association between impedance and noise can be evidenced only at a full relaxation state. Finally, we presented an extensive investigation of dry electrode impedance showing how better electrodes with better impedance can be produced.
Acknowledgments
This work was financially supported by the Deutsche Forschungsgemeinschaft (DFG, German Research Foundation) through grant HE 7056/4-1, by the German Federal Ministry of Education and Research (BMBF) in the 'Innovations for Production, Services, and Work of Tomorrow' program with the funding numbers 02P17W000 and 02P17W001, managed by the Project Management Agency Karlsruhe (PTKA), and by the Israel Science Foundation (1355/17). The authors have confirmed that any identifiable participants in this study have given their consent for publication.
Data availability statement
The data cannot be made publicly available upon publication due to legal restrictions preventing unrestricted public distribution. The data that support the findings of this study are available upon reasonable request from the authors.
Conflict of interest
YH declares a financial interest in X-trodes Ltd, which developed the screen-printed electrode technology used in this paper. YH has no other relevant financial involvement with any organization or entity with a financial interest in or financial conflict with the subject matter or materials discussed in the manuscript apart from those disclosed. SO, DP, and AG are employees of X-trodes Ltd.
Supplementary data (0.1 MB PDF)