

Abstract
Objective: To adapt to a new environment or situation, biological systems explore the most convenient state while moving between attractors by the force of random fluctuation. From this concept, the random component in physiological signals is assumed to increase during developmental and degenerative stages of life. To examine this hypothesis, we measured the age-dependent changes in the random component of heart rate variability (HRV) in 24-h electrocardiography (ECG) big data and in patients with a developmental disorder (DD). Approach: We measured separately regulated and random components of HRV with autoregressive (AR) model fitting, by which the ratio of random component as the fractional variance of AR residual time series. From the ALLSTAR database of about 304 000 ambulatory 24-h ECGs, we randomly extracted the data of 1930 men and 1987 women uniformly for all ages from 0 to 100 years old (100 cases per 5-year strata for each sex). Data were also obtained from male pediatric patients with DD (age 10–15 years). Main results: While the variance of the regulated component of HRV increased from age 0 to 20, decreased with age until 40, and reached a plateau in both sexes, the ratio of the random component was high at birth, decreased with age until 35 in men and 30 in women, and increased again after 75 in men and 85 in women (P < 0.0001 for all). In patients with a DD, the ratio of the random component was significantly lower than that in age-and-sex matched subjects in the database. Significance: We found that the ratio of the random component of HRV is increased during developmental and degenerative stages of life and that it may be reduced in DD patients during their development.
Export citation and abstract BibTeX RIS
Introduction
Processes of biological adaptation may be considered as attractor selections (Kashiwagi et al 2006). In order to adapt to a new environment or situation, organisms seem to explore the most convenient state while moving between attractors by random fluctuation (Yanagida et al 2007). For example, children find behaviors that are more suitable for situations through many random actions. If this is true for biological adaptions in general, physiological signals, particularly those reflecting brain activities, may increase the random components at the stages of life where the needs for adaption increase, i.e. during early developmental and final degenerative stages.
To examine this hypothesis, we measured the age-dependent changes in the random component in heart rate variability (HRV) and compared them with the values in patients with a developmental disorder (DD). Because HRV is known to disappear with complete cardiac autonomic denervation (Sands et al 1989), it is thought to originate from the brain and to reflect its activities to regulate the heart through the autonomic nervous system (Camm et al 1996, Hayano 2016). To assess the quantity of the random component of HRV, we utilized an autoregressive (AR) model (Akaike 1969) and measured the variance of residual time series reflecting the part of fluctuations that were not predicted by the AR model. To evaluate the age-dependent changes, we used the Allostatic State Mapping by Ambulatory ECG Repository (ALLSTAR) of 24-h electrocardiography (ECG) database, which consists of data collected from about 304 000 subjects. We randomly extracted data from subjects uniformly for all age groups who showed normal ECG and HRV profiles. Finally, as an additional pilot study, we investigated if the random component of HRV is low in patients with DD for their age.
Methods
This study was performed according to a protocol approved by the Ethics Review Committee of Nagoya City University Graduate School of Medical Sciences and Nagoya City University Hospital (No. 709 and No. 60160209).
Database
ALLSTAR database
To evaluate the age-dependent changes in the random component of HRV, we used a database of 24-h ECG constructed by the ALLSTAR research project (Yuda et al 2016, Yuda et al 2017, Hayano et al 2018). The project was started in 2010 for the purpose of establishing methods to evaluate the impacts of environmental determiners on health and/or disorders from Holter electrocardiography data recorded and gathered from all over Japan, enhancing the utility value of Holter ECG in the field of healthcare and contributing to the facilitation of predictive/preventive healthcare in the longevity of society.
The 24-h ECG data of this database were recorded for clinical purposes and referred for analysis to three ECG analysis centres (SUZUKEN Co., Ltd, Japan) located in Tokyo, Nagoya, and Sapporo in Japan. For the purpose of the ALLSTAR research project, the data were anonymized and stored with subjects' age, sex, and recording date, time, and location (postal code). According to the Ethical Guidelines for Medical and Health Research Involving Human Subjects (by the Ministry of Education, Culture, Sports, Science and Technology and the Ministry of Health, Labour and Welfare, Japan, 22 December 2014), the purpose and information utilized in this research have been public through the homepages of Suzuken Co., Ltd9 and also of the ALLSTAR10 research project (in which opportunities to refuse the uses of their information are ensured for the research subjects).
Measurement
For the Holter ECG data in the ALLSTAR database, the following Holter recorders were used: Cardy 2, Cardy 2P, Cardy 203, Cardy 301, Cardy 302 Mini and Max, Cardy 303 pico and Cardy 303 pico+ (SUZUKEN Co., Ltd, Nagoya, Japan). Using these recorders, 24-h multi-channel ECG data were digitized at 125 Hz and stored in their memory. The digitized ECG data were sent to one of the three ECG analysis centres, where the data were analysed with Holter ECG analysers (Cardy Analyser 05, Suzuken Co., Ltd, Nagoya, Japan) by skilled medical technologists.
Extraction of samples
In total, there were 24-h ECG data of 141 000 men (age 65 ± 17 years) and 163 000 women (age 67 ± 17 years) from all over Japan. From these data, we randomly extracted data uniformly for all age groups from 0 to 100 years old (about 100 subjects per 5-year strata for each sex) from those who met all of the following inclusion criteria: (1) ECG in normal sinus rhythm for >80% of 24 h; (2) no ECG findings suggesting abnormal conduction or myocardial ischemia; and (3) a low-risk HRV profile, defined as conventional 24-h HRV indices being within normal values, i.e. standard deviation of normal-to-normal R–R interval (SDNN) >75 ms (Huikuri et al 2000), very-low-frequency (VLF, 0.003–0.04 Hz) power >5.75 ln(ms2), deceleration capacity (DC) >4.5 ms (Bauer et al 2006), scaling exponent α1 > 0.75 (Huikuri et al 2000), and non-Gaussianity index λ25s < 0.6 (Kiyono et al 2008). The methods for calculating these HRV indices are described below.
Clinical data
Patients with DD
Holter 24-h ECG data were also obtained from five male pediatric patients who had been diagnosed to have a DD (age 10–15 years old). The parents of all patients gave their written, informed consent of cooperation for this research. ECGs were recorded with Cardy 303 pico+ (SUZUKEN Co., Ltd, Nagoya, Japan) and analyzed with Holter ECG analysers (Cardy Analyser 05, Suzuken Co., Ltd, Nagoya, Japan) by skilled technologists.
Data analysis
Preprocessing for HRV analysis
For both extracted and clinical 24-h ECG data, the temporal positions of all R-waves were detected, the rhythm annotations were given to all QRS complexes, and all errors in automated analysis were corrected manually by skilled clinical technologists. Only using R–R intervals consisting of two consecutive sinus rhythm beats (normal-to-normal [N–N] intervals), R–R time series data were then interpolated by a horizontal step function, i.e. the instantaneous R–R interval was defined as constant at the R–R interval value during the interval. Then, interpolated N–N interval time series were resampled for the entire 24 h and for nighttime data between 23:00 and 06:00 at 2 Hz for conventional HRV indices and at 1 Hz for AR model fitting. The nighttime data were used to investigate the possibility that age-dependent changes in HRV indices are the results of age-dependent changes in daily activities. If it applies to an HRV index, age-dependent changes in the index are expected to be lost or attenuated in nighttime data.
Assessment of conventional HRV indices
We calculated the conventional HRV measures recognized as mortality predictors in earlier studies (Camm et al 1996, Huikuri et al 2000, Bauer et al 2006, Kiyono et al 2008), which included SDNN, ultra-low-frequency (ULF, <0.0033 Hz), very-low-frequency (VLF, 0.0033–0.04 Hz), low-frequency (LF, 0.04–0.15 Hz), and high-frequency (HF, 0.15–0.40 Hz) component power, DC, short-term (α1, 4–11 beats) and long-term (α2, >11 beats) scaling exponents, spectral exponent β, and non-Gaussianity index λ25s. The power of frequency components was calculated with a fast Fourier transform for the entire length of the N–N interval data as fluctuations in the respective frequency bands of individual components and was transformed into a natural logarithmic (ln) value. DC was measured as spontaneous increases within short (4 beats) overlapping segments of N–N intervals averaged over 24 h by the method of phase-rectified signal averaging (Kantelhardt et al 2007). Scaling exponents α1 and α2 were calculated by detrended fluctuation analysis (DFA) (Peng et al 1995) to quantify the correlation properties of short-term (4–11 beats) and long-term (>11 beats) fractal-like dynamics (Huikuri et al 2009). The spectral exponent β was calculated to examine 1/fβ power-law behavior of 24-h N–N interval variation according to the method reported previously (Bigger et al 1996, Huikuri et al 1998, Sakata et al 1999). Finally, λ25s was calculated as an index of non-Gaussianity of the probability density function of the magnitude and occurrence frequency of abrupt intermittent changes in N–N intervals, and was interpreted as an index of sympathetic over-activity during daily life (Kiyono et al 2004, Kiyono et al 2008).
Assessment of random HRV component
To estimate the random component of HRV, we used an AR model fitting. By fitting an AR model, the fluctuation of time series can be separated into those of the regulated component (linear function of preceding values weighted by the AR coefficients) and the random component (residual of AR model), as shown in the equation
where x(t) is the time series of N–N interval, a(i) is the AR coefficient, Z(t) is the time series of AR residual component, and p is the AR model order. Because Z(t) represents random fluctuations that cannot be predicted by the AR model, its variance  can be considered as an estimate of the variance of the random component and
  as the estimate of the variance of the regulated component. We defined the ratio of variance of the random component in the total variance as AR variability (ARV):
These methods were applied on the resampled N–N interval time series for both 24-h and nighttime (23:00–06:00) data. AR model fitting was performed by the algorithm published in Marple (1980). The model order was selected as that which minimized the final prediction error (FPE) figure of merit according to Akaike's information criterion (AIC) (Akaike 1969). Additionally, to examine the influence of the AR model order on ARV, ARV was calculated with model orders forcedly incremented from 2 to 300 by one in nine randomly selected subjects with different levels of ARV with the FPE criterion.
Statistical analysis
We used the Statistical Analysis System (SAS, Carry, NC) program package for statistical analysis. The effects of age on conventional and AR-model-derived HRV indices were evaluated by the General Linear Model procedure with a 5-year age group as a categorical variable, assuming non-linear relationships. The age points at which the changes reached a plateau were assessed by t-test with Helmert or reverse Helmert transformation (a value at each age point was compared with the mean value after or before the age point). The correlations between conventional and AR-model-derived HRV indices were evaluated by Pearson's product-moment correlation coefficient. The significance of the difference of the values in patients with DD from the values in the samples extracted from the database was evaluated by comparing them with the values in age- and sex-matched subjects. P < 0.05 was used as the criterion of statistical significance.
Results
Sample extraction
According to the inclusion criteria, the data of 1930 males and 1987 females from 0 to 100 years old were extracted (in each sex, 100 subjects for all 5-year age groups but 0–4 years male [94 subjects], 95–99 years male [36 subjects], 0–4 years female [92 subjects], and 95–99 years female [95 subjects]).
Conventional HRV indices
Figure 1 shows age-dependent changes in conventional HRV indices. Heart rate was highest at the beginning of life, rapidly decreased from 0 to 20 years old, and gradually decreased after age 40. SDNN increased rapidly from 0 to 20 years old, decreased thereafter until age 40 and reached a plateau. DC increased from 0 to 15 years old in females and to 30 years old in males and decreased until age 80. Non-Gaussianity index λ25s increased gradually after age 60. Power of frequency components showed a similar pattern, increasing from 0 to 15 years old and decreasing with advancing age. The power of LF and HF components was increased slightly at the end of life. Scaling exponent α1 increased from 0 to 45 years old and decreased after age 75 in males, while it increased from 0 to 35 years old and decreased after age 65 in females. Scaling exponent α2 decreased from 0 to 15 years old and increased with age until age 70 in males and age 80 in females. Finally, spectral exponent β increased from 10 years old until 70 years old and decreased thereafter in both sexes. Heart rate, HF, and α2 were lower in males than in females (P < 0.0001, P = 0.004, and P < 0.0001, respectively), while SDNN, DC, VLF, LF, LF/HF, α1, and λ25s were higher in males than in females (P < 0.0001 for all but P = 0.01 for SDNN).
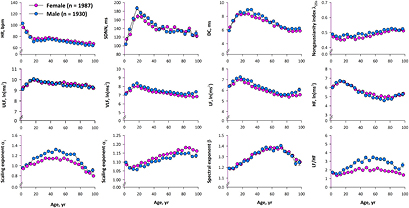
Figure 1. Age-dependent changes in conventional indices of heart rate variability (HRV) in samples (1930 males and 1987 females) extracted from the ALLSTAR database.DC = deceleration capacity, HF = power of high-frequency component, HR = 24 h mean heart rate, LF = power of low-frequency component, SDNN = standard deviation of 24-h normal-to-normal (NN) R–R interval, ULF = power of ultra-low-frequency component, VLF = power of very-low-frequency component.
Download figure:
Standard image High-resolution imageRandom and regulated components of HRV
According to the FPE criterion, the median order (minimum, inter-quartile range, maximum) of the AR model for 24-h HRV was 189 (51, 142–267, 510) for males and 186 (46, 136–273, 501) for females. To examine the influence of the model order on estimated ARV, nine subjects with different ARV values were randomly selected and ARV was calculated with model orders forcedly incremented from 2 to 300 by 1. As shown in figure 2, while ARV decreased with increasing AR order, it saturated by the order of 40 and plateaued thereafter. Because the AR order with FPE criterion was >45 in all subjects, we considered that the influence of the model order can be neglected.
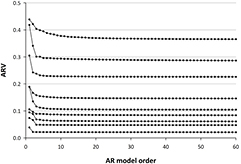
Figure 2. Influence of autoregressive (AR) model order on estimated AR variability (ARV) in nine randomly selected subjects with different levels of ARV.
Download figure:
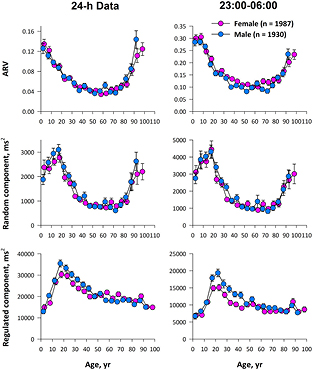
Standard image High-resolution imageFigure 3 shows age-dependent changes in AR-model-derived HRV indices of 24-h and nighttime (23:00–06:00) data. Although nighttime data showed greater ARV and greater variance for the random component than those of 24-h data, the patterns of their age-dependent changes were similar, indicating that the age-dependent changes in 24-h data are not attributable to age-dependent changes in daily activities.
Figure 3. Age-dependent changes in ARV and the variances of random and regulated components of HRV in samples (1930 males and 1987 females) extracted from the ALLSTAR database.
Download figure:
Standard image High-resolution image
The age-dependent changes in the regulated component were similar to those of SDNN in both sexes. On the other hand, the variance of the random component and ARV showed characteristic changes with age. The random component had a peak at 20 years old, decreased thereafter until 40, and increased again from age 75 in males and after age 85 in females. Furthermore, ARV was high at birth, decreased with age until 35 years old in men and 30 years old in women, and increased again from age 75 in men and age 85 in women. While the variance of the regulated component was greater in males (P = 0.01), there was no significant gender difference in the variance of the random component or in ARV.
Table 1 shows the relationships between conventional and AR-model-derived HRV indices in 24-h data of both sexes (1930 males plus 1987 females). As expected, the variance of the regulated component was closely correlated with SDNN (r = 0.96). ARV showed negative correlation with spectral exponent β (r = −0.57) and scaling exponent α1 (r = −0.41) and mild positive correlations with HF (r = 0.39).
Table 1. Correlation coefficients between conventional and AR-model-derived HRV indices in samples (1930 males and 1987 females) extracted from the ALLSTAR database.
| ARV | Random component | Regulated component | |
|---|---|---|---|
| HR | 0.07 | −0.11 | −0.30 |
| SDNN | −0.17 | 0.28 | 0.96 |
| DC | 0.05 | 0.18 | 0.31 |
| λ25s | −0.17 | −0.13 | 0.11 |
| ULF | −0.22 | 0.17 | 0.77 |
| VLF | 0.17 | 0.46 | 0.66 |
| LF | 0.33 | 0.50 | 0.52 |
| HF | 0.39 | 0.52 | 0.47 |
| LF/HF | −0.20 | −0.17 | −0.07 |
| Scaling exponent α1 | −0.41 | −0.31 | 0.02 |
| Scaling exponent α2 | −0.30 | −0.30 | −0.06 |
| Spectral exponent β | −0.57 | −0.44 | 0.01 |
aExcept these, all other correlation coefficients are significant.
Patients with DD
Table 2 shows conventional and AR-model-derived HRV indices in five male patients with a DD. Compared with age-sex matched subjects extracted from the ALLSTAR database, patients with a DD showed lower ARV (P = 0.04). They also showed higher heart rate and scaling exponent α1, while their scaling exponent α2 and spectral exponent β were comparable.
Table 2. AR-model-derived and fractal HRV indices in male patients with a developmental disorder (DD).
| Patient ID | Age year | HR bpm | SDNN ms | ARMO | ARV | Random component ms2 | Regulated component ms2 | Scaling exponent α1 | Scaling exponent α2 | Spectral exponent β |
|---|---|---|---|---|---|---|---|---|---|---|
| DD-001 | 15 | 89.7 | 127 | 253 | 0.032 | 500 | 15311 | 1.347 | 1.095 | 1.306 |
| DD-002 | 10 | 78.6 | 187 | 319 | 0.112 | 4348 | 34496 | 1.125 | 1.053 | 1.111 |
| DD-003 | 12 | 78.1 | 153 | 207 | 0.073 | 1845 | 23363 | 1.096 | 1.040 | 1.259 |
| DD-004 | 10 | 98.1 | 98 | 135 | 0.070 | 740 | 9899 | 1.232 | 1.026 | 1.255 |
| DD-005 | 15 | 82.3 | 136 | 216 | 0.016 | 322 | 19362 | 1.520 | 1.088 | 1.412 |
| Patients |
12.4 (2.5) | 85.7 (3.5) | 139 (17) | 226 (40) | 0.061 (0.019) | 1537 (923) | 20206 (6084) | 1.264 (0.064) | 1.061 (0.020) | 1.280 (0.041) |
| Age-sex matched |
12.4 (2.1) | 78.6 (0.6) | 164 (3) | 239 (7) | 0.096 (0.003) | 2879 (161) | 27958 (1062) | 1.104 (0.014) | 1.059 (0.004) | 1.216 (0.010) |
| P | 0.04 | 0.1 | 0.7 | 0.04 | 0.1 | 0.2 | 0.006 | 0.9 | 0.1 | |
aLeast-square means (SEM) adjusted for the effect of age. HR = 24 h mean heart rate, SDNN = standard deviation of 24-h normal-to-normal (NN) R-R interval, ARMO = autoregressive model order, ARV = autoregressive variability, DFA = detrended fluctuation analysis.
Discussion
In the present study, we found that the ratio of the random component of HRV estimated by ARV increases at the beginning and the end of life. Our findings are consistent with the hypothesis that the ratio of the random component of HRV increases during the developmental and degenerative stages of life, which may also support the concept of biological adaptation as attractor selection by the force of random fluctuation (Kashiwagi et al 2006).
The idea that an increase in random fluctuation associated with adaptation may be detected by AR model fitting has been deduced from the similarity of the AR model to the Langevin equation, which is used to represent the attractor selection model of biological adaptation (Kashiwagi et al 2006). A Langevin equation for the attractor selection model is written as
where f(x) represents pulling force to the attractor, activity represents the force of bias that the system receives (goodness of state), and η represents the force of random fluctuation that the system receives. When organisms encounter a new environment or problem, they increase η to seek the new optimal attractors. By fitting an AR model,

the power of fluctuation can be separated into those of regulated and random fluctuation components. Because Z(t) represents random fluctuations that cannot be predicted by the model, its variance can be thought as an estimate of η. In a simulation study (not published), we generated simulated HRV signals by adding regular sinusoidal waves and random white noise in various ratios of their variances. By fitting an AR model to those simulated signals, ARV faithfully reflected the ratios of the variance of random noise to the total variance of the simulated signal.
In this study, we analyzed age-dependent changes in conventional HRV indices and compared them with those of the AR-model-derived indices. The age-dependent changes in SDNN, DC, and ULF, VLF and LF power, which increases during the early phase of life until 15–20 years old and declines thereafter, were close to those in the regulated component, indicating that most of the HRV consists of the regulated component. The age-dependent changes in HF power were somewhat similar to those of the random component and, consequently, there was mild correlation between them (r = 0.52, respectively), suggesting associations between cardiac resting function (Hayano and Yasuma 2003) and random fluctuation of heart rate.
Interestingly, ARV showed the opposite age-dependent pattern to those of scaling exponent α1 and spectral exponent β and negative correlations with them (r = −0.41 and −0.57). An increase in α1 above 1.0 is thought to represent a loss of complexity in short-term heart rate dynamics (Huikuri et al 2009). An increase in β towards 2 also represents a decrease in complexity and flexibility along with the changes from fractal dynamics to more correlated Brownian dynamics of fluctuation. These also indicate that 24-h HRV displaying dynamics closer to fractal noises yields a higher ratio of residual error in AR-model fitting, whereas 24-h HRV displaying dynamics closer to Brownian noises yields a lower ratio of residual error in AR fitting. Although these suggest that ARV may be related at least partially to the complexity and flexibility of heart rate dynamics, the pattern of age-dependent changes in ARV matched only modestly the patterns of these nonlinear HRV indices. In fact, the correlation coefficients indicate that age-dependent change in scaling and spectral exponents account for about 17% and 32%, respectively, of the age-dependent variations of ARV, suggesting that ARV may carry information that is not included in these nonlinear HRV indices.
We observed that analyses of 24-h and nighttime (23:00–06:00) data showed similar patterns of age-dependent changes in AR-model-derived HRV indices. Because data during sleep can be assumed to be less affected by individual differences in activities, the age-dependent changes observed in 24-h data do not seem attributable to the changes in daily activities with age. Furthermore, the variance of the random component was greater in nighttime data than in 24-h data despite the overall variance of R-R interval variability of nighttime data being about half of that in 24-h data. Consequently, ARV was >1.5 times higher in nighttime than 24-h data. This indicates that the R-R interval variation was more random during nighttime, which seems consistent with earlier studies reporting increased nonlinearity (Beckers et al 2006) or complexity (Viola et al 2011) of heart rate dynamics during sleep. Given that the source of variations observed as HRV is derived through the autonomic nerves (Sands et al 1989), these findings indicate that the random behavior of heart rate dynamics is intrinsic to neural activities in the brain.
Finally, we observed that ARV was reduced in pediatric patients with DD for their age, although it should be considered as a preliminary finding of a pilot study. One may speculate, however, that the function of random fluctuation to facilitate attractor selections for development might be reduced in these patients. These patients also showed increased heart rate and scaling exponent α1, suggesting increased tension during their daily life and less complexity of short-term heart rate dynamics.
This study has several limitations. First, the ECG data have been collected at a sampling frequency of 125 Hz. Although it is standard (125–128 Hz) in Holter ECG recordings for clinical uses, higher sampling rates might decrease the ratio of the random component due to smaller noises in the R–R interval measurement. Second, for all age groups from 0 to 100 years we used the same parameters of HRV analyses, such as the frequency bands for HRV components and the definitions of scaling regions for short- and long-term DFA. These frames themselves, however, may be changed with age and may have caused biases in the observed age-dependent changes in HRV indices. This possibility seems worth investigating in future studies. Third, the data in the ALLSTAR database has been collected for clinical reasons. In this sense, the ALLSTAR database may represent the characteristics of patients undergoing Holter ECG monitoring examination in Japan. Although we selected only subjects whose ECG showed normal sinus rhythm (>80% of all recorded beats), no abnormal finding of conduction or myocardial perfusion, and a low-risk profile from risk-predictive indices of HRV, we cannot exclude the possibility that the data might be affected by underlying diseases such as diabetes, hypertension, and cardiovascular diseases, and by possible differences in the prevalence of those diseases with age and sex. Nevertheless, the age-dependent changes we observed in conventional HRV indices are similar to those reported in an earlier study of 114 healthy subjects (Pikkujaemsae et al 1999), and the present study is first to demonstrate the complete profile of age- and sex-dependent changes in AR-model-derived HRV indices for the entire length of life. Finally, in this study we examined the hypothesis that the ratio of the random component of HRV increases during developmental and degenerative stages of life, based on the concept of biological adaptation as attractor selection by the force of random fluctuation. Our results supported the hypothesis, but at this time we cannot deny a logical leap in directly linking the results to the concept of biological adaptation. Our interpretation may be only one of several possibilities and should be positioned as one of the first challenges for a new interpretation of HRV.
Conclusion
Based on the concept that biological adaptation is regarded as attractor selection by the force of random fluctuation, we examined if the random component in HRV increases during developmental and degenerative stages of life. Our findings supported the hypothesis, indicating that the ratio of the random component of HRV is increased during the early and final phases of life and that it may be reduced in DD patients during their developmental stage.
Acknowledgments
This work was supported by a grant of the Knowledge Hub of Aichi, Japan (the Priority Research Project, P3-G1-S1-2b (J Hayano)) and the Japan Society for the Promotion of Science, Japan (Grant-in-Aid for Scientific Research (C) 23591055 (J Hayano); Grant-in-Aid for Scientific Research (C) 25461062 (H Fukuta); Grant-in-Aid for Scientific Research (B) 15H03095 (T Nakamura); and Grant-in-Aid for Scientific Research (A) 17H00878 (Y Yamamoto)).
Footnotes
- 9
- 10