

Abstract
Objective: To better understand the longitudinal characteristics of Parkinson's disease (PD) through the analysis of finger tapping and memory tests collected remotely using smartphones. Approach: Using a large cohort (312 PD subjects and 236 controls) of participants in the mPower study, we extract clinically validated features from a finger tapping and memory test to monitor the longitudinal behaviour of study participants. We investigate any discrepancy in learning rates associated with motor and non-motor tasks between PD subjects and healthy controls. The ability of these features to predict self-assigned severity measures is assessed whilst simultaneously inspecting the severity scoring system for floor-ceiling effects. Finally, we study the relationship between motor and non-motor longitudinal behaviour to determine if separate aspects of the disease are dependent on one another. Main results: We find that the test performances of the most severe subjects show significant correlations with self-assigned severity measures. Interestingly, less severe subjects do not show significant correlations, which is shown to be a consequence of floor-ceiling effects within the mPower self-reporting severity system. We find that motor performance after practise is a better predictor of severity than baseline performance suggesting that starting performance at a new motor task is less representative of disease severity than the performance after the test has been learnt. We find PD subjects show significant impairments in motor ability as assessed through the alternating finger tapping (AFT) test in both the short- and long-term analyses. In the AFT and memory tests we demonstrate that PD subjects show a larger degree of longitudinal performance variability in addition to requiring more instances of a test to reach a steady state performance than healthy subjects. Significance: Our findings pave the way forward for objective assessment and quantification of longitudinal learning rates in PD. This can be particularly useful for symptom monitoring and assessing medication response. This study tries to tackle some of the major challenges associated with self-assessed severity labels by designing and validating features extracted from big datasets in PD, which could help identify digital biomarkers capable of providing measures of disease severity outside of a clinical environment.
Export citation and abstract BibTeX RIS

Original content from this work may be used under the terms of the Creative Commons Attribution 3.0 licence. Any further distribution of this work must maintain attribution to the author(s) and the title of the work, journal citation and DOI.
1. Introduction and background
The pathophysiology of Parkinson's disease (PD) has been linked to the gradual degeneration of neurons within the substantia nigra, causing a lack of dopamine uptake in the basal ganglia (Alvarez et al 2007). The most common symptoms of PD are often abbreviated as TRAP: Tremor at rest, Rigidity, Akinesia, and Postural instability (Jankovic 2008). In this study, we will focus on two common tests used to assess disease severity: the alternating finger tapping (AFT) test and a memory test. However, symptom prevalence, progression, and severity are highly inhomogeneous across the PD population making diagnosis and quantification of medication efficacy challenging (Michell et al 2004, Robbins and Cools 2014).
The most popular means of assessing the severity of PD is the Movement Disorder Society's Unified Parkinson's Disease Rating Scale (MDS-UPDRS) (Goetz et al 2008). The MDS-UPDRS is a clinic based scoring system in which 65 motor and non-motor evaluations are made: each on a scale of zero (normal) to four (severe). Though widely used, the MDS-UPDRS is commonly corrupted by inter- and intra-rater variability as well as subjectivity (Goetz et al 2002, Das et al 2011, Antoniades et al 2013). In a recent study, the mean difference in inter-rater UPDRS variability was reported to be between 1.7 and 5.4, whereby nurses, residents and movement disorder specialists (MDS) were found to consistently assign higher UPDRS scores as compared to senior MDS (Post et al 2005). Although the 'Floor-Ceiling' effect is often small in the full clinically administered UPDRS system, the effect remains unknown in many abridged systems whilst being remotely self-reported in large cohorts (Goetz et al 2008, Gallagher et al 2012). The floor-ceiling effect occurs in a scoring system when the extremity scores are insensitive to small changes in the parameter being measured, resulting in a high proportion of scores taking the highest or lowest possible values.
The current requirement for PD diagnosis and treatment to be performed in-clinic not only incurs a substantial cost for healthcare services but also can be challenging for elderly sufferers of PD living in rural areas as most neurologist tend to be based in urban areas. Additionally, with the projected number of people with PD to increase dramatically over the next decade, the ability to reliably perform assessments outside of a clinical environment is highly desirable (Dorsey et al 2007). These challenges, in addition to the shortcomings of the MDS-UPDRS, have led to an active area of research identifying objective biomarkers to quantify the severity symptoms associated with PD though the use of digital sensors (Kubota et al 2016, Rovini et al 2017). A range of sensors have shown capabilities of objectively assessing symptoms including microphones for voice analysis and accelerometers for movement analysis such as gait, tremor, and dexterity (Patel et al 2009, Tsanas et al 2010, Horak and Mancini 2013, LeMoyne et al 2013, Bayestehtashk et al 2015, Kassavetis et al 2016). The benefit of using sensors is that they enable objective digital biomarkers to be identified which could be used as complimentary measures of disease severity along with clinical scores.
In a clinical environment, the AFT activity has demonstrated that subjects with PD show an impaired motor-performance when compared to healthy subjects (Jobbágy et al 2005, Okuno et al 2006, Memedi et al 2013). Such impairments include hastening, faltering, or freezing during the AFT test. Subsequently, these impairments have been detected through digital sensors resulting in features such as tapping speed and rhythm being identified as showing strong capabilities of predicting symptom severity (Tavares et al 2005, Printy et al 2014). Additionally, quantitative approaches to detecting non-motor impairment in PD subjects have also shown promise through memory examinations such as the serial reaction time (SRT) test. Findings commonly suggest that subjects with PD show impaired sequence and implicit learning when compared to healthy subjects (Helmuth et al 2000, Muslimović et al 2007, Siegert et al 2008).
However, the primary downfall of previous studies utilising wearable sensors lie in the fact that they suffer from low subject numbers and lack of longitudinal data as they were confined to a hospital environment, which seriously limits the scalability of these studies as data collected in a home environment can be more confounded by noise. Table 1 provides a summary of the most recent AFT studies demonstrating their subject and instance limitations. Presently, the degree of scalability of previous findings is unknown as validation on long time-scales, on a large subject group, and in a non-clinical lab environment has yet to be undertaken. Furthermore, both the motor and non-motor learning impairments discovered in subjects with PD have only been suggested over a very short period of time (usually within 24 h), commonly over the course of several test repetitions or a single clinical visit (Tanaka et al 2000, Jobbágy et al 2005).
Table 1. Summary of the most recent studies quantifying a tapping activity in PD. The data collected in the mPower study, shown in the bottom row, is used in this study. Of the 8003 subjects, the PD/HC split is 1060/5357, with 1586 participants not providing a diagnosis label.
| Author | # subjects (PD/HC) | # of measurements | Measurement device | Location |
|---|---|---|---|---|
| Arroyo-Gallego et al (2017) | 21/23 | 51 | Smartphone | Clinic |
| Kassavetis et al (2016) | 14/0 | 14 |
Smartphone | Clinic |
| Picillo et al (2016) | 123/0 | 492 |
Video camera | Clinic |
| Arora et al (2015) | 10/10 | 18 |
Smartphone | Remote |
| Printy et al (2014) | 18/0 | 54 | Smartphone and glove | Clinic |
| Memedi et al (2013) | 95/10 | 12 011 |
Personal handheld computer | Clinic and remote |
| de Frias et al (2007) | 50/48 | 196 | Custom response console | Clinic |
| Tavares et al (2005) | 33/0 | 66 | MIDI-keyboard | Clinic |
| Lee et al (2016) | 57/87 | 432 | Smartphone and mechanical tapper | Clinic |
| Zhan et al (2016) | 121/105 | 1600 |
Smartphone | Remote |
| mPower (Bot et al 2016) | 8003 | 78 887 | Smartphone | Remote |
| mPower (used in this study) | 312/236 | 48 892 |
aNot stated, assumed to be one measurement per subject. bOne measurement for each hand in each medication state (ON/OFF). cAverage of 2.7 tests per day for an average of 34.4 d (~93 tests) assumed to be split evenly over five test types. dComing from multiple studies. Measurement frequency is highly inconsistent with ~28 to 2 measurements per subject and no longitudinal analysis was performed. e8000 instances in the study are assumed to be split evenly across five modalities (voice, gait, balance, reaction, dexterity).
The advancement of micro-electronic systems has enabled wearable sensors to become more commonplace in everyday life, most notably though their embedment in smartphones. Recent studies into PD have created smartphone applications enabling participants to perform tests multiple times a day, over the course of many months, all in a non-clinical environment (Bot et al 2016, Zhan et al 2016). The accelerometer in smartphones allows assessment of gait, tremor, and balance, whilst the touch-screen is used for the AFT activity and for memory games. Subsequently, these studies have collected databases which contain tests over multiple modalities on a longitudinal basis from greatly increased subject numbers. Smartphones also enable the user to perform regular self-assessments regarding their disease severity, symptom prevalence, and medication adherence. However, many challenges have been identified when collecting remote data compared to clinical data (Kubota et al 2016, Neto et al 2017). The variability of test environment and smartphone placement and orientation have a significant influence on the test data. It is challenging to determine whether differences between tests are due to environmental factors or caused by a longitudinal change in impairment.
Findings from clinical datasets suggest subjects with PD show impairments in motor and non-motor learning in the AFT and memory tests on a short-term basis (Tanaka et al 2000, Siegert et al 2008). There are three main contributions of this study: (1) we investigate for the first time whether longitudinal motor and non-motor learning impairments can be detected in the large and remotely collected mPower dataset; (2) we explore how changes in longitudinal test performance can be quantified and used to better predict disease severity measures; and (3) by inspecting the individual elements of the disease severity scores we reveal limitations in the self-assessed UPDRS system.
2. Methods
2.1. Data
The data used here was collected during the first six months of the mPower Study (Bot et al 2016). Volunteer participants enrolled in the study through the mPower iPhone (Apple Inc., Cuppertino, USA) application.
Using the application, participants self-report their severity and symptoms through a subset of UPDRS Section I (non-motor experiences of daily living) and Section II (motor experiences of daily living) questions. Unlike the other sections of the full UPDRS, Sections I and II have been specifically designed to be completed without the help from a MDS (Goetz et al 2008). A demographic survey was completed on a one off basis by 6805 participants allowing them to describe their health history including whether they have been professionally diagnosed with PD. Participants were asked to complete the UPDRS survey at baseline and then on a monthly basis throughout the study. The UPDRS survey was completed a total of 2305 times by 2024 unique participants.
The smartphone application presents the participants with four measurement activities: Walking, Voice, Tapping, and Memory. This research focuses on the tapping and memory activities as these will be new to the participants, have been widely studied in-clinic, and shown to demonstrate learning behaviour. For the tapping activity, participants were asked to perform the AFT task for 20 s. This entails placing the smartphone on a flat surface and alternately tapping the screen using the index and middle finger as fast as possible. The data provided by this activity are the timestamps (time of finger touching the screen) and the {x,y} screen pixel coordinates for each tap instance. Although many features from the AFT have shown to be discriminative between PD and HC subjects, we focus on the total number of taps (equivalent to average tapping speed) as this measure is easily interpretable and has repeatedly been validated clinically, often showing the strongest relation to severity (Tavares et al 2005). The tapping activity was completed 78 887 times by 8003 unique participants.
The memory activity was included in the mPower study in a later version than the other activities and subsequently has significantly fewer test instances. The activity consists of showing the participant a sequence of lighting up flowers arranged in a grid, and then asking the participant to replicate the sequence in order. This process is repeated three times with the grid becoming larger and the sequence more challenging with each iteration. The resulting raw data provided by this activity are the total score, the number of failures, as well as the tap coordinates and time intervals for completing each level – of which we focus on the total score. The memory activity was completed 8569 times by 968 unique participants.
2.2. Analysis procedures
2.2.1. Short-term behaviour
It has been shown in clinical environments that PD and HC participants show variable performances over a small number of repetitions at the AFT test (Tanaka et al 2000). Firstly, we aim to determine if PD participants show an impaired performance at the AFT. Secondly, we investigate whether the PD participants' performance changes at a different rate to HCs over a short number of repetitions and whether these changes could be induced by a response to medication; enabling the differentiation of the performance change due to learning from the performance change due to medication.
In the tapping activity, to be included in the short-term behaviour (STB) analysis, participants were required to have contributed five or more test instances within the first 24 h of their first test instance (n = 600). Due to the lower number of participants and instances in the memory activity, the inclusion criteria was altered so that participants who contributed five or more test within the first 72 h of their first test were included (n = 112).
By inspecting the relative test performances between the PD and HC participant groups we can determine whether PD participants show impairment at baseline. Next, we compare the performance of each participant group after the fifth repetition of an activity with their baseline performance using the student t-test. Our choice of limiting this analysis to the first five tests is based on previous works demonstrating that both the AFT and SRT tests show learning within five repetitions (Behrman et al 2000, Muslimović et al 2007). In order to determine if medication is having an effect on test performance, we repeat the above procedure on all participants who are in the same medication state at baseline and at fifth visit, thus isolating the change in performance due to practise via removing any influence of medication.
2.2.2. Longitudinal behaviour
Previous studies focus on the STB of the AFT test as they did not have access to longitudinal tests (table 1). As we have access to longitudinal data, we extend the analysis to determine whether longitudinal variation occurs within the performance of HC and PD participants. Adopting a similar approach to the study of the STB, we investigate whether PD participants are more likely to show transient behaviour and whether the rate at which PD participants learn new tasks is different to HCs. As each test is labelled with a medication timestamp, we determine if PD participants who are not taking medication are more likely to show transient behaviour than those who are taking medication. This high-frequency analysis may provide useful insight into the effect of medication on test performance, and help clinicians make informed decisions to optimize drug dosage and times for each individual PD participant.
For the tapping test, any participant who contributed 20 or more tapping test instances is included in the long-term behaviour (LTB) analysis (548 participants). Alternatively, due to there being less memory test instances, any participant who contributed 10 or more memory test instances is included in the LTB analysis (121 participants).
Progress ratio
To quantify the longitudinal performance of a participant we define the progression ratio (PR) metric. The PR continuously compares a participant's average starting performance to their performance at any other given test instance. When this process is repeated for all instances we get multiple PR values which form the PR waveform (PRW).
If a participant completes a total of N instances of a test, and we select an averaging window size of n (where N  n) we are able to calculate a PRW with J = N − (n − 1) test points. The jth point in the PRW is calculated via
where
with fj being the feature value at test number j. The PRW is taking the average feature performance over the first n tests, and then finding the ratio between this average starting performance and the average performance of all other windows (of length n). In this study, we set n = 5. The averaging window size of five is used as this is consistent with and builds on our previous short-term analysis which focused on the first five test performances. This enables us to separate the learning behaviours seen in the short- and long-term analyses.
According to equation (1), if a feature value increases over repetition, the PRW will tend to be greater than one, whereas if the feature value decreases over repetition, the PRW will be less than one. A feature showing little or no change over time will have a PRW at a constant value of one. We classify participants into learning-phenotypes (L-PTs) based on  prw, the mean of their PRW, according to
The  prw therefore enables us to determine if a participant's performance is varying longitudinally. In equation (3), the thresholds for classification are based on observing an average performance change of 20% from baseline. Previous investigations into short-term learning in the AFT and reaction time tests report performance changes of between 16%–24% (Light et al 1996, Tanaka et al 2000). As the data in this study is collected remotely, test performances can vary as a consequence of test environment, thus, using a value of 20% ensures only subjects who show a consistently different longitudinal performance with their baseline performance are classified as being either improving or deteriorating.
Steady state index
In addition to detecting the presence of transient and varying longitudinal performance in a new task, we want to determine if PD participants take longer to learn this task. We now define the steady state index (SSI), a metric which estimates the test number at which a participant reaches a steady state of performance. The SSI continuously compares a participant's average performance over their final n tests, which is assumed to be their steady state performance (SSP), to their performance at any other test instance. In the same manner as we calculated the PRW, we now calculate the steady state waveform (SSW) as

where
Whereas for the PRW we find the ratio between current performance and the mean starting performance, when determining the SSW we find the ratio between the current performance and the mean finishing performance. In order to determine the SSI, we find the indices of tests whose performances are within 20% of the SSP:

From the binary I vector, the index of the first two consecutive TRUE instances is set as the SSI.
2.2.3. Relation to disease severity
Features from the AFT activity and memory function tests have been shown to correlate well with clinically assigned severity (Sahakian et al 1988, Tavares et al 2005, Aarsland et al 2010). However, the above studies have mostly consisted of one-off clinical visits on a small cohort of subjects with mild/severe severities. The above findings are yet to be tested on a large cohort of subjects, using remotely collected data, encompassing a wide range of UPDRS severity scores.
We expand on previous approaches via incorporating the longitudinal progression of participant performance. To investigate the potential links between longitudinal performances and disease severity we find the correlation between disease severity and participants' SSP and compare this with the correlation between disease severity and baseline performances.
The PD participants who were included in the longitudinal behaviour (LTB) subset and who also had at completed least one UPDRS assessment were included in this analysis. This subset is herein referred to as the performance-severity subset (PSS).
We further explore the reliability of the mPower UPDRS survey via determining if the 'Floor-Ceiling' effect is present in the mPower subset of questions. Firstly, we divide PSS into two groups based on their total UPDRS score severity. We compare the correlation between the test performances and severity scores of severe participants against the same correlation in not-severe participants. A participant is labelled as Severe if their total UPDRS score is above the mean plus one standard deviation of the population's total UPDRS score (UPDRS threshold = 20.0). Secondly, we divide participants into two groups based on the test performances. We compare the correlation between the test performances and severity scores of participants with severely impaired performances against the same correlation in participants whose performances are not severely impaired. A participant is labelled as having a severe performance if their baseline performance is below the mean minus one standard deviation of the population's baseline performance (tapping threshold = 99.1 and memory threshold = 191.8). Finally, we investigate the relationship between disease severity and the number of years since diagnosis. This is firstly performed on all PD participants who contributed a UPDRS survey (N = 534). Secondly, we split the PSS cohort into two groups based on how recently the participants received their professional diagnosis. We find the correlation between the years since diagnosis and the participants' UPDRS scores and test performances. A participant is labelled as having a recent diagnosis if they received their diagnosis within the last seven years. Conversely, a participant is labelled as having a longstanding diagnosis if they have had a diagnosis for seven years or longer. The seven year threshold was chosen as it is the mean plus one standard deviation3 of the years of diagnosis for PD participants in both the tapping and memory tests. Finding these correlations, in a large population with a wide range of severity scores, will enable us to comment on whether previously clinically found features are suitable for severity prediction on subjects with low/mild severities in a remote environment. Finally, for each individual question in the mPower UPDRS survey, as well as the total UPDRS score, the floor-ceiling effects are evaluated via calculating the percentage of responses that are the highest and lowest possible values.
2.2.4. Relationship between tapping and memory tasks
The final analysis aims to find if a relationship exists between the LTB in the tapping and memory activities. We identify all participants who were in the LTB subsets for both the tapping and memory activities (N = 107) and determine if their LTB is consistent between the activities.
2.2.5. Disease characteristics between sexes
It has been suggested that oestrogens may have a neuroprotective effect against PD; in animals the substantia nigra has shown to be more susceptible to neuron degradation in low oestrogen environments (Datla et al 2003). Several studies have demonstrated that PD incidence can be as much as two times higher in males than in females (Haaxma et al 2007). Subsequently, due to their lower oestrogen levels, it is proposed that males are more likely to develop PD at a younger age than females.
Utilizing the entire mPower demographics dataset, we investigate if the proportion of male and female participants with PD is in agreement with previously reported incidence between sexes. For the PD participants who completed the demographics survey and at least one tapping test (N = 1060) or at least one memory test (N = 297) we study the effects of sex on smartphone test performance (as quantified using the number of taps and memory score). We conclude our study on disease characteristics between sexes via implementing Binomial proportion tests between the male and female participants within each of the L-PTs. This is performed for the tapping and memory tests, and is aimed to determine whether participant sex is a confounding factor in L-PT classification.
2.2.6. Data subsets
For the first two analysis sections outlined above, we further divide the eligible participants into three subsets; Young Healthy Control, Age Matched Healthy Controls, and PD participants. These three groups are denoted by YHC, HC, and PD respectively. The YHC subset contains any participant under the age of 50 years old who self-reports as not having PD. The HC subset contains any participants who are 50 years old or older and who report as not having PD. The PD group contains any participant who self-reports as having a professional diagnosis of PD. Each of the analysis subsets are summarised in table 2.
Table 2. The characteristics of participants in each of the three main analysis subsets. The short-term behaviour (STB) and longitudinal behaviour (LTB) subset inclusion criteria do not require participants to have contributed a UPDRS survey, they therefore contain many participants who did not contribute any UPDRS data and hence this has been omitted.
| Tapping | Memory | ||||||
|---|---|---|---|---|---|---|---|
| # | Age | UPDRS | # | Age | UPDRS | ||
| Short-term behaviour | YHC | 406 | 30.2 ± 8.8 | N/A | 10 | 32.8 ± 12.1 | N/A |
| HC | 57 | 60.3 ± 7.7 | N/A | 11 | 64.2 ± 10.4 | N/A | |
| PD | 137 | 63.4 ± 7.3 | N/A | 91 | 65.5 ± 6.2 | N/A | |
| Longitudinal behaviour | YHC | 150 | 32.5 ± 9.5 | N/A | 10 | 34.3 ± 9.1 | N/A |
| HC | 86 | 61.9 ± 7.7 | N/A | 14 | 65.1 ± 7.0 | N/A | |
| PD | 312 | 63.8 ± 6.8 | N/A | 97 | 65.6 ± 6.3 | N/A | |
| Performance severity subset | Severe UPDRS | 28 | 64.3 ± 6.2 | 27.6 ± 4.1 | 16 | 65.5 ± 7.3 | 25.8 ± 3.2 |
| Not severe UPDRS | 233 | 63.9 ± 6.8 | 9.6 ± 5.9 | 67 | 63.8 ± 6.5 | 9.6 ± 5.6 | |
| Severe perf | 59 | 63.6 ± 6.8 | 13.5 ± 8.1 | 9 | 64.1 ± 6.4 | 13.4 ± 7.7 | |
| Not severe perf. | 204 | 63.9 ± 6.7 | 10.5 ± 7.4 | 74 | 63.6 ± 6.5 | 10.5 ± 6.9 | |
| Longstanding diagnosis | 48 | 62.6 ± 7.5 | 17.0 ± 8.8 | 18 | 64.9 ± 7.5 | 16.5 ± 7.32 | |
| Recent diagnosis | 215 | 64.1 ± 6.5 | 11.5 ± 6.8 | 65 | 65.8 ± 6.0 | 11.3 ± 6.3 | |
3. Results
3.1. Tapping
3.1.1. Short-term behaviour
At baseline performance, PD participants show significant impairment compared to both HC (p < 0.001) and YHC (p < 0.001) participants. Similarly, after five repetitions PD participants remain significantly impaired compared to HC (p = 0.02) and YHC (p < 0.001) participants.
Performing paired t-tests between the baseline performance and performance at the fifth repetition for the YHC, HC, and PD groups yields p-values of 0.60, 0.27, and 0.03 respectively, demonstrating that the only participant group showing a significant level of change at the 0.05 level are the PD participants.
Further, for all participants we find that the change in performance over the first five test instances correlates with baseline performance (R = −0.48). This intuitively states that participants with a lower baseline performance tend to improve by a larger degree than participants at a higher baseline performance.
Across each of the first five test instances, the PD participants showed a higher level of performance variability (58 ± 1.25 taps) than both the HC (48 ± 1.8 taps) and YHC (47.8 ± 1.3 taps) subsets.
Of the 137 PD participants, 11 reported that do not take any medication for their PD symptoms, and the remaining 126 participants reported taking medication. No difference is seen in baseline performance between participants who take medication and those who do not (p = 0.58).
Of the 126 participants who take medication, 22 reported being in the OFF state ('before medication') and 33 reported being in the ON state ('after medication') at baseline. No difference is seen in performance between the participants in the ON and OFF states (p = 0.59). Seventy participants were identified as being in the same medication state at baseline and at fifth visit. These participants also showed a significant change between baseline and fifth visit (p = 0.04) thus demonstrating that the significant changes in performance are not a response to medication.
3.1.2. Longitudinal behaviour
In the LTB subset data, we find significant impairment between the PD and HC participants (p < 0.001) and the PD and YHC participants (p < 0.001) in baseline performance.
Each participant's learning-phenotype is determined based on equations (1) and (3). The longitudinal performance of each participant group, and each of the three L-PTs, can be seen in figure 1.
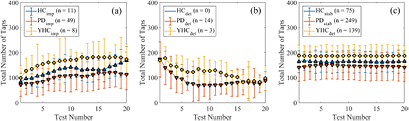
Figure 1. The LTB over the first 20 test instances in the tapping activity for participants identified as (a) improving, (b) deteriorating and (c) stable.
Download figure:
Standard image High-resolution imageOver 20 test instances, the improving YHC, HC, and PD participants increased their performance by an average of 75, 86, and 40 taps respectively (figure 1(a)). The improving PD and HC participants showed a significant difference between their baseline performance and 20th test performance, both with p < 0.001, whereas the improving YHC participants approached significance with p = 0.051.
No significant changes in performance were seen for any of the stable YHC, HC, or PD participants. The stable PD participants maintained a significant impairment in performance compared to the HC and YHC participants over the first 20 test instances (figure 1(c)).
The proportion of each sub-group showing transient (not stable) behaviour can be seen in table 3. The Binomial proportional test is used to determine if PD participants are more likely to show transient behaviour than HCs. We find a significantly larger proportion of PD participants show transient behaviour compared to the YHC participants (Z = 3.67, p < 0.001) whereas the proportion of PD and HC participants showing transient behaviour approaches significance (Z = 1.56, p = 0.059). To account for the effects of age, a Binomial proportional test was also performed between the YHC and HC participants yielding insignificant differences in the number of transient participants between the groups (p = 0.134).
Table 3. Baseline and longitudinal characteristics of each of the three learning phenotypes in the three participant groups in the tapping activity.
| % of sub-group | Baseline value (±SD) | Final value (±SD) | Progress ratio (±SD) | Steady state index (±SD) | ||
|---|---|---|---|---|---|---|
| YHC (n = 150) | Imp. | 5.3 | 96.0 ± 51.6 | 182.8 ± 94.9 | 1.33 ± 0.18 | 5.3 ± 4.1 |
| Det. | 2.0 | 172.3 ± 9.5 | 122.7 ± 68.1 | 0.78 ± 0.02 | 7.3 ± 1.5 | |
| Stab. | 92.7 | 183.9 ± 43.5 | 180.0 ± 43.4 | 1.00 ± 0.07 | 2.0 ± 4.5 | |
| HC (n = 86) | Imp. | 12.8 | 80.64 ± 16.8 | 115.82 ± 51.5 | 1.30 ± 0.09 | 4.3 ± 3.1 |
| Det. | 0 | N/A | N/A | N/A | N/A | |
| Stab. | 87.2 | 157.03 ± 43.4 | 164.99 ± 35.5 | 1.01 ± 0.08 | 1.1 ± 1.0 | |
| PD (n = 312) | Imp. | 15.7 | 81.65 ± 45.5 | 136.39 ± 57.4 | 1.46 ± 0.45 | 16.6 ± 26.6 |
| Det. | 4.5 | 146.57 ± 70.2 | 76.57 ± 30.1 | 0.71 ± 0.08 | 11.3 ± 10.7 | |
| Stab. | 79.8 | 136.81 ± 54.7 | 139.95 ± 54.9 | 1.01 ± 0.09 | 2.3 ± 5.4 | |
In addition to determining if PD participants are more likely to show transient behaviour, we use the SSI to measure if PD participants take longer to learn a task. The PD participants show significantly larger SSI values than the HCs (p = 0.013) and YHCs (p = 0.015). Further dividing the PD group into its L-PTs (final column of table 3), we see that this difference is caused by the much larger SSIs of the improving and deteriorating participants. Across the entire LTB subset, the time (in days) of each test relative to the first test is found to correlate very highly with test index (Pearson R = 0.95), validating that SSI is a suitable measure for time taken to reach a steady state.
Of the 312 PD participants in the LTB subset, 24 self-reported as not-medicated, and the remaining 288 as medicated. Six of the non-medicated participants showed transient behaviour and the remaining 18 were stable. We found no difference between the proportion of medicated participants that showed transient behaviour compared to non-medicated participants (Z = 0.28, p = 0.77).
3.1.3. Severity correlation
Prior to splitting the PSS based on severities, from the first row of table 4 we see that in all cases the SSP has a stronger correlation with severity than baseline performance.
Table 4. Spearman correlation coefficients between baseline values (BV) and SSP with severity scores for the tapping activity with significant correlations (at the 0.05 level) shown in bold.
| L-PT | Total UPDRS | Section II UPDRS | UPDRS 2.4 | ||||
|---|---|---|---|---|---|---|---|
| Baseline | Steady state perf. | Baseline | Steady state perf. | Baseline | Steady state perf. | ||
| All severities | −0.15 | −0.22 | −0.16 | −0.21 | −0.17 | −0.24 | |
| Total UPDRS | Severe | −0.36 | −0.54 | −0.32 | −0.41 | −0.27 | −0.47 |
| Not severe | −0.17 | −0.19 | −0.18 | −0.19 | −0.16 | −0.20 | |
| Tapping | Severe | −0.37 | −0.49 | −0.36 | −0.40 | −0.34 | −0.43 |
| Not severe | −0.04 | −0.11 | −0.06 | −0.09 | −0.09 | −0.17 | |
When splitting the PSS based on UPDRS severity, we again observe that in all cases the SSP has a stronger correlation with severity when compared to the baseline performance. Similarly, when splitting the PSS based on tapping performance, we find the SSP to have a stronger correlation with severity than baseline performance.
In both splitting approaches, we find that the performance of severe participants systematically have stronger correlations with severity scores when compared to non-severe participants. Further, we find that splitting the participants in such a way produces statistically significant correlations of increased and moderate strengths.
In addition to correlating tapping performance with the total UPDRS and Section II UPDRS (motor experiences of daily life) scores, we found that UPDRS 2.4 ('Over the past week have you usually had troubles handling your food and easting utensils') also correlated significantly with performance in both splitting techniques.
Figure 2 demonstrates the relationship between years since diagnosis and total UPDRS for all PD participants in the entire dataset. The correlations between years since diagnosis and severity scores for the tapping PSS are given in table 5. Further, we found weak correlations between years since diagnosis and age in the Longstanding Diagnosis group (R = 0.01) and in the recent diagnosis group (R = 0.03).
Table 5. Spearman correlation coefficients between participants' years since diagnosis and their severity scores and tapping performances with significant correlations (at the 0.05 level) shown in bold.
| UPDRS | Performance | |||||
|---|---|---|---|---|---|---|
| Total | Section II | UPDRS 2.4 | Baseline | Steady state perf. | ||
| All Diagnoses | 0.34 | 0.36 | 0.23 | 0.02 | 0.05 | |
| Diagnosis | Longstanding | 0.35 | 0.41 | 0.38 | 0.02 | 0.06 |
| Recent | 0.25 | 0.23 | 0.11 | 0.02 | 0.04 | |
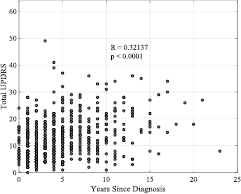
Figure 2. The relationship between years since diagnosis and total UPDRS for all PD participants in the mPower dataset who contributed a UPDRS survey.
Download figure:
Standard image High-resolution imageThe UPDRS floor effects were large within each of the 16 individual questions. On average, 47.1% of responses to each question were the lowest possible score (0—'Normal'). Conversely, the ceiling effects within each question were small, with an average 'Severe' response rate of 1.0% with six of the questions not containing any 'Severe' subjects. The UPDRS 2.4 question consisted of 54.2% 'Normal' responses whereas no instances of the maximum score of four ('Severe') were reported. These effects are not reflected in the total UPDRS score (summation of each question) with no subjects reporting the lowest or highest scores possible (zero and 64 respectively).
3.2. Memory
3.2.1. Short-term behaviour
At baseline performance, the 91 PD participants showed no significant memory impairment (as quantified using the total memory score) compared to the 11 HC and the 10 YHC participants. However, after five repetitions PD participants differed from the YHC group significantly (p = 0.04).
Performing paired t-tests between the baseline performance and performance at the fifth repetition for the YHC, HC, and PD groups yields p-values of 0.29, 0.15, and 0.04 respectively. This finding is consistent with the equivalent result in the tapping activity and demonstrates that the only participant group showing a significant level of change at the 0.05 level are the PD participants.
For all participants we again find that the change in performance over the first five test instances correlates with baseline performance (R = −0.49), showing that participants with a lower baseline memory performance are more likely to improve than participants with a higher baseline performance.
3.2.2. Longitudinal behaviour
In the LTB subset data, we find there to be no significant memory impairment between PD, HC, or YHC participants in baseline performance. The small sample size available is noted when drawing conclusions from these tests.
Over 10 test instances, the improving YHC, HC, and PD participants increased their memory score by an average of 47.5, 80.0, and 80.4 points respectively (figure 3(a)) although none of the improving groups showed a significant change between baseline and 10th instance performance.
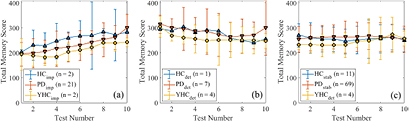
Figure 3. The LTB over the first 10 test instances in the memory activity for participants identified as (a) improving, (b) deteriorating and (c) stable. Note: a higher memory score denotes better test performance.
Download figure:
Standard image High-resolution imageThe proportion of each sub-group showing transient behaviour can be seen in table 6. Due to the insufficient number of participants in each of the YHC and HC Binomial proportion tests are inappropriate.
Table 6. Baseline and longitudinal characteristics in the memory activity of each of the three learning phenotypes in the three participant groups.
| % of sub-group | Baseline value (±SD) | Final value (±SD) | Progress ratio (±SD) | Steady state index (±SD) | ||
|---|---|---|---|---|---|---|
| YHC (n = 10) | Imp. | 20.0 | 195.0 ± 63.6 | 225.00 ± 63.6 | 1.26 ± 0.12 | 5.5 ± 3.5 |
| Det. | 40.0 | 287.5 ± 42.1 | 223.75 ± 19.7 | 0.86 ± 0.03 | 5.3 ± 2.5 | |
| Stab. | 40.0 | 233.8 ± 17.5 | 235.00 ± 55.8 | 1.01 ± 0.06 | 1.0 ± 0 | |
| HC (n = 14) | Imp. | 14.3 | 202.5 ± 10.6 | 300.0 ± 56.6 | 1.16 ± 0.03 | 1.5 ± 0.7 |
| Det. | 7.1 | 295.0 ± 0 | 240.0 ± 0 | 0.87 ± 0 | 7 ± 0 | |
| Stab. | 78.6 | 273.6 ± 47.2 | 254.6 ± 62.1 | 0.98 ± 0.04 | 1.0 ± 0 | |
| PD (n = 97) | Imp. | 21.7 | 200.9 ± 47.1 | 255.0 ± 65.5 | 1.24 ± 0.19 | 5.8 ± 6.2 |
| Det. | 7.2 | 323.6 ± 36.6 | 231.4 ± 44.2 | 0.80 ± 0.10 | 11.6 ± 13.5 | |
| Stab. | 71.1 | 257.3 ± 51.4 | 255.9 ± 52.7 | 0.99 ± 0.05 | 1.8 ± 4.8 |
No difference is found between any of the group SSI values. We see in table 6 that the deteriorating PD participants have the longest average SSI, although this L-PT is also restricted in participant numbers (n = 7).
3.2.3. Severity correlation
From the first row of table 7 we find that the SSP tends to have a weaker correlation with severity than baseline performance. This result is also seen when splitting the participants based on UPDRS severity and based on performance impairment.
Table 7. Spearman correlation coefficients between BV and SSP with severity scores for the memory activity with significant correlations shown in bold.
| L-PT | Total UPDRS | Section I UPDRS | UPDRS 1.1 | ||||
|---|---|---|---|---|---|---|---|
| Baseline | Steady state perf. | Baseline | Steady state perf. | Baseline | Steady state perf. | ||
| All severities | −0.14 | −0.04 | −0.16 | 0.08 | −0.01 | −0.03 | |
| Total UPDRS | Severe | −0.43 | −0.10 | −0.18 | −0.08 | −0.33 | −0.20 |
| Not severe | −0.13 | −0.01 | −0.17 | −0.14 | −0.01 | 0.06 | |
| Memory | Severe | −0.33 | −0.08 | −0.51 | −0.16 | −0.36 | −0.01 |
| Not severe | −0.03 | −0.01 | −0.06 | −0.19 | −0.13 | −0.09 | |
However, in both splitting approaches the performance of the severe/impaired participants have stronger correlations with severity scores than when compared to non-severe/non-impaired participants. Consistent with the equivalent results in the tapping analysis, we again find that the severe/impaired participants produce several statistically significant correlations with moderate strength.
In addition to correlating memory performance with the total UPDRS and Section I UPDRS (non-motor experiences of daily life) scores, we found that UPDRS 1.1 ('Over the past week have you had problems remembering things, following conversations, paying attention, thinking clearly, or finding your way around the house or in town?') also correlated significantly with performance in both splitting techniques.
The correlations between years since diagnosis and severity scores for the memory PSS are given in table 8. Again, we found weak correlations between years since diagnosis and age in the Longstanding Diagnosis group (R = 0.07) and in the recent diagnosis group (R = 0.04).
Table 8. Spearman correlation coefficients between participants' years since diagnosis and their severity scores and tapping performances with significant correlations (at the 0.05 level) shown in bold.
| UPDRS | Performance | |||||
|---|---|---|---|---|---|---|
| Total | Section I | UPDRS 1.1 | Baseline | Steady state perf. | ||
| All diagnoses | 0.35 | 0.19 | 0.04 | −0.11 | −0.10 | |
| Diagnosis | Longstanding | 0.10 | 0.06 | 0.04 | −0.19 | 0.02 |
| Recent | 0.22 | 0.19 | 0.02 | −0.17 | −0.05 | |
The UPDRS floor effects were again large within each of the 16 individual questions. On average, 47.8% of responses to each question were the lowest possible score. Consistent with the tapping activity, the ceiling effects within each question were small, with an average 'Severe' response rate of 0.7%. In 13 of the questions, no subjects reported a 'Severe' score. The UPDRS 1.1 question consisted of 54.8% 'Normal' responses whereas no subjects reported the maximum score of four ('Severe'). These effects are not seen in the total UPDRS score (summation of each question) with no subjects reporting the lowest or highest scores possible.
3.3. Disease characteristics between sexes
A total of 1087 participants have a professional diagnosis of PD and 5581 participants are healthy. Within the PD participants, we find a higher proportion of males than females, with males accounting for 65.8% of cases. Interestingly, this sex imbalance is present in the healthy participants also, with males accounting for 80.8% of the healthy cases. However, of the 5314 male participants only 13.5% are PD cases. Of the 1461 female participants, 25.3% are PD cases.
Although an imbalance exists between sexes (more males than females in cohorts of PD and health controls), the participants are well age matched with respect to the ages at which males report disease onset (56.6 ± 9.6 years) showing no significant difference to that of females (56.2 ± 9.0 years) (p = 0.53). This finding is overall consistent with the age at which professional diagnosis occurs; males (58.4 ± 9.0 years) and females (57.9 ± 8.4 years) (p = 0.44).
In the tapping activity, we find no difference in starting performance between males (135.4 ± 61.3 taps) and females (133.9 ± 58.0 taps) (p = 0.73). Similarly, in the memory activity, the starting performance of males (254.5 ± 57.1) shows no significant difference to that of females (256.9 ± 63.2) (p = 0.74).
In the tapping activity, the results of the Binomial proportion tests showed no statistical difference between the proportion of male (N = 179) to female (N = 133) participants in the improving (p = 0.61), deteriorating (p = 0.91), and stable (p = 0.42) phenotypes. Similarly, in the memory activity, the proportion of male (N = 58) and female (N = 39) participants in the improving (p = 0.75), deteriorating (p = 0.88), and stable (p = 0.38) phenotypes showed no significant differences.
3.4. Relationship between motor and non-motor tasks
Of the 107 participants who were in both the tapping and memory longitudinal analyses there were 13 HCs and 94 PDs. Figure 4 shows how these participants performed longitudinally in both the tapping and memory activities.

Figure 4. Confusion plot of inter-activity LTB. Numbers quoted are the percentage of the population that fall into each segment. The central black figures are the percentages of all 107 participants in the analysis. The lower left numbers in blue are the percentage of the 13 HC participants. The lower right numbers in red are the percentage of the 94 PD participants.
Download figure:
Standard image High-resolution image
The HC and PD participants were well age matched with ages of 64.9 ± 7.3 and 65.5 ± 6.3 respectively. As the memory activity was introduced six months after the tapping activity, these results do not show the concurrent relationship between the activities, but rather how participants perform when learning two new tasks which assess different areas of the disease.
4. Discussion
In a hospital environment the collection of high frequency longitudinal data from a large subject group would be costly and strategically difficult. Subsequently, research objectives are now being turned to exploiting remotely acquired datasets, such as in the mPower study, to validate clinical findings in large cohorts whilst gaining new insights into the longitudinal characteristics of PD. In this study, we demonstrate that clinically validated features can be used to remotely identify task learning using smartphones. From a large cohort of PD subjects and healthy controls, we find that a small fraction of subjects show transient LTB which has previously gone undetected in smaller datasets. Furthermore, subjects with PD are more likely to show transient LTB whilst also tending to take longer to reach a steady performance in the AFT test and the SSP are found to correlate better with disease severity than baseline performance. When investigating the floor-ceiling effect in the mPower UPDRS survey, significant correlations between performance and severity are found within the most severe participants, but not in the less severe subjects, whilst many of the individual UPDRS questions show a large floor effect that is not found in the total UPDRS score.
On the large mPower cohort, we have validated the clinical finding that PD participants show an impaired motor performance and the ability to improve the AFT activity over a period of five repetitions. Participants who are in the same medication state at baseline and at their fifth repetition showed a significant performance change. This result demonstrates that the change in performance is not a consequence of medication response, as has previously been suggested, but rather due to practise and learning of the test (Anderson et al 2014). Intuitively, we find across all subject groups and ages that subjects with a lower baseline performance are more likely to improve than those with a higher baseline performance.
In the tapping activity, we found that only a small fraction of all subjects showed transient behaviour and that the PD group tended to improve by a lesser degree over the first 20 instances than both the HC groups. This finding is unlikely to have been detected in previous studies due to the low subject numbers, lack of longitudinal data, and the small proportion of subjects showing this behaviour. The majority of subjects in all groups showed stable LTB, although the PD group was found to have a significantly larger proportion of subjects showing transient behaviour compared to both the healthy control groups. Consequently, the PD participants took a significantly larger number of test instances before they reached their SSP. These longitudinal variations should be incorporated into the medication response models which have formed the majority of the work on the mPower dataset so far (Chaibub Neto et al 2016, Neto et al 2017).
Although no impairment is seen in the PD participants at baseline in the memory activity, the PD participants are the only group to show a significant change between baseline and the fifth repetition of the activity, consistent with the tapping activity. We also find that subjects with a lower starting performance tend to improve by a larger degree than subjects with a higher starting performance. The longitudinal memory behaviour analysis was more restricted in participant numbers than the tapping activity meaning proportional tests were inappropriate and were not performed. Unlike the majority of the non-motor learning in PD literature, the mPower study does not utilise the SRT test, which assesses both long- and short-term memory through multiple tests showing a repeated sequence of stimuli. Subsequently, the mPower memory activity does not provide a means of assessing declarative learning, which has shown significant impairment in PD subjects (Muslimović et al 2007).
In the tapping activity, we find the SSP is a better predictor of severity than baseline performance. This suggests that starting performance at a new motor task is less representative of disease severity than the performance after the test has been learnt. However, this phenomenon is not seen in the memory activity. The number of subjects showing learning behaviour in the memory activity is smaller than in the tapping activity, thus the smaller amount of longitudinal change occurring in the performance combined with the generally weaker baseline correlations is reflected by the intuitive decrease in correlation strength with SSP.
When correlating years since diagnosis and total UPDRS for all PD participants, as shown in figure 2, we find a significant correlation of moderate strength (R = 0.32, p < 0.0001); intuitively demonstrating that disease severity worsens with time. This finding is also seen when limiting our sample to the participants in each activity in the PSS. However, although the Section II score (motor) of UPDRS shows a similarly strong correlation with years since diagnosis, we find weak correlations between the Section I score (non-motor) and years since diagnosis. This result may be interpreted in two ways. Firstly, this could imply that motor deterioration is more pronounced than non-motor deterioration, which has also been suggested in a cohort of 707 subjects over a two year period (Antonini et al 2012). Secondly, accounting for the fact the UPDRS is self-assessed, it may be that participants are more aware of motor deterioration than non-motor. Using longitudinal smartphone data and clinically assessed UPDRS collected from a larger cohort, future studies could make more informed inferences regarding the difference in rates of motor and non-motor degradation over time. Conversely, weak correlations were found between years since diagnosis and the baseline and SSP measures in both activities.
In our investigation of floor-ceiling effects, we find that in both activities the performance of severe subjects consistently have a stronger correlation with severity scores than the non-severe subjects. Additionally, although very large floor effects are seen within each of the individual questions, neither floor nor ceiling effects are found in the total UPDRS score. These findings are a consequence of many subjects reporting low/mild severity for several questions and no severity for the majority of questions, thus, for many subjects, the total UPDRS severity is being diluted by the many questions being reported as zero. Accordingly, only subjects experiencing mild/severe symptoms in multiple aspects of the disease are grouped as Severe as they report many instances of mild/severe severities in the UPDRS survey. Hence, in the non-severe group, many subjects may report a severe impairment localised to one aspect of the disease, but no impairment in the remaining aspects, and therefore go undetected. This is reflected in the large divide in correlation strengths between feature performance and disease severities between the severe and non-severe groups.
There is an imbalance between sexes in the mPower dataset with roughly 80% of all participants being male. We find that the imbalance between sexes in the mPower PD population is consistent with previous studies, demonstrating a higher incidence rate in males than in females. Although an imbalance exists between sexes, it is still appropriate to compare the performance and diagnosis metrics of the sexes as both samples contain a large number of participants even after their age matching. Fortunately, our LTB subset is less severely affected by the sex imbalance. Binomial proportion tests demonstrate that the proportion of male and female participants in each L-PT is statistically similar, thus ruling out participant sex as a confounding factor in L-PT classification.
The 'big' data collected through the use of smartphones is enabling multiple aspects of PD to be studied concurrently. Determining the complex relationship between motor and non-motor symptoms has thus far been restricted by clinical studies investigating a single activity such as gait, tapping, memory, or cognition. The multiple activity types being completed on smartphone collection systems on a regular basis present the opportunity to overcome this restriction. When comparing the LTB of a small number of participants across the tapping and memory activities, we observe a non-diagonal relationship between their learning-phenotypes.
A recurring limitation with remotely collected big datasets is the lack of longitudinal subject compliance (Bot et al 2016, Arroyo-Gallego et al 2017). In the tapping activity, we found 548 (6.8%) of the initial 8003 subjects contributed at least 20 instances. Furthermore, compliance levels greatly differ between HC and PD participants. Of the 5357 HC participants at baseline, only 236 (4.4%) contributed at least 20 instances. Conversely, 312 of the 1060 PD participants (29.4%) at baseline contributed at least 20 instances. In the memory activity, we were forced to lower the minimum number of instances required to be eligible for analysis to 10, resulting in 121 (12.5%) of the initial 968 subjects being eligible. The reduced number of subjects participating in the memory activity is a knock-on effect of this limitation as it was introduced over a month after the initial application release. Many of the participants who were active at the start of the study had stopped using the mPower application by the time the memory activity was released whilst the number of new participants enrolling in the study had plateaued. However, although the compliance level is relatively low, the longitudinal data from these datasets is still significantly larger than in previous studies. The use of passive monitoring (continuous data collection when the smartphone application is not actively being used) ensures a high level of compliance and is currently being implemented by several studies (Sharma et al 2014, Zhan et al 2016). However, this type of data is nearly entirely unlabelled making activity recognition and feature extraction more challenging.
We finalize our discussion by considering future applications of our longitudinal analysis framework whilst speculating on techniques that may improve remote data collection. In this study, we focused on a single feature from each activity, however, exploring the LTB of additional features may facilitate better prediction of other aspects of the subset of UPDRS survey. For example, in the tapping activity, monitoring features pertaining to fatigue or finger displacement could act as proxy measures for resting tremor, for which there is a specific question in the mPower UPDRS survey. An additional progression of this study would be to utilize the additional gait and voice activities within the mPower dataset. The associated challenges in these data are the influence of differing environmental conditions, such as inclined walking surfaces and background noise, making it challenging to extract features that are robust at both the inter- and intra-participant level. Furthermore, these robust features would only be beneficial to longitudinal analyses if they are interpretable and relatable to at least one of the limited number of clinical severity measures. Finally, it is common in clinical based studies to also recruit the PD participant's spouse; usually yielding an approximately age and sex balanced control participant. If volunteers of remote studies were to be encouraged to ask their spouse to also enrol, the resulting datasets may not only be larger, but may also not contain the imbalances this research has highlighted are present in the current dataset.
5. Conclusion
Using the remotely collected mPower dataset, we investigated the short-term and LTB of people with PD and HCs in a motor test and a separate non-motor test. We found significant impairments in the motor activity on both a short and long term basis, whereas no such impairment existed in the non-motor test. In both tests, we identified a previously unseen small fraction of participants who show transient LTB, with this transient behaviour being more common in PD participants than in HCs. The findings in this work motivate the study of longitudinal performance in the additional, and more environmentally dependant, tests also being measured remotely on smartphones such gait and voice.
Acknowledgments
JP acknowledges the support of the RCUK Digital Economy Programme grant number EP/G036861/1 (Oxford Centre for Doctoral Training in Healthcare Innovation).
These data were contributed by users of the Parkinson mPower mobile application as part of the mPower study developed by Sage Bionetworks and described in Synapse (doi:10.7303/syn4993293). Due to the confidential nature of some of the research materials supporting this publication (the mPower data and supporting UPDRS scores) not all of the data can be made accessible to other researchers. Please contact the corresponding author for more information.
The research was supported by the National Institute for Health Research (NIHR) Oxford Biomedical Research Centre (BRC).
This research was funded by the Wellcome Trust Centre (grant number 098461/Z/12/Z) (Sleep, Circadian Rhythms and Neuroscience Institute).
Footnotes
- 3
From the mPower demographics survey it is only possible to calculate the year since diagnosis to the closest integer we therefore round our threshold down to the nearest integer.