

Abstract
Objective. Non-primary radiation doses to normal tissues from proton therapy may be associated with an increased risk of secondary malignancies, particularly in long-term survivors. Thus, a systematic method to evaluate if the dose level of non-primary radiation meets the IEC standard requirements is needed. Approach. Different from the traditional photon radiation therapy system, proton therapy systems are composed of several subsystems in a thick bunker. These subsystems are all possible sources of non-primary radiation threatening the patient. As a case study, 7 sources in the P-Cure synchrotron-based proton therapy system are modeled in Monte Carlo (MC) code: tandem injector, injection, synchrotron ring, extraction, beam transport line, scanning nozzle and concrete reflection/scattering. To accurately evaluate the synchrotron beam loss and non-primary dose, a new model called the torus source model is developed. Its parametric equations define the position and direction of the off-orbit particle bombardment on the torus pipe shell in the Cartesian coordinate system. Non-primary doses are finally calculated by several FLUKA simulations. Main results. The ratios of summarized non-primary doses from different sources to the planned dose of 2 Gy are all much smaller than the IEC requirements in both the 15–50 cm and 50–200 cm regions. Thus, the P-Cure synchrotron-based proton therapy system is clean and patient-friendly, and there is no need an inner shielding concrete between the accelerator and patient. Significance. Non-primary radiation dose level is a very important indicator to evaluate the quality of a PT system. This manuscript provides a feasible MC procedure for synchrotron-based proton therapy with new beam loss model. Which could help people figure out precisely whether this level complies with the IEC standard before the system put into clinical treatment. What' more, the torus source model could be widely used for bending magnets in gantries and synchrotrons to evaluate non-primary doses or other radiation doses.
Export citation and abstract BibTeX RIS

Original content from this work may be used under the terms of the Creative Commons Attribution 4.0 licence. Any further distribution of this work must maintain attribution to the author(s) and the title of the work, journal citation and DOI.
1. Introduction
Non-primary radiation is radiation emitted from radiation therapy equipment that is not intended to treat the patient (IEC 60601-2-64 2003). Non-primary radiation doses to normal tissues may be associated with an increased risk of secondary malignancies, particularly in long-term survivors (Kry et al 2005, Brenner et al 2000, Hendrickson et al 2020). For example, Brenner et al (2000) observed an increased occurrence of second malignancies for prostate patients undergoing radiation therapy compared to those undergoing surgery. Proton therapy (PT) is an advanced particle therapy (Mohan and Grosshans 2017, Mohan 2022) with unique dosimetric properties resulting in a reduced entrance dose and minimal to no exit primary dose compared with standard photon radiation therapy. Clinical data supporting the lower incidence of secondary malignancies after PT compared with historical photon data are emerging (Eaton et al 2015, Sakthivel et al 2019).
Different from the traditional photon radiation therapy system, typical PT systems are composed of several subsystems in different rooms, such as an accelerator, a beam transport line (BTL), and a scanning nozzle (Addendum 2009, Smith et al 2009, Schippers and Lomax 2011). These subsystems are potential sources of non-primary radiation doses, as secondary particles, especially neutrons, are generated by high-energy proton loss in matter during beam transport (Agosteo et al 1998, Carnicer et al 2012, Urban and Kluson 2012). Typically, an inner shielding wall between the patient and accelerator/BTL is built in the traditional shielding design of PT facilities to reduce non-primary dose in treatment rooms (Addendum 2009).
Some new compact single-room solutions still have inner shielding walls between the patient and machine, e.g. IBA Proteus ONE (Stichelbaut 2014) and Varian ProBeam (Schillo 2014). For a cyclotron, an energy selection system (ESS) is usually necessary for clinical applications. The ESS generates high-energy neutrons, which requires thick shielding walls around it. However, the MEVION S250 has a compact design without inner shielding (Prusator et al 2018, Gajewski et al 2020). A synchrotron can directly extract different energy protons as required by the treatment planning system (TPS), which means that a synchrotron-based PT system can work without an ESS. This enables the design of an even more compact proton facility without an inner shielding wall as proved by our previous calculation for NewRT system (Wang et al 2020).
Section 201.10.2.101.4.3 of the IEC 60601-2-64 standard describes the non-primary radiation dose limits for patients in the treatment area. As shown in figure 1, the maximum absorbed dose in the range of 15–50 cm laterally from the beam axis cannot exceed 0.5% of the dose amount delivered to the isocenter. In the patient plane at a lateral distance in the range of 50–200 cm, the maximum absorbed dose from all radiation types must be below 0.1% of the dose delivered to the isocenter (IEC 60601-2-64 2003).
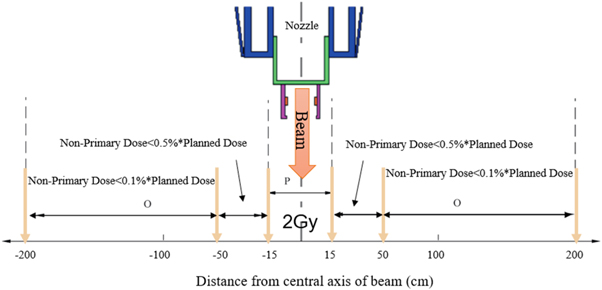
Figure 1. Diagram illustrating the distance along the patient plane for measuring non-primary radiation absorbed dose.
Download figure:
Standard image High-resolution imageNon-primary radiation dose level is a very important indicator to evaluate the quality of a PT system, especially for compact proton facilities without inner shielding walls. If the non-primary radiation dose level around the patient is quite lower than the IEC standard, then we call the system a clean PT system. However, there is no systematic evaluation method to perform this research because different systems have their own specific complex sources of non-primary radiation. This manuscript provides a torus source model for synchrotron radiation and non-primary radiation, which are systematically investigated based on the source model. This work determines where non-primary radiation comes from, what the dose level is, and whether this level complies with the IEC standard.
2. Materials and methods
2.1. Compact PT system and non-primary radiation sources
Smaller (and thus cheaper) synchrotrons, with diameters down to 5 m have been developed in the last decade (Paganetti et al 2021). Compact synchrotrons are widely used as a main accelerator by manufacturers such as P-Cure (Balakin et al 2018, Pryanichnikov et al 2018), Protom (Addendum 2009, Balakin et al 2021), NewRT (Wang et al 2020), APTron (Xu et al 2013), and Hitachi (Hiramoto et al 2007, Umezawa et al 2015). This manuscript investigates the PT system provided by P-Cure as a case study, which can accelerate protons to 30–330 MeV with a 4.5 m diameter ring. However, 250 MeV is sufficient for maximum clinical requirements.
To calculate an accurate absorbed dose distribution, a dedicated geometry with a tandem injector, injection, a synchrotron ring, extraction, a BTL, and a scanning nozzle is constructed and simulated in FLUKA. The layout can be found in figure 2, and the beam loss is shown in table 1.

Figure 2. Monte Carlo geometry of the synchrotron-based PT system. Dedicated geometry with a tandem injector, injection, a synchrotron ring, extraction, a BTL, and a scanning nozzle.
Download figure:
Standard image High-resolution imageTable 1. Beam loss.
| No. | Source | Target material | Loss model | Energy [MeV] | Weight on energy | Weight summary of source | Category |
|---|---|---|---|---|---|---|---|
| 1 | Target | Water | Concentration | SOBP | SOBP weight | 31.7% | Patient |
| 250 | 0.5% | ||||||
| 2 | Scanning nozzle | Stainless steel | Concentration | 120 | 0.5% | 2.7% | |
| 70 | 1.6% | ||||||
| 250 | 0.5% | ||||||
| 3 | BTL | Iron | Straight pipe | 120 | 0.5% | 1.6% | |
| 70 | 0.5% | ||||||
| 250 | 12.6% | ||||||
| 4 | Extraction | Iron | Concentration | 120 | 12.0% | 34.4% | System |
| 70 | 9.8% | ||||||
| 250 | 1.6% | ||||||
| 5 | Synchrotron ring | Iron | Torus source | 20 | 0.5% | 18.6% | |
| 2.1 | 16.4% | ||||||
| 6 | Injection | Iron | Concentration | 2 | 10.9% | 10.9% | |
| 7 | Concrete reflection | Concrete | — | — | — | — |
The major difference compared with our previous work is beam loss model of beam pipes through bending magnets (Wang et al 2020). For NewRT system, to simulate the proton-transport process, synchrotron and BTL dipole magnets are set with a given magnet field in their central zone, then the protons loss behavior is controlled by magnet field. The disadvantage of this method is obvious.
- (1)The beam loss direction will be biased to one side if the magnet field is not properly set up.
- (2)Proton of momentum when
 (G: Magnetic rigidity, q: charge of a proton) can travel forever in the accelerator ring without loss, this will underestimate the dose level.
 - (3)There is no proton loss on up or down inner pipe shell.

The process of non-primary radiation evaluation is similar to radiation shielding evaluation, as both need to calculate dose generate by all the sources from system and target. However, for shielding, radiation dose outside the bunker is not that sensitive to models from sources but very sensitive to energy and weight. For nonprimary, radiation dose inside the bunker is considered which is sensitive to both source models, and energy weight. Thus, the old model would be not suitable for non-primary radiation evaluation as the IEC regions are close to magnets of synchrotron and BTL. Thus, new models of torus source beam loss model and uniform straight pipe beam loss model are adopted for current research.
There are seven non-primary radiation sources in this case:
- (1)The target itself: the target is a water tank at the isocenter in place of the patient. Planned dose irradiation of patient generates large amounts of secondary patient, including neutrons, photons, protons and so on (Robert et al 2013). All these secondary particles contribute to non-primary dose around the target. The proton beam loss at the target is 31.7%. A 2 Gy spread-out Bragg peak (SOBP) was modulated to approximate clinical conditions as accurately as possible (Wang 2019a). The range depth with different weights ranges from 22 to 32 cm, as shown in figure 3. Weight adaption-based SOBP method is adopted here again same as in our previous work in reference (Wang et al 2020) figure 7. The only difference is the range extend from 8 to 10 cm.
- (2)The scanning nozzle consists of two scanning magnets, a vacuum chamber, and several ionization chambers (ICs). The beam path of the scanning nozzle is in a vacuum chamber. There is approximately 2.7% proton loss in the beam path during scanning, and a dedicated Monte Carlo (MC) nozzle model is implemented in this case (Wang 2019b). The energy ranges from 70 to 250 MeV.
- (3)The BTL is short and consists of several magnets. The center of the BTL is a vacuum tube, and there is approximately 1.6% proton loss evenly distributed on the beam pipe. The energy ranges from 70 MeV to 250 MeV. The uniform straight pipe beam loss model demonstrated by Xu et al (2016) is adopted in this study.
- (4)Extraction: there is 34.4% proton loss during extraction as a concentration point source. The energy ranges from 70 to 250 MeV.
- (5)The synchrotron ring consists of a magnetic system and a radio frequency acceleration system. The magnetic system of the synchrotron is formed by four identical quadrants separated by large free gaps connected by beam pipes. Each quadrant is formed by four C-shaped iron blocks with parallel poles. The four magnets with a homogeneous field in each quadrant are arranged in a pairwise common winding configuration. There is 18.6% proton loss in the center of each quadrant, which can be described by the torus source beam model. The torus source beam loss model will be discussed in the next section. The proton energy in the synchrotron ring ranges from 2 to 250 MeV.
- (6)Injection: the injector is designed for the initial production of protons and their acceleration to an energy of approximately 2 MeV. The injector consists of a pulsed arc source of ions with a pulsed hydrogen inlet, electrostatic lenses, and a tandem high-voltage accelerator. There is 10.9% proton loss in this process, but these protons contribute little to non-primary radiation, as 2 MeV protons mostly generate x-rays.
- (7)Concrete reflection and scattering: secondary particles such as neutrons, photons, and protons from (1) to (6) could be reflected or scattered by the shielding concrete wall around the PT system. This part is difficult to distinguish from the sources of (1)–(6); thus, a full MC model including a concrete wall should be established for non-primary radiation evaluation as shown in figure 4.
All sources are summarized in table 1, and there are two large categories: one is the target at the isocenter in place of the patient, and the other is the system including sources (2)–(7). These two categories are set because there is an advantage of easily distinguishing how the PT system impacts the non-primary dose.
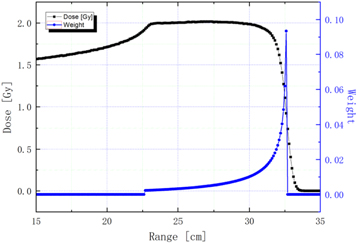
Figure 3. SOBP, where the range depth with different weights ranges from 22 to 32 cm. Dark line: absorbed dose distribution. Blue line: proton energy weight.
Download figure:
Standard image High-resolution image
Figure 4. Secondary particles reflected or scattered by the shielding concrete wall around the PT system.
Download figure:
Standard image High-resolution image2.2. Torus source beam loss model
To describe beam loss in the four quadrants as close to realistically as possible for a synchrotron, a torus source model is developed in this work. A torus can be made by revolving a small circle (radius  ) along a larger circle (radius
  ). As shown in figure 5, a torus beam pipe is defined by two radii
  and
and  and thickness
  Here,
Here, 
 and
and  for example. Inside the pipe is a vacuum, and a uniform magnetic field maintains the beam orbit in the center. The vector of loss proton
  (dashed blue line) has a small angle
  to the beam orbit. The pipe shell is iron, and there are air and magnet components around the pipe. When loss protons hit the pipe shell, very large secondary particles such as neutrons, gamma rays and electrons are immediately generated, which will greatly contribute to non-primary radiation around the target in the treatment area.
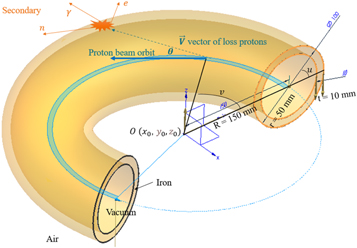
Figure 5. Torus beam pipe. The pipe shell is iron, and there are air and magnet components around the pipe.
Download figure:
Standard image High-resolution imageThe torus surface is expressed in parametric equation (1) (Shiohama and Takagi 1970, Georgiev 2019, Colley 2002)

where  is the angle about the z axis for the large circle and
  is the angle for the small circle. The center of the large circle is at
  This model assumes that the loss protons form a cone beam (blue) and that angle
  determines the interaction area on the pipe shell, which is marked with red lines in figure 6. There are large red interaction regions when angle
  and the whole pipe shell will be directly activated by protons. There are small red interaction regions when angle
  and the activated area will be limited to the outer side of the pipe shell. Thus, the dose distribution will be concentrated on the horizontal plane for the real case of C in figure 6, as the synchrotron can always bound the proton beam in the center orbit.
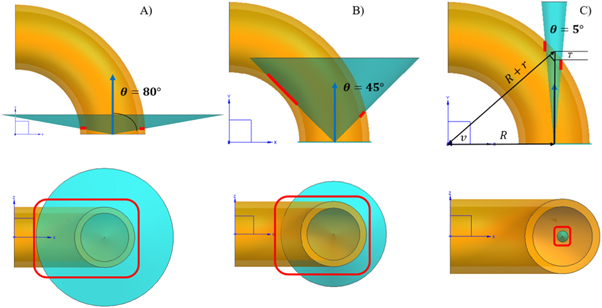
Figure 6. Proton cone beam and interaction positions.
Download figure:
Standard image High-resolution imageFor case C, the thickness of the proton beam that goes through the pipe shell is 

For the P-Cure PT system, 
 and
and  Then, the thickness can be calculated:
  High-energy protons can easily pass through this thickness and irradiate magnet components. Thus, C-shaped iron blocks for magnets could work as a self-shielding material and should be constructed in the MC model, as shown in figure 2.
The parametric equation (1) define the position domain of any loss proton on the torus surface; correspondingly, another group of parametric equations needs to be derived to describe the travel direction of the protons. The major task here is to decompose vector  into the x, y and z axes.
Let an off-orbit proton go from point M on the center orbit to point P on the inner pipe surface along vector  as shown in figure 7(a)). P is on a new auxiliary plane
  The first step is to decompose
  into
into  in the
  plane and
  in the
  plane as expressed in equation (3):

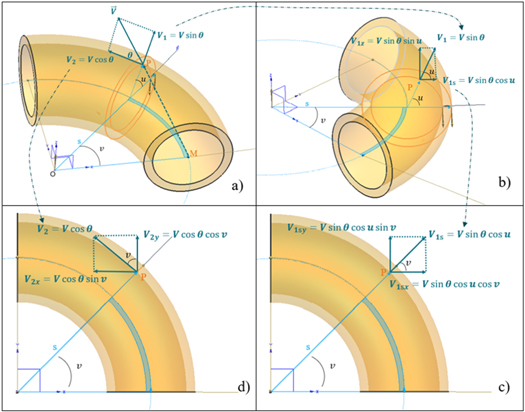
Figure 7. Decomposition of vector  into a Cartesian coordinate system. (a) decompose of vector
  into
into  in the
  plane and
  in the
  plane. (B) decompose vector
  into components along auxiliary axis
  and axis
  (c) decompose vector
  into the components along axis
  of
of  and axis
  of
of  (d) decompose vector
  into the components along axis
  of
of  and axis
  of
of 
Download figure:
Standard image High-resolution imageThen,  is decomposed into components along auxiliary axis
  and axis
  as shown in figure 7(b)) and expressed in equation (4)

 is a final component of
  along axis
  However,
  should be further decomposed into the components along axis
  of
of  and axis
  of
of  as shown in figure 7(c)) and expressed in equation (5).

 in the
  plane is easily decomposed into the components along axis
  of
of  and axis
  of
of  as shown in figure 7(d)) and expressed in equation (6). The
  axis component is 0 for

The final step is to combine the components in the Cartesian coordinate system from equations (5) and (6), that is, equation (7):

Thus, equation (1) describe the position domain of any loss proton and equation (7) describe the direction of the off-orbit proton bombardment on the inner shell of the torus pipe in the Cartesian coordinate system. We call the mathematical equations (1) and (7) the torus source model.
2.3. Sampling distribution of the torus source model
Equations (1) and (7) work as a sampling function to generate a torus proton distribution for MC simulations. In order to intuitively investigate the influence of different parameters on the distribution of lost protons, the trajectories are shown in figure 8 for different angles: (A)  (B)
(B)  and (C)
  In the center it is not a synchrotron ring, but a mathematic torus. Here,
 and
and  in equation (1). On the torus surface trajectory is dense. The horizontal distribution has a radial shape, and the vertical distribution is similar to the wings of a butterfly. For the case of angle
  the wings are compressed into a flat shape. The torus source model is easy to adjust beam loss in vertical direction by changing angle
  this is another advantage compared to the old one.
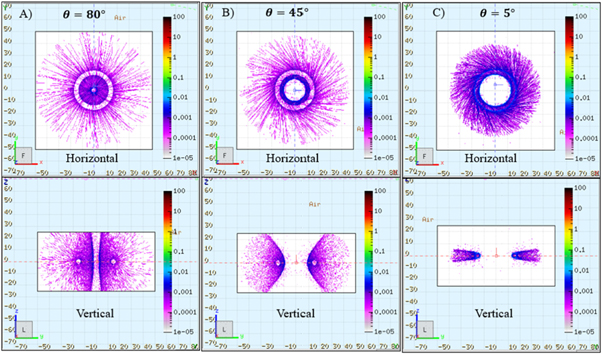
Figure 8. Sampling of the proton distribution based on the torus source model. The horizontal distribution has a radial shape, and the vertical distribution is similar to the wings of a butterfly.
Download figure:
Standard image High-resolution imageFor a real synchrotron case, as the off-orbit travel direction of the protons is tangent to the orbit circle, angle  is adopted in the following calculation for non-primary radiation (Xu et al
2016). This small angle can also guarantee a conservative estimation for non-primary radiation distribution for target as most dose will be concentrated at the isocentric level as shown in the vertical of figure 8. If this worst case non-primary dose can comply IEC standard, then a larger angle should be safe.
is adopted in the following calculation for non-primary radiation (Xu et al
2016). This small angle can also guarantee a conservative estimation for non-primary radiation distribution for target as most dose will be concentrated at the isocentric level as shown in the vertical of figure 8. If this worst case non-primary dose can comply IEC standard, then a larger angle should be safe.
2.4. FLUKA and cloud computing
FLUKA, Geant4 and MCNPX are general MC toolkits (Böhlen et al 2010, Vanaudenhove et al 2014). The GEANT4 code was originally developed for applications in high energy physics. Some experimental validations of the hadronic physics integrated in the code have been reported (Dedes et al 2014, Pinto et al 2016). Conversely, the FLUKA code has been developed and successfully applied both in the high and the low energy ranges. Extensive validations of experimental data have been published (Ferrari et al 2002, Agosteo et al 2007, Böhlen et al 2014, Kozłowska et al 2019). In the framework of dose calculations in hadrontherapy, the codes were also compared with experimental data. For protons, Parodi et al (2007b) (Parodi et al 2007, Koch et al 2008) showed a good agreement between simulated and experimental depth dose profiles.
FLUKA is adopted to calculate the non-primary radiation dose distribution (Ferrari et al 2005, Böhlen et al 2014, Wang et al 2018, Kozłowska et al 2019, Ahdida et al 2022). SimpleGEO and Flair, which are advanced interfaces for FLUKA, are designed to create a complex MC model, as shown in figures 2 and 4 (Theis et al 2006, Vlachoudis 2009). Non-primary radiation is contributed mostly by secondaries during the beam transport process such as neutron, gamma/xray photon and electron. Thus, PRECISIOn is set as FLUKA suitable physics models for our specified problem which include (Fasso' 2003, Ballarini et al 2004):
- (1)EMF on is used to request a detailed transport of electrons, positrons and photons. Even if the primary particles are not photons or electrons, photons are created in high-energy hadron cascades.
- (2)Low energy neutron transport on down to thermal energies included. Fully analogue absorption for low-energy neutrons.
- (3)Particle transport threshold set at 100 keV, except neutrons.
- (4)Multiple scattering threshold at minimum allowed energy, for both primary and secondary charged particles.
The torus source model and uniform straight model work as sampling functions for the synchrotron and BTL, respectively. Different from the standard circle in section 2.3, there are four identical quadrants in the synchrotron ring. Thus, the torus source model should be modified into four parts with the same weight:


USRBIN is adopted to record the absorbed dose for each simulation. USRBIN is a FLUKA command that scores the spatial distribution of absorbed dose. As recommended by FLUKA lectures, a relative dose error of 10% is a generally reliable quality for a simulation. To guarantee a non-primary dose statistical error of less than 10% around the target, the primary run number is set as  per simulation in this study.
Proton beam sampling process is shown in figure 9, which composed by source model, sampling random number PE (probability of proton energy) and energy. Gray source is target generated by SOBP as shown in figure 3. Yellow sources such as nozzle, extraction and injection are generated simply by concentration beam loss model. Green sources BTL and synchrotron ring are generated by uniform straight pipe beam loss model and torus source beam loss model correspondingly. Sampling random number PE is the summary of the previous energy loss weight. For example, p3 = 0.317 for target, p4 = p3 + 0.5% for 250 MeV on nozzle, p16 = p15 + 10.9% = 1 for injection. All these information should be coded into FLUKA SUBROUTINE source file, and before simulations the source file should be compiled properly.
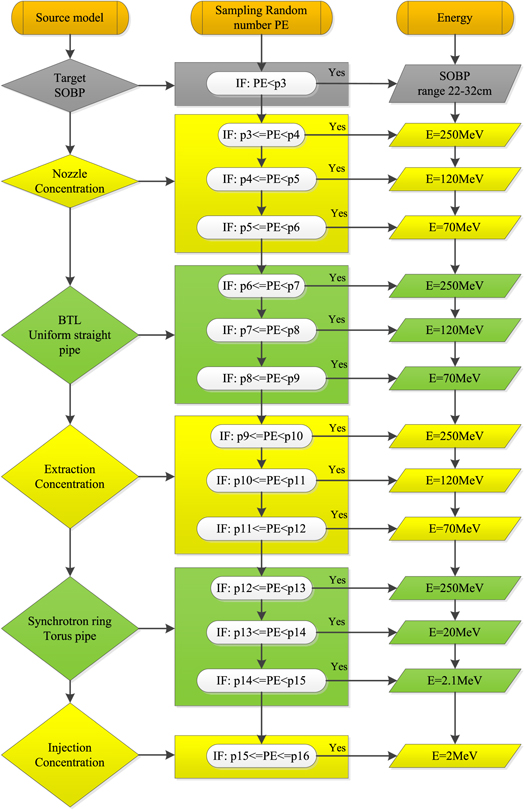
Figure 9. Proton beam sampling process composed by source model, sampling random number PE (probability of proton energy) and energy.
Download figure:
Standard image High-resolution imageThe typical time consumption for a  primary run number is nearly 2 h on a standalone computer (Intel Core (TM) i7-8550U CPU @ 1.8 GHz and 16 GB memory). Approximately hundreds of hours will be required for one simulation, which is approximately one week. Thus, a parallel method should be employed to reduce the time consumption. The Amazon Web Service (AWS) High-Performance Computing (HPC) cluster is adopted for simulations (Wang et al
2022, 2023).
primary run number is nearly 2 h on a standalone computer (Intel Core (TM) i7-8550U CPU @ 1.8 GHz and 16 GB memory). Approximately hundreds of hours will be required for one simulation, which is approximately one week. Thus, a parallel method should be employed to reduce the time consumption. The Amazon Web Service (AWS) High-Performance Computing (HPC) cluster is adopted for simulations (Wang et al
2022, 2023).
3. Results
There are two large categories for non-primary radiation: one is the target at the isocenter in place of the patient, and the other is the PT system, including the sources of the nozzle, the BTL, extraction, the synchrotron, injection, and concrete reflection. The non-primary radiation doses from the target and PT system are separately calculated in this section.
3.1. Non-primary radiation from the target
The non-primary dose distribution from the target is shown in figure 10. The left figure shows the  plane, and the right figure shows the
  plane. The planned dose is 2 Gy at the isocenter (
 ) in a water tank beside the nozzle. The target is a
  region. The water tank also records the non-primary dose around the target. Two evaluation lines are set to investigate the 1D non-primary dose distributions in the
  and
and  directions for the target. The dose rapidly decreases as the distance from the isocenter increases.
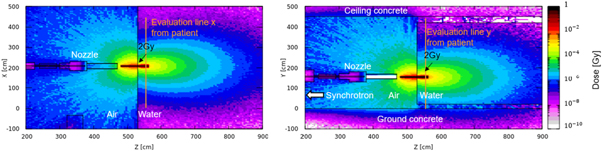
Figure 10. 2D non-primary dose from the target in the  plane (left) and
  plane (right).
Download figure:
Standard image High-resolution imageFigure 11 shows the 1D doses extracted from the 2D dose distributions of figure 10 along evaluation lines x and y. The flat top dose is the planned dose of 2 Gy. The dose exponentially decays outside of the 1 liter target region. The dose distribution is symmetric with respect to the isocenter.
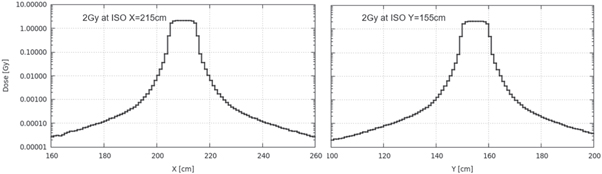
Figure 11. Target 1D dose distribution extracted along evaluation line x (left) and line y (right).
Download figure:
Standard image High-resolution imageTable 2 shows the non-primary dose extracted from figure 11 in different IEC regions defined by figure 1. The doses in all these regions of interest are smaller than the threshold ratio of 0.5% or 0.1%.
Table 2. Target non-primary doses in IEC regions.
| IEC region | Absorbed dose X | IEC region | Absorbed dose Y |
|---|---|---|---|
| [cm] | [Gy] | [cm] | [Gy] |
| 0 | 2 | 0 | 2 |
| 15 | 2.66E-04 | 15 | 6.34E-04 |
| 50 | 1.65E-05 | 50 | 2.21E-05 |
| 200 | 6.20E-08 | 200 | 1.10E-07 |
3.2. Non-primary radiation from the PT system
Figure 12 shows the non-primary dose from the PT system in the XOZ plane (left) and YOZ plane (right). The Cartesian origin point is at the center of the synchrotron. From the left figure, there are 3 hot dose points for every quadrant as high-energy protons pass through the pipe shell between magnets. The magnets are made of pieces of iron, and they function as self-shielding to reduce the contribution to the non-primary dose in the target region. Hot lines emerge from the large free gaps between the quadrants. In particular, the hot line from between Q1 and Q2 threatens the patient area. Although the weights of the nozzle and BTL are much lower than that of the synchrotron, these sources are close to the patient area, and their contribution to the non-primary dose could be even higher (Wang et al 2020).

Figure 12. 2D non-primary dose from the PT system in the XOZ plane (left) and YOZ plane (right).
Download figure:
Standard image High-resolution imageFrom the right figure, extraction is a hot source due to its high weight, and the secondary particles irradiate the ground concrete. Then, the reflected and scattered particles could also contribute to the non-primary dose in the target area.
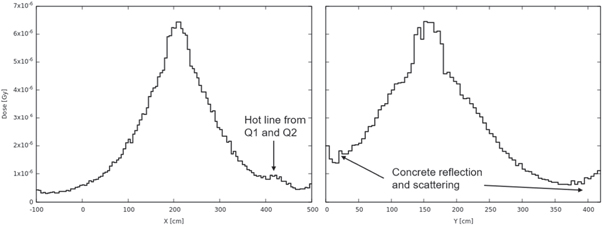
Figure 13 shows the 1D dose distributions extracted along evaluation line X (left) and line Y (right) for the PT system. The highest dose is ∼6.5E-6 Gy. This is a low level, and there is no symmetry regardless of the X or Y direction, as the sources are asymmetrically distributed. The hot line from between Q1 and Q2 contributes a bulge after X = 400 cm. Concrete reflection and scattering contribute little growth in the X < 50 cm and X > 400 cm regions.
Figure 13. PT system 1D dose distributions extracted along evaluation line X (left) and line Y (right).
Download figure:
Standard image High-resolution image
Table 3 shows the non-primary doses extracted from figure 13 in different IEC regions defined by figure 1. The doses in all these regions of interest are maintained at a very low level of around 1E-6 Gy and are smaller than the threshold ratio of 0.5% or 0.1%.
Table 3. PT system non-primary doses in IEC regions.
| IEC region | Absorbed dose X | IEC Region | Absorbed dose Y |
|---|---|---|---|
| [cm] | [Gy] | [cm] | [Gy] |
| 0 | 2 | 0 | 2 |
| 15 | 5.44E-06 | 15 | 6.10E-06 |
| 50 | 3.93E-06 | 50 | 3.83E-06 |
| 200 | 9.40E-07 | 200 | 6.21E-07 |
3.3. Summarized non-primary dose
For direct comparison with the IEC requirements, non-primary doses from the subsources for tables 2 and 3 are summarized in tables 4 and 5. Table 4 shows the summarized non-primary doses for the region of 15–50 cm. The ratios of summarized non-primary doses to the planned dose of 2 Gy are all smaller than the IEC requirement. Moreover, the ratios are one to two orders of magnitude lower than 0.5%.
Table 4. Summarized non-primary doses for the region of 15–50 cm.
| IEC region | 15 cm | 50 cm | ||||||
|---|---|---|---|---|---|---|---|---|
| Source | Evaluation line X | Evaluation line Y | Evaluation line X | Evaluation line Y | ||||
| Absorbed dose [Gy] | Weight | Absorbed dose [Gy] | Weight | Absorbed dose [Gy] | Weight | Absorbed dose [Gy] | Weight | |
| Target | 2.66E-04 | 98.00% | 6.34E-04 | 99.05% | 1.65E-05 | 80.76% | 2.21E-05 | 85.23% |
| PT system | 5.44E-06 | 2.00% | 6.10E-06 | 0.95% | 3.93E-06 | 19.24% | 3.83E-06 | 14.77% |
| Sum of all | 2.71E-04 | 6.40E-04 | 2.04E-05 | 2.59E-05 | ||||
| Ratio to 2 Gy | 0.01357% | 0.03201% | 0.00102% | 0.00130% | ||||
| IEC requirement | 0.50% | 0.50% | 0.50% | 0.50% | ||||
Table 5. Summarized non-primary doses for the region of 50–200 cm.
| IEC region | 50 cm | 200 cm | ||||||
|---|---|---|---|---|---|---|---|---|
| Source | Evaluation line X | Evaluation line Y | Evaluation line X | Evaluation line Y | ||||
| Absorbed dose [Gy] | Weight | Absorbed dose [Gy] | Weight | Absorbed dose [Gy] | Weight | Absorbed dose [Gy] | Weight | |
| Target | 1.65E-05 | 80.76% | 2.21E-05 | 85.23% | 6.20E-08 | 6.19% | 1.10E-07 | 15.05% |
| PT system | 3.93E-06 | 19.24% | 3.83E-06 | 14.77% | 9.40E-07 | 93.81% | 6.21E-07 | 84.95% |
| Sum of all | 2.04E-05 | 2.59E-05 | 1.00E-06 | 7.31E-07 | ||||
| Ratio to 2 Gy | 0.00102% | 0.00130% | 0.00005% | 0.00004% | ||||
| IEC requirement | 0.10% | 0.10% | 0.10% | 0.10% | ||||
Table 5 shows the summarized non-primary doses for the region of 50–200 cm. The ratios of summarized non-primary doses to the planned dose of 2 Gy are all smaller than the IEC requirement. Moreover, the ratios are three to four orders of magnitude lower than 0.1%. Thus, the P-Cure PT system is quite safe for patients according to IEC requirements. It is a clean system, and there is no need for inner shielding concrete between the accelerator and target.
The weight of the non-primary dose from the target is more than 80% in the 15–50 cm region, whereas the PT system dominates up to 80% when the distance increases to 200 cm. This occurs because the sources of the PT system are distributed over a large scale, and the secondary particles travel all around in the shielding bunker.
Although it is a clean PT system, it can be further optimized by small efforts such as (1) adding local shielding between Q1 and Q2 to reduce the hot line and (2) painting a thin layer of neutron absorbing material on the concrete. This would be patient-friendly and helpful for reducing secondary malignancies.
4. Conclusions
Non-primary radiation is carefully evaluated for the P-Cure synchrotron-based PT system in this article. Seven possible sources are modeled in MC code, and a new mathematical model called the torus source beam model is developed for the synchrotron. Parametric equation (1) define the position domain of loss proton and equation (7) define the direction of the off-orbit particle bombardment on the torus pipe shell in the Cartesian coordinate system. By changing radii 
 and thickness
  to modify the torus pipe size, changing
  to modify the quadrant range, and changing angle
  to modify the direction of particles.
This new mathematical model shows some advantages for dose evaluation: (1) the beam loss is independent to magnet field thus there is no biased direction and no long live proton in the synchrotron ring, (2) protons can be evenly lost on the inner shell of the pile. It could be widely used for bending magnets in gantries and synchrotrons to evaluate non-primary doses or other radiation doses.
The ratios of summarized non-primary doses to the planned dose of 2 Gy are all much smaller than the IEC requirements in both the 15–50 cm and 50–200 cm regions. Thus, the P-Cure synchrotron-based PT system is patient-friendly, and there is no need for inner shielding concrete between the accelerator and target. However, the system can be further optimized by small efforts to decrease the non-primary radiation threat, such as adding local shielding between Q1 and Q2.
Non-primary radiation evaluation is a standard procedure for traditional radiotherapy. This manuscript provides a referable MC procedure for synchrotron-based proton therapy with new beam loss model. Which could help people figure out precisely where non-primary radiation comes from, what the dose level is, and whether this level complies with the IEC standard before the system put into clinical treatment. At least three groups of people who could be benefit from this research.
- (1)For patients, they can understand from this research how much extra dose from the beam generating system. in this P-Cure case it is much smaller than 0.5% in standard. Patients will feel very comfortable and safe.
- (2)For manufacturers or construction team, they do not need an inner shielding wall, this will reduce the cost and space. The proton therapy facility could be more compact. Fatherly, patient treatment cost can be reduced.
- (3)For supervisor from government, these results consolidate their confidence on the safety and quality of the equipment.
Acknowledgments
This work was supported by the National Natural Science Foundation of China (U1932209, 11975315, U1867210, 11905134).
We gratefully acknowledge Andrii Rusanov for the user routine application in FLUKA simulations and knowledge about particle physics. The authors kindly acknowledge the great support from AWS engineers Yin-Xiang Li, Jian-Bin Zhou and Xiao-Chen Ye.
Data availability statement
The data cannot be made publicly available upon publication because they contain commercially sensitive information. The data that support the findings of this study are available upon reasonable request from the authors.