
Abstract
Objective. To facilitate manual diagnosis of lung cancer-caused metastasis, in this work, we propose a deep learning-based method to automatically identify and locate the hotspots in a bone scan image which denote the lesions metastasized from lung cancer. Approach. An end-to-end metastasis lesion detection model is proposed by following the classical object detection framework single shot multibox object detector (SSD). The proposed model casts lesion detection problem into automatically learning the hierarchal representations of lesion features, locating the spatial position of lesion areas, and boxing the detected lesions. Main results. Experimental evaluation conducted on clinical data of retrospective bone scans shows the comparable performance with a mean score of 0.7911 for average precision. A comparative analysis between our network and others including SSD shows the feasibility of the proposed detection network on automatically detecting multiple lesions of metastasis lesions caused by lung cancer. Significance. The proposed method has the potential to be used as an auxiliary tool for improving the accuracy and efficiency of metastasis diagnosis routinely conducted by nuclear medicine physicians.
Export citation and abstract BibTeX RIS

Original content from this work may be used under the terms of the Creative Commons Attribution 4.0 licence. Any further distribution of this work must maintain attribution to the author(s) and the title of the work, journal citation and DOI.
1. Introduction
Object detection has been a hot topic in medical image analysis especially in the automated localization and identifying of regions of interest (e.g. organs, tissues, and lesions) in images (Litjens et al 2017). Physicians need pay attention only to the detected regions of interest while ignoring large-size background area of an image during manual diagnosis of diseases, having the huge potential to improve the accuracy and efficiency of diagnosis.
Bone scan (bone scintigraphy) is of the widely-accepted clinical tools for screening bone metastasis originated from a variety of various solid tumors including lung cancer. With 99mTc MDP (99m Technetium methylene diphosphonate), SPECT (single photon emission computed tomography) imaging displays a bone metastasis lesion as an area with high uptake of radiopharmaceutical (Bombardieri et al 2003). It has been proved that 99mTc-MDP SPECT is more affordable and available than PET (positron emission tomography) due to its low-cost equipment and radiopharmaceutical (Lin et al 2020a).
The 99mTc-MDP SPECT imaging is characterized by low specificity and inferior resolution (Nathan et al 2013), significantly impeding human manual analysis of bone scan images for bone metastasis diagnosis. First, it is a challenging task to accurately distinguish a real metastasis lesion from benign processes. This is because, for example, osteoarthritis and bone injury often manifest as high-uptake areas in a SPECT bone scan image, which would bring misinterpretation to human diagnosis. Second, there has no clear boundary between a metastasis lesion and the normal bone as compared to anatomical imaging modalities like computed tomography (CT) and magnetic resonance imaging (MRI). Segmenting a low-resolution 99mTc-MDP SPECT image to accurately measure metastasis lesions is impracticable in routine nuclear medicine practice.
Using object detection algorithms to automatically identify and locate lesions plays a vital role in the field of automated medical image analysis. Not only the disease type that a lesion belongs to but also the location that such a lesion is present in can be determined in an automated way. There has seen an increasing interest in automated detection of lesions within anatomical medical images since the prevalence of convolutional neural network (CNN), which has the ability of automatically learning hierarchal representations of images and dividing high-level features in an end-to-end fashion. With x-ray images, a four-layer CNN model has been developed to detect lung nodules (Lo and Lou 1995). A set of deep CNNs were investigated to detect lymph nodes, sclerotic metastases, and colon polyps in CT scans (Roth et al 2014, 2016, Yao et al 2015). Teramoto et al (Teramoto et al 2016 ). studied to propose a multi-stream CNN model for detecting lung modules with hybrid PET/CT images. A 3D CNN model was proposed to detect brain microhemorrhages with MRI images (Dou et al 2015). Weak supervised deep learning was also studied to develop CNN-based detection of lung nodules in x-ray mammograms (Hwang and Kim 2016). CheXNeXt (Rajpurkar et al 2018) is a CNN-based model used for simultaneously detecting 14 different types of lesions including pneumonia, pleural effusion, pulmonary masses, and pulmonary nodules.
In the domain of 99mTc-MDP SPECT image analysis, existing research efforts lie in developing CNN-based image classification methods, targeting at answering that whether a metastasis lesion is present (i.e. two-class classification (Dang 2016, Papandrianos et al 2020a, 2020b, 2020c, 2020d, Pi et al 2020, Zhao et al 2020, Cheng et al 2021a, 2021b, Lin et al 2021a)) or how many lesions of different diseases are present in a bone scan image (i.e. multi-class classification (Lin et al 2021b, 2021c, Guo et al 2022, Li et al 2022)). A CNN-based supervised segmentation model was proposed to automatically delineate metastasis lesions in regional SPECT bone scan images (Lin et al 2020b), achieving a mean score of 0.6103 for intersection over union (IoU). The objective of this work is to propose a self-defined lesion detection model by following the single shot multibox object detector (SSD) framework, having different objective from image classification (Dang 2016, Pi et al 2020, Papandrianos et al 2020a, 2020b, 2020c, 2020d, Zhao et al 2020, Cheng et al 2021a, 2021b, Lin et al 2021a, 2021b, 2021c, Guo et al 2022, Li et al 2022) and segmentation (Lin et al 2020b) tasks.
CNN-based automated detection of metastasis lesions is still untilled in the 99mTc-MDP SPECT image analysis field. To facilitate manual diagnosis of lung cancer-caused metastasis, in this work, we propose a CNN-based lesion detection method by following the classical object detection framework SSD (Liu et al 2016). The proposed method can identify and locate a bone metastasis lesion in a SPECT bone scan image, enabling to improve diagnosis accuracy and efficiency.
The main contributions of this work can be summarized as: First, to the best of our knowledge, we are the first to try to automatically detect bone metastasis lesions with 99mTc-MDP SPECT bone scans. Second, by following the classical SSD framework, a CNN-based end-to-end model is developed to transform the lesion detection problem into learning the hierarchal representations of lesion features, locating the spatial position of lesion areas, and boxing the detected lesions. Lastly, a set of clinical data of retrospective SPECT bone scans are used to evaluate the proposed method, showing the comparable detection performance with a mean score of 0.7911 for the composite metric average precision (AP).
The rest of this paper is organized as follows. We present in section 2 the data used and the proposed lesion detection method. We report in section 3 the experimental evaluation conducted on clinical 99mTc-MDP SPECT scan bone images. We provide in section 4 a brief discussion about the pros and cons of the proposed method. In section 5, we conclude this work and point out the future research directions.
2. Materials and methods
The SPECT bone scans used and the proposed lesion detection method are detailed in this section.
2.1. Bone scan image and preprocessing
In this retrospective study, the 99mTc-MDP SPECT bone scan images used were collected from the Department of Nuclear Medicine, Gansu Provincial Tumor Hospital. During the SPECT imaging, a single-head gamma camera (GE SPECT Millennium MPR) was used to acquire the anterior- and posterior-view whole-body images from patients who were clinically diagnosed with lung cancer, where 99mTc MDP (20–25 mCi) was intravenously injected into the body of a patient.
A total of 527 patients with lung cancer were involved in the dataset, resulting in 1054 whole-body SPECT bone scan images. To focus only on the thoracic region that was widely identified as one of the most common areas of bone metastasis (Nathan et al 2013), we extracted the regional thorax sub-image from every whole-body image to construct a dataset consisting of 306 regional sub-images. Those images containing bone metastasis in other areas were excluded. In other word, this work aims to develop a bone metastasis lesion detection model conducting on regional SPECT bone scan images. An extracted regional sub-image has the size of 256 × 256, by filling in edge with background if necessary.
Three experienced nuclear medicine physicians from our group manually delineated the boundary of each lesion using a LabelMe (http://labelme.csail.mit.edu/Release3.0/) based annotation system. The labeled lesions act as ground truth in the experiments, which will be fed into the detection model for training purpose.
2.2. The proposed method
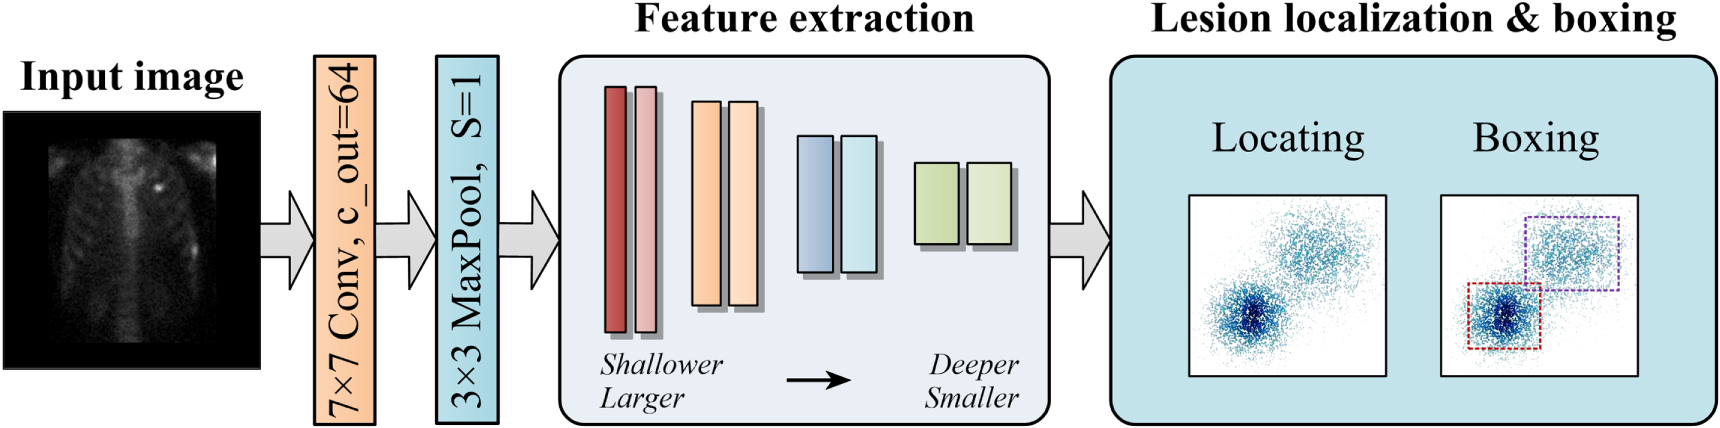
Figure 1 outlines the proposed SSD-based lesion detection method. An inputted 256 × 256 image is first convoluted using a 7 × 7 filter (7 × 7 Conv, c_out = 64) to produce feature maps, which is followed by a down-sampling using a 3 × 3 pooling layer (3 × 3 MaxPool, S = 1), where c_out and S is the channel number and stride length, respectively. The feature extraction sub-network works to extract shallow-to-deep image features, aiming to yield smaller feature maps. Lesion localization & boxing stage is used to locate lesion areas in images (feature maps) and box each area with a rectangle.

Figure 1. An overview of the proposed bone metastasis lesion detection method. (Conv = Convolution, MaxPool = Max pooling).
Download figure:
Standard image High-resolution image2.2.1. Feature extraction
To facilitate the detection of varied-size metastasis lesions in low-resolution SPECT images, in this work, we propose a feature extraction sub-network consisting of cascaded convolution blocks with residual connections (see figure 2).

Figure 2. The structure of the feature extraction sub-network consisting of blocks.
Download figure:
Standard image High-resolution imageFour groups of convolution blocks are included in the defined feature extraction sub-network, with each block consisting of a 3 × 3 convolution layer (3 × 3 Conv, c_out) and a 1 × 1 convolution layer (1 × 1 Conv, c_out), where c_out is the channel number. The number of blocks in these groups is indicated by {3, 3, 5, 3}. The size of feature maps evolves from larger to smaller while the extracted image features changing from shallower to deeper.
As depicted in figure 3, there is a residual connection (i.e. Intra-res) between two adjacent convolutional layers within a block and a residual connection (i.e. Inter-res) between two convolutional layers of different blocks.

Figure 3. The structure of the residual connections. (a) Intra-res connection; and (b) Inter-res connection.
Download figure:
Standard image High-resolution imageThe extracted higher-level features will be fed into the lesion localization & boxing stage to identify lesion areas and label these areas with boxes.
2.2.2. Lesion localization and boxing
Figure 4(a) details the structure of feature extraction sub-network, which outputs a group of varied-size feature maps of {32 × 32, 16 × 16, 13 × 13, 11 × 11, 9 × 9, 7 × 7, 5 × 5, 3 × 3, 1 × 1}. With these feature maps, a two-stage operation consisting of candidate box (CB) generation and valid candidate box (VCB) selection is conducted to locate and box each lesion area in an image (see figure 4(b)).

Figure 4. The overview flowchart of locating and boxing lesion areas.
Download figure:
Standard image High-resolution image2.2.2.1. CB generation
In the CB generation stage, we need to first establish a mapping between the feature maps and the manual labels in the original image to facilitate locating the lesions areas. An input image is divided into grids according to the size of feature maps by regarding the geometric center of each grid as a midpoint, where candidate boxes with six types of sizes are used.
Let SCk denote the width of a square CB and Input_width be the width of an original image, Sk = SCk /Input_width can be calculated according to equation (1).

where m denotes the number of the feature maps; and Smax and Smin is the maximum and minimum of Sk , respectively.
A value of 0.9/0.2 for Smax/Smin works well in the experiments. The varied-size candidate boxes can thus be obtained by adjusting the value of Sk . Particularly, the square CB pertaining to the first feature map (i.e. 32 × 32) has S0 = Smin/2, meaning that the width of the square CB of the first feature map is SC0 = S0 × Input_width = Smin/2 × Input_width = 0.1 × 256 ≈ 25. For any rectangle CB, the height h and the width w can be calculated according to equation (2).

where ar = width: height.
The visual observation of bone metastasis lesions in SPECT bone scan images suggests several empirical values of {1', 1, 2, 3, 1/2, 1/3} for ar, where 1' denotes SCk
= (SCk
 SCk+1)1/2 (Liu et al
2016). Since feature maps in the shallower network layers are often used to detect smaller objects while feature maps in the deeper layers corresponding to larger objects, we arrange ar ∈ {1', 1, 2, 1/2} for the feature maps of {32 × 32, 3 × 3, 1 × 1}. The parameter settings are outlined in table 1.
SCk+1)1/2 (Liu et al
2016). Since feature maps in the shallower network layers are often used to detect smaller objects while feature maps in the deeper layers corresponding to larger objects, we arrange ar ∈ {1', 1, 2, 1/2} for the feature maps of {32 × 32, 3 × 3, 1 × 1}. The parameter settings are outlined in table 1.
Table 1. Parameter settings in CB generation.
| Feature map | SCk | ar | CB in single feature map | Total number of CB |
|---|---|---|---|---|
| 32 × 32 | 25 | {1', 1, 2, 1/2} | 4 | 32 × 32 × 4 |
| 16 × 16 | 51 | {1', 1, 2, 3, 1/2, 1/3} | 6 | 16 × 16 × 6 |
| 13 × 13 | 73 | {1', 1, 2, 3, 1/2, 1/3} | 6 | 13 × 13 × 6 |
| 11 × 11 | 96 | {1', 1, 2, 3, 1/2, 1/3} | 6 | 11 × 11 × 6 |
| 9 × 9 | 118 | {1', 1, 2, 3, 1/2, 1/3} | 6 | 9 × 9 × 6 |
| 7 × 7 | 140 | {1', 1, 2, 3, 1/2, 1/3} | 6 | 7 × 7 × 6 |
| 5 × 5 | 163 | {1', 1, 2, 3, 1/2, 1/3} | 6 | 5 × 5 × 6 |
| 3 × 3 | 185 | {1', 1, 2, 1/2} | 4 | 3 × 3 × 4 |
| 1 × 1 | 208 | {1', 1, 2, 1/2} | 4 | 1 × 1 × 4 |
2.2.2.2. VCB selection
As shown in table 1, a total of 8342 candidate boxes are generated in the CB generation stage, which can be further divided into positive and negative samples. Specifically, a CB is called positive sample if it partially or fully covers a real lesion; it is a negative sample otherwise. VCB selection conducts to reduce the number of the positive and negative samples to speed up the model training, which is implemented by matching positive samples and mining hard negative samples.
- Matching positive sample: a positive CB will be selected as a VCB if it has IoU > θ (strong positive sample), where IoU measures the overlap between this CB and its ground truth (i.e. manual label). The one with largest IoU will be also selected as a VCB if there is no strong positive sample for a feature map.
- Mining hard negative sample: differing from the natural images, the proportion of the lesion areas (foreground) is far less than the background for bone scan images. This means the most of the generated 8342 candidate boxes are negative samples. To keep balance between the positive and negative samples, we need to select valid negative samples by mining the hard negative samples. Specifically, a negative sample is a hard negative sample if it has largest negative loss, LNeg , which is defined in equation (3).

where N is the number of negative samples, and  is the probability of the background class.
With the selected VCBs, the proposed lesion detection model can be trained. During the model test stage, we use the non-maximize suppression algorithm (Rosenfeld and Thurston 1971) to reduce the overlaps of predictions in the form of boxes. Suppose n boxes {pb1, pb2, ..., pbn } with each having a class score si (1 ≤ i ≤ n), the non-maximize suppression algorithm works as follows:
- (1)Let A = {pb1, pb2, ..., pbn } and B = Ø
- (2)Moving pbi from A to B if it has the current largest score si .
- (3)∀ pbj ∈ A (j ≠ i), if IoU (pbi , pbj ) ≥ θ, removing pbj from A, where θ is a predefined threshold.
- (4)Goto


The algorithm above stops if no element in the set A meets the selection requirement. The boxes in the set B are the resultant outputs of the proposed detection model.
2.3. Experimental setup
The experimental evaluation metric used in this work is AP, which is defined as the area under the P–R curve, where P = Precision and R = Recall are as follows.


where the annotations are defined as follow.
TP = True Positive: The number of the predicted boxes with IoU > = θ, where IoU measures the overlap between a predicted positive box and its ground truth; FP = False Positive: The number of the predicted positive boxes with IoU < θ; FN = False Negative: The number of the predicted boxes covering no ground truth (manual labels).
The dataset consisting of 306 thoracic SPECT images are divided into two parts: the training set (n = 212, ∼70%) and the test set (n = 94, ∼30%). The experimental results reported below are ten-fold cross-validation scores of evaluation metrics.
The parameter settings of the CNN-based lesion detection model are outlined in table 2.
Table 2. Parameter settings of the proposed lesion detection model.
| Parameter | Value |
|---|---|
| θ | 0.5 |
| Learning ratio | 1 × 10⁻⁴ |
| Optimizer | Adam |
| Epoch | 300 |
3. Results
This section reports the experimental evaluation conducted on a set of clinical 99mTC-MDP SPECT bone scan images. The experiments are run in Tensorflow 2.0 on an Intel Core i7-9700 PC with 32GB RAM running Windows 10 operating system.
3.1. Performance results
Table 3 reports the performance obtained by the proposed lesion detection model on the test samples (∼30% of the images in the dataset used) by providing the scores of AP, Precision, and Recall (sensitivity).
Table 3. Scores of evaluation metrics obtained by the proposed model on the test set.
| Metric | Value |
|---|---|
| AP | 0.7911 |
| Precision | 0.9130 |
| Recall (sensitivity) | 0.1333 |
High score of Precision reveals that the proposed detection model has the ability to successfully identify true positives while suppressing false positives. However, the model obtains low score for Recall, which is contributed by the high false negatives. This is due to the inconsistent appearance of metastasis lesions in SPECT bone scan images among patients with various bony metabolic activities. Some positive pixels were incorrectly detected as the negative, hence the high false negatives. Fortunately, the composite metric AP that measures the area under the Precision–Recall (P–R) curve obtains the relatively high score, which is depicted in figure 5.

Figure 5. The P–R curve of the proposed model on the test set.
Download figure:
Standard image High-resolution imageThe P–R curve depicted in figure 5 shows that a score of no less than 0.7 can be obtained for Recall when Precision is not more than 0.8. This combined with the mean score of 0.7911 for AP proves the feasibility, to some content, of the proposed model on detecting metastasis lesions in low-resolution SPECT bone scan images.
3.2. Ablation study
How the feature extraction and lesion localization & boxing operations impact the model's detection performance measured by AP is studied in this subsection.
3.2.1. Impact of candidate boxes on AP
As mentioned in subsection 2.2.2, the feature extraction sub-network outputs a group of varied-size feature maps, which relate to the size and number of the candidate boxes. Table 4 lists several different types of candidate boxes, where the scheme S3# represents the one used in previous subsection.
Table 4. The types of the candidate boxes.
| Scheme | Type of candidate boxes |
|---|---|
| S1# | {32 × 32; 16 × 16; 11 × 11; 7 × 7; 5 × 5; 3 × 3; 1 × 1} |
| S2# | {32 × 32; 19 × 19; 11 × 11; 7 × 7; 5 × 5; 3 × 3; 1 × 1} |
| S3# | {32 × 32; 16 × 16; 13 × 13; 11 × 11; 9 × 9; 7 × 7; 5 × 5; 3 × 3; 1 × 1} |
| S4# | {32 × 32; 19 × 19; 13 × 13; 11 × 11; 9 × 9; 7 × 7; 5 × 5; 3 × 3; 1 × 1} |
| S5# | {32 × 32; 19 × 19; 16 × 16; 13 × 13; 11 × 11; 9 × 9; 7 × 7; 5 × 5; 3 × 3; 1 × 1} |
On the different types of candidate boxes, figure 6 provides the scores of AP obtained by the proposed detection model. Using the scheme S3#, the proposed detection model performs best since the nine candidate boxes in this scheme can better cover the lesion areas in feature maps than others. It can also be seen that using the 16 × 16 CB is more suitable than the 19 × 19 one as shown by the relatively inferior performance of scheme S4#.

Figure 6. AP scores obtained by the proposed model when different schemes were used.
Download figure:
Standard image High-resolution image3.2.2. Impact of ar values on AP
Another factor relating to the detection performance is ar, which is defined as the ratio of width and height. Several groups of empirical values for ar are provided in table 5, with ar_3 indicating the one used previously.
Table 5. Different groups of values for ar.
| ar | Value |
|---|---|
| ar_1 | {1', 1} |
| ar_2 | {1', 1, 2, 1/2} |
| ar_3 | {1', 1, 2, 3, 1/2, 1/3} |
| ar_4 | {1', 1, 2, 3, 4, 1/2, 1/3, 1/4} |
| ar_5 | {1', 1, 2, 3, 4, 5, 1/2, 1/3, 1/4, 1/5} |
The experimental results presented in figure 7 show that using the six various ratios in ar_3 to scale the candidate boxes in scheme S3# as shown in table 4 can appropriately box the metastasis lesions in input images.

Figure 7. Scores of AP obtained by the proposed detection model when ar has different values.
Download figure:
Standard image High-resolution image3.2.3. Impact of network structure on AP
The structure of the feature extraction sub-network is also examined to investigate whether it has an impact on the detection performance. The classical CNNs including VGG (Simonyan and Zisserman 2014) and Resnet (He et al 2016) (and its variants) are used as feature extraction sub-networks to compare with the proposed one, which are outlined in table 6.
Table 6. Structures of different feature extraction sub-networks.
| Layer | VGG-16 | Resnet-18 | Resnet-27 | Ours | Resnet-31 | Resnet-34 |
|---|---|---|---|---|---|---|
| Configuration | ||||||
| Conv | — | 7 × 7, 64, stride = 1 | ||||
| Pool | — | 3 × 3 max pool, stride = 1 | ||||
| Conv1_x |
![$\left[3\times 3,64\right]\times 2$](https://content.cld.iop.org/journals/0031-9155/67/22/225009/revision2/pmbac944dieqn3.gif)
|
![$\left[\begin{array}{c}3\times 3,64\\ 1\times 1,64\end{array}\right]\times 2$](https://content.cld.iop.org/journals/0031-9155/67/22/225009/revision2/pmbac944dieqn4.gif)
|
![$\left[\begin{array}{c}3\times 3,64\\ 1\times 1,64\end{array}\right]\times 3$](https://content.cld.iop.org/journals/0031-9155/67/22/225009/revision2/pmbac944dieqn5.gif)
|
![$\left[\begin{array}{c}3\times 3,64\\ 1\times 1,64\end{array}\right]\times 3$](https://content.cld.iop.org/journals/0031-9155/67/22/225009/revision2/pmbac944dieqn6.gif)
|
![$\left[\begin{array}{c}3\times 3,64\\ 1\times 1,64\end{array}\right]\times 3$](https://content.cld.iop.org/journals/0031-9155/67/22/225009/revision2/pmbac944dieqn7.gif)
|
![$\left[\begin{array}{c}3\times 3,64\\ 1\times 1,64\end{array}\right]\times 3$](https://content.cld.iop.org/journals/0031-9155/67/22/225009/revision2/pmbac944dieqn8.gif)
|
| Conv2_x |
![$\left[3\times 3,128\right]\times 2$](https://content.cld.iop.org/journals/0031-9155/67/22/225009/revision2/pmbac944dieqn9.gif)
|
![$\left[\begin{array}{c}3\times 3,128\\ 1\times 1,128\end{array}\right]\times 2$](https://content.cld.iop.org/journals/0031-9155/67/22/225009/revision2/pmbac944dieqn10.gif)
|
![$\left[\begin{array}{c}3\times 3,128\\ 1\times 1,128\end{array}\right]\times 3$](https://content.cld.iop.org/journals/0031-9155/67/22/225009/revision2/pmbac944dieqn11.gif)
|
![$\left[\begin{array}{c}3\times 3,128\\ 1\times 1,128\end{array}\right]\times 2$](https://content.cld.iop.org/journals/0031-9155/67/22/225009/revision2/pmbac944dieqn12.gif)
|
![$\left[\begin{array}{c}3\times 3,128\\ 1\times 1,128\end{array}\right]\times 4$](https://content.cld.iop.org/journals/0031-9155/67/22/225009/revision2/pmbac944dieqn13.gif)
|
![$\left[\begin{array}{c}3\times 3,128\\ 1\times 1,128\end{array}\right]\times 4$](https://content.cld.iop.org/journals/0031-9155/67/22/225009/revision2/pmbac944dieqn14.gif)
|
| Conv3_x |
![$\left[3\times 3,256\right]\times 3$](https://content.cld.iop.org/journals/0031-9155/67/22/225009/revision2/pmbac944dieqn15.gif)
|
![$\left[\begin{array}{c}3\times 3,256\\ 1\times 1,256\end{array}\right]\times 2$](https://content.cld.iop.org/journals/0031-9155/67/22/225009/revision2/pmbac944dieqn16.gif)
|
![$\left[\begin{array}{c}3\times 3,256\\ 1\times 1,256\end{array}\right]\times 5$](https://content.cld.iop.org/journals/0031-9155/67/22/225009/revision2/pmbac944dieqn17.gif)
|
![$\left[\begin{array}{c}3\times 3,256\\ 1\times 1,256\end{array}\right]\times 5$](https://content.cld.iop.org/journals/0031-9155/67/22/225009/revision2/pmbac944dieqn18.gif)
|
![$\left[\begin{array}{c}3\times 3,256\\ 1\times 1,256\end{array}\right]\times 5$](https://content.cld.iop.org/journals/0031-9155/67/22/225009/revision2/pmbac944dieqn19.gif)
|
![$\left[\begin{array}{c}3\times 3,256\\ 1\times 1,256\end{array}\right]\times 6$](https://content.cld.iop.org/journals/0031-9155/67/22/225009/revision2/pmbac944dieqn20.gif)
|
| Conv4_x |
![$\left[3\times 3,512\right]\times 6$](https://content.cld.iop.org/journals/0031-9155/67/22/225009/revision2/pmbac944dieqn21.gif)
|
![$\left[\begin{array}{c}3\times 3,512\\ 1\times 1,512\end{array}\right]\times 2$](https://content.cld.iop.org/journals/0031-9155/67/22/225009/revision2/pmbac944dieqn22.gif)
|
![$\left[\begin{array}{c}3\times 3,512\\ 1\times 1,512\end{array}\right]\times 2$](https://content.cld.iop.org/journals/0031-9155/67/22/225009/revision2/pmbac944dieqn23.gif)
|
![$\left[\begin{array}{c}3\times 3,512\\ 1\times 1,512\end{array}\right]\times 3$](https://content.cld.iop.org/journals/0031-9155/67/22/225009/revision2/pmbac944dieqn24.gif)
|
![$\left[\begin{array}{c}3\times 3,512\\ 1\times 1,512\end{array}\right]\times 3$](https://content.cld.iop.org/journals/0031-9155/67/22/225009/revision2/pmbac944dieqn25.gif)
|
![$\left[\begin{array}{c}3\times 3,512\\ 1\times 1,512\end{array}\right]\times 3$](https://content.cld.iop.org/journals/0031-9155/67/22/225009/revision2/pmbac944dieqn26.gif)
|
The experimental results presented in figure 8 reveal that the proposed 29-layer sub-network using residual connections (i.e. the inter- and intra-connections) can extract more representative features of low-resolution SPECT bone scan images than others, hence the best lesion detection performance.

Figure 8. Scores of AP obtained by the proposed detection model when different feature extraction sub-networks are used.
Download figure:
Standard image High-resolution image3.3. Comparative analysis
In our previous work (Lin et al 2020b), CNN-based methods were proposed to segment 99mTc-MDP SPECT bone scan images by introducing residual connection and attention mechanism into the classical models U-Net (Ronneberger et al 2015) and Mask R-CNN (He et al 2020), respectively. By adjusting the structures of the segmentation networks to fit the lesion detection task, we examine their performance on lesion detection task using same test set of SPECT bone scan images.
As shown in table 7, the proposed detection method outperforms all segmentation models with the much higher score for AP. This further demonstrates the superiority of the proposed lesion detection model.
4. Discussion
A brief analysis of the strengths and weaknesses of the proposed bone metastasis lesion detection model is presented in this section.
Despite the inferior spatial resolution of SPECT imaging, our model achieves promising lesion detection performance with the mean score of 0.7911 for AP. The proposed model outperforms the others in which different structures of feature extraction sub-network were used, demonstrating the feasibility of the cascaded residual convolution blocks in learning hierarchal representations of low-resolution images. The model detection performance depends also on the amount and shape of valid candidate boxes, where ar ∈ {1', 1, 2, 3, 1/2, 1/3} corresponds to the best detection performance.
The experimental results in table 3 show that the proposed model achieves high detection precision but low recall. According to equation (5), the false negatives and false positives account for decreasing Recall and Precision metric, respectively. Figure 9 explains this with three typical cases of detecting multiple lesions of bone metastasis.

Figure 9. Illustration of the detected multiple lesions in three images by the proposed model with the prediction and ground truth being labeled with red box and green box, respectively. (a) The case contains false-positive predictions in a posterior-view image; (b) The case contains false-negative prediction in an anterior-view image; and (c) The case contains false-positive predictions in the organs (i.e. kidneys) in a posterior-view image.
Download figure:
Standard image High-resolution image
For the case in figure 9(a), six lesions (i.e. l1, l2, and l5–l8) were correctly detected, which were assigned with a value of 1 for TP and a value of 0 for FP and FN. Two areas l3 and l4 with slightly high uptake were incorrectly detected as lesions, denoting the false-positive predictions that contribute to decreasing the precision. For this case, the value of Precision is calculated as Precision = ∑i = 1...8 [TPi /(TPi + FPi )] = 6/(6 + 2) = 3/4 and the value of Recall is calculated as Recall = ∑i = 1...8 [TPi /(TPi + FNi )] = 6/(6 + 0) = 1.
For the case in figure 9(b), four lesions (i.e. l2–l5) were correctly detected. A lesion l1 was incorrectly identified as the normal, denoting the false-negative prediction that contributes to decreasing the recall. For this case, the value of Precision is calculated as Precision = ∑i = 1...5 [TPi /(TPi + FPi )] = 4/(4 + 0) = 1 and the value of Recall is calculated as Recall = ∑i = 1...5 [TPi /(TPi + FNi )] = 4/(4 + 1) = 4/5.
Similarly, we can calculate the values of Precision and Recall for the case in figure 9(c) as Precision = ∑i = 1...5 [TPi /(TPi + FPi )] = 2/(2 + 2) = 1/2 and Recall = ∑i = 1...5 [TPi /(TPi + FNi )] = 2/(2 + 1) = 2/3, respectively.
We can conclude the reasons of false-negative and false-positive predictions as follows.
- Unique characteristics of SPECT imaging: 99mTc MDP-SPECT is a type of functional medical imaging techniques. Not only the lesion areas but also the normal bones would display hotspots of high uptake of radiopharmaceutical. Furthermore, hotspots can also be seen in the kidneys and bladder for some patients because of the accumulation of radiopharmaceutical (99mTc-MDP) during the process of excretion. This is why the normal skeletal areas indicated by l3 and l4 in figure 9(a) and the kidneys indicated by l3 and l4 in figure 9(c) were incorrectly detected as lesions by the model.
- Nature of bone metastasis: asymmetry of hotspots is a core cue of clinical bone metastasis diagnosis in nuclear medicine practice. An irregular, asymmetric or eccentric radiotracer uptake in bone scans may be towards malignant involvement (Nathan et al 2013). A recent work (Saito et al 2021) studies to develop CNN-based image classification method for automatically identifying the presence or absence of bone metastasis, which takes the left-right asymmetry of hotspots into consideration. Although there are only five images in our dataset contain remarkable higher uptake in kidneys like l3 and l4 in figure 9(c), how to alleviate or even eliminate their negative effects needs to be further studied. Technological solutions such as the data normalization conducted within varied-length window would be helpful for reducing the false positives caused by symmetric hotspots in both the bone and organs.
- Scarcity of samples: it is a common challenge to build a large enough image dataset to train a model in the medical image analysis field. The performance of deep learning-based analysis, however, often positively relates to the size of the datasets. Limited samples provide no sufficient instances for an object detection model to learn rich representations of metastasis lesions with varied location, shape, and intensity. The situation becomes even much worse when human experts manually label low-resolution SPECT bone scan images to obtain ground truth. This is because manual annotation is very time-consuming, laborious, and subjective.
5. Conclusions
Targeting the automated detection of lung cancer-caused bone metastasis in low-resolution SPECT bone scan images, we proposed a SSD-based automated lesion detection model. The structure of the proposed model has been presented by detailing the processes of extracting hierarchal representations of SPECT bone scan images, locating the spatial location of a lesion, and boxing the identified lesion. Experimental evaluation conducted on clinical data of 99mTc MDP-SPECT images has demonstrated the feasibility of the proposed model on automated detection of metastasis lesions with low-resolution images. A comparative analysis has also been conducted to show the superiority of the proposed detection network against the classical SSD model and others with different feature extraction sub-networks.
We plan to extend our work in several directions in the future. First, we intend to collect more data of clinical 99mTc-MDPSPECT bone scan images to test the proposed model, to further improve and optimize the detection network. Second, emerging techniques including image super-resolution and varied-length-window data normalization will be adopted to improve the quality of the raw imaging data as much as possible. Lastly, we attempt to integrate field knowledge (e.g. structural symmetry of the body) into data patterns to develop the knowledge- and data-driven models for high-performance detection of bone metastasis lesions with 99mTc-MDP SPECT imaging data.
Declarations
Funding
This work was supported by the Key R&D Plan of Gansu Province (21YF5GA063), the Youth PhD Foundation of Education Department of Gansu Province (2021QB-063), the Natural Science Foundation of Gansu Province (20JR5RA511), the Fundamental Research Fund for the Central Universities (31920220020, 31920220054, 31920210013), the National Natural Science Foundation of China (61562075), the Gansu Provincial First-class Discipline Program of Northwest Minzu University (11080305), and the Program for Innovative Research Team of SEAC ([2018] 98).
Conflict of interest
Authors declare that they have no conflict of interest.
Availability of data and material
Anyone can get the validation subset by emailing the corresponding author by stating that the data is used for research purposes only. The whole dataset will be publicly available in the future.
Code availability
The software implementing the convolutional neural network can be made available for distribution through a collaboration agreement by contacting the corresponding author.
Author contributions
Conceptualization, Qiang Lin and Xiaoyan Chen; methodology, Qiang Lin, Yongchun Cao, and Xiaoyan Chen; software, Xiaoyan Chen, Liangxia Liu; validation, Qiang Lin, Yongchun Cao, Xiaoyan Chen, and Liangxia Liu; formal analysis, Qiang Lin, Yongchun Cao, and Zhengxing Man; investigation, Qiang Lin and Xiaoyan Chen; resources, Xianwu Zeng; data curation, Xianwu Zeng, Qiang Lin, and Yongchun Cao; writing—original draft preparation, Qiang Lin and Xiaoyan Chen; writing—review and editing, Qiang Lin, Xiaodi Huang; visualization, Xiaoyan Chen; supervision, Qiang Lin and Xiaoyan Chen; project administration, Qiang Lin; funding acquisition, Qiang Lin. All authors have read and agreed to the published version of the manuscript.
Ethics approval
The study was approved by the Ethics Committee of Gansu Provincial Tumor Hospital (Approval No.: A202106100014).
Consent to participate
All procedures performed in this study involving human participants were in accordance with the ethical standards of the Gansu Provincial Tumor Hospital research committee and with the 1964 Helsinki declaration and its later amendments or comparable ethical standards. The used bone SPECT images were de-identified before the authors received the data. The fully anonymised image data was received by the authors on June 01, 2021. A requirement for informed consent was waived for this study because of the anonymous nature of the data.
Consent for publication
Not applicable.