

Abstract
While the interaction between a needle and the surrounding tissue is known to cause a significant targeting error in prostate biopsy leading to false-negative results, few studies have demonstrated how it impacts in the actual procedure. We performed a pilot study on robot-assisted MRI-guided prostate biopsy with an emphasis on the in-depth analysis of the needle-tissue interaction in vivo. The data were acquired during in-bore transperineal prostate biopsies in patients using a 4 degrees-of-freedom (DoF) MRI-compatible robot. The anatomical structures in the pelvic area and the needle path were reconstructed from MR images, and quantitatively analyzed. We analyzed each structure individually and also proposed a mathematical model to investigate the influence of those structures in the targeting error using the mixed-model regression. The median targeting error in 188 insertions (27 patients) was 6.3 mm. Both the individual anatomical structure analysis and the mixed-model analysis showed that the deviation resulted from the contact between the needle and the skin as the main source of error. On contrary, needle bending inside the tissue (expressed as needle curvature) did not vary among insertions with targeting errors above and below the average. The analysis indicated that insertions crossing the bulbospongiosus presented a targeting error lower than the average. The mixed-model analysis demonstrated that the distance between the needle guide and the patient skin, the deviation at the entry point, and the path length inside the pelvic diaphragm had a statistically significant contribution to the targeting error (p < 0.05). Our results indicate that the errors associated with the elastic contact between the needle and the skin were more prominent than the needle bending along the insertion. Our findings will help to improve the preoperative planning of transperineal prostate biopsies.
Export citation and abstract BibTeX RIS
1. Introduction
Prostate cancer (PCa) is the most common type of cancer among men in the U.S. accounting for 27 540 estimated deaths annually (Siegel et al 2015). While the current standard approach to confirming prostate cancer is through transrectal ultrasound (TRUS)-guided biopsy, magnetic resonance imaging (MRI)-guided biopsy has also been investigated. MRI offers better tissue contrast and higher resolution of anatomical details than TRUS (de Rooij et al 2014, Panebianco et al 2015, Barentsz et al 2016) allowing physicians to sample tissues specifically from suspected lesions.
Currently, there are two forms of MRI-guided prostate biopsies: magnetic resonance (MR)-fusion biopsy and in-bore biopsy. MR-fusion biopsy guides the procedure by fusing diagnostic MR images with TRUS to highlight suspected lesions on regular TRUS images. This approach is emerging because it requires little changes to the clinical workflow of the standard TRUS-guided biopsy. However, automatic registration of MR and TRUS images remains a major technical challenge (Stoianovici et al 2014, Churukanti and Siddiqui 2015). The in-bore MRI-guided biopsy has been practiced at several institutions since early 2000. In-bore MRI-guided biopsy has several advantages over MR-fusion biopsies; its diagnostic performance is not limited by the accuracy of image registration; intraprocedural MR images can visualize the biopsy needles and the lesions allowing direct correlation of radiological and pathological findings.
MRI-guided biopsy is performed either transrectally (Ismail and Gomella 2013, Hong et al 2014), transperineally (Webb et al 1993, Penzkofer et al 2015, Gaziev et al 2017), or transgluteally (Zangos et al 2005). The transrectal approach is most commonly used thanks to its similarity to the standard TRUS-guided biopsy. On the other hand, the transperineal approach presents advantages such as better access to anterior and apical prostate regions and lower risk of sepsis over the transrectal approach (Sartor et al 2008, Pepe and Aragona 2014, Penzkofer et al 2015). The approach can also be applicable to post-colectomy patients, who are not eligible for either standard TRUS biopsy or MR-guided transrectal biopsy.
In the last decade, several robotic systems have been presented to assist the physician during MRI-guided in-bore prostate biopsies (Muntener et al 2008, Goldenberg et al 2010, van den Bosch et al 2010, Schouten et al 2012, Krieger et al 2013, Stoianovici et al 2014, Su et al 2015, Moreira et al 2017). Both transrectal and transperineal approaches have been used for robot-assisted prostate biopsy. The transperineal approach typically requires longer needle insertion length than the transrectal approach, and is more vulnerable to targeting error due to the tissue-needle interaction even if the needle is guided by a robotic needle-guide device. While the effect of needle-tissue interaction has been extensively studied in mathematical models and phantoms (Tadayyon et al 2011, Jahya et al 2013, Moreira et al 2013, Xu et al 2013, Behringer et al 2016), it has not been extensively studied in clinical cases. Such knowledge is extremely critical, given the discrepancy in targeting accuracies between phantom studies (Song et al 2013) and clinical studies (Tokuda et al 2012).
The goal of this study is to identify the factors that influence the accuracy of needle placement in vivo. To achieve the goal, we performed MRI-guided transperineal biopsies in 27 patients with the assistance of a 4 degrees-of-freedom (DoF) robot, Eslami et al (2016) and analyzed resultant needle paths along with the surrounding anatomical structures reconstructed from MR images acquired during the procedures. We evaluated impacts of needle path curvature, anatomical structures and deviation at the skin entry point on the targeting accuracy.
2. Materials and methods
2.1. Clinical setup
2.1.1. MRI-compatible Needle guide robot
The MRI-compatible robot has 4 DoF and is able to align the needle guide with the target location in the MRI bore. The robot has two trapezoidal frames actuated by four piezoelectric motors (USR60-S4N, Shinsei Corp., Tokyo, Japan). The needle guide is attached to the trapezoidal stages using ball and linear joints. The robot is equipped with limit switches, emergency kill switch, and foot pedal to enhance the safety. The foot pedal is placed in front of the bore entrance, and activates the robot motion ensuring that the robot only moves under physician's direct observation. The robot is manufactured using nonmagnetic materials and it is labeled as MR-conditional, according to the standard F2503-05 of the American Society of Testing and Materials (ASTM) (Eslami et al 2016). The robot has an average translational error of 0.33 mm in right–left (R–L) axis and 0.14 mm in anterior–posterior (A–P) axis, while the angular accuracy about R–L and A–P axes are 0.13° and 0.01° respectively (Eslami et al 2016). A fiducial frame (Z-frame) (Tokuda et al 2013) is used to register the robot position with respect to the MRI coordinate system. Further details regarding the system architecture and robot validation can be found in our previous study (Patel et al 2018).
2.1.2. Subjects
The study has been approved by the institutional review board (IRB) of the Brigham and Womens Hospital and is HIPPA compliant. The IRB determined that the system is classified as a non-significant risk device based on the Code of Federal Regulations Title 21 812.2(b). A total of 27 men were enrolled (50-80 yo, average 64 yo), including 13 men with prior negative TRUS biopsy and elevated PSA, 6 men on active surveillance (AS) for low-risk prostate cancer, and 3 men who were not candidates for TRUS-guided biopsy.
2.2. Clinical workflow
All procedures were performed in a 3 T wide-bore (70 cm) MRI scanner (MAGNETOM Verio, Siemens AG, Erlangen, Germany) in the Advanced Multi-modality Image Guided Operating (AMIGO) suite at Brigham and Womens Hospital following the workflow shown in figure 1. The workflow was adapted from the regular template-based in-bore prostate biopsy (Tokuda et al 2012).
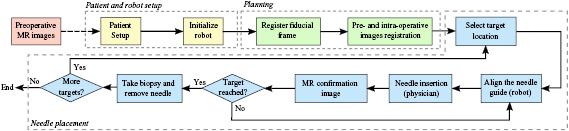
Figure 1. Workflow of the proposed robot-assisted prostate biopsy. The yellow box represent the patient and robot setup, the green boxes represent the planning phase and the blue boxes are the main steps during the needle placement.
Download figure:
Standard image High-resolution imageThe robot aligned the needle guide with a target specified on an intraproecedural MR image by the physician using either planning software (3D Slicer (Fedorov et al 2012)) or navigation software (RadVision, AcousticMed Systems, Savoy, IL, USA). Once the needle guide reached the desired position, local anesthetic was administered using a syringe inserted through the needle guide. An MRI-compatible core biopsy gun (18-gauge fully automatic biopsy gun, 150 mm or 175 mm, Invivo Corporation, Gainesville, FL) was manually inserted through the needle guide by the physician. Confirmation images were acquired using a T2-weighted multi-slice turbo spin echo (TSE) sequence to confirm the location of the needle tip. The physician visually evaluated if the target was reached. Additionally, an MRI scan covering the area between the prostate and the perineum was acquired using a volume interpolated breath-hold examination (VIBE) sequence for the detailed analysis on the needle path and placement accuracy. The imaging parameters are as listed in table 1.
Table 1. MR pulse sequences and parameters used during the robot-assisted prostate biopsy.
| Images | Seq. | TR/TE (ms) | Matrix | Slices | FA (°) | FOV (mm) | BW (Hz) | ST (mm) |
|---|---|---|---|---|---|---|---|---|
| Z-frame | TSE | 3000/111 |  |
20 | 120 |  |
260 | 2.0 |
| Planning | TSE | 4800/100 |  |
40 | 150 |  |
203 | 2.0 |
| Confirmation | TSE | 3000/106 |  |
20 | 120 |  |
260 | 3.0 |
| Validation | VIBE | 4.65/2.46 |  |
52 | 10 |  |
601 | 4.0 |
Note. Seq.: type of pulse sequence; TR: repetition time; TE: echo time; FA: flip angle; FOV: field of view; BW: bandwidth; ST: slice thickness; TSE: turbo spin echo; VIBE: volume interpolated breath-hold examination.
2.3. Analysis of targeting accuracy
The targeting accuracy was assessed based on the targeting error of each insertion. The targeting error was defined as the minimum three-dimensional (3D) distance from the reconstructed needle path (see section 2.4) to the target. The targeting errors were compared between regions and zones in the prostate using either a one-way or a Welch analysis of variance (ANOVA), depending on the Levene's test.
2.4. Needle path analysis
The goal of the analysis is to understand how the surrounding anatomical structures impact the targeting accuracy. The 3D needle paths were reconstructed by segmenting the artifacts of the needle on the validation images using the needle finder plug-in for 3D Slicer (Pernelle et al 2013), which automatically traces the needle artifacts from a single seed location manually specified at the needle tip. Additionally, the anatomical structures in the pelvic region were segmented on the planning image using the 3D Slicer software (figure 2). For each subject, the following structures were segmented: (1) prostate; (2) pelvic diaphragm; (3) bulbospongiosus; (4) bulb of the penis/corpus spongious; (5) ischiocavernosus; (6) crus of the penis/corpus cavernosum; (7) transverse perineal; (8) obturator internus and (9) rectum.

Figure 2. (a) Segmented needle paths in 3D Slicer of a representative patient. (b) Anatomic structures segmented using planning and validation MR images.
Download figure:
Standard image High-resolution imageMisalignments between the the anatomical structures segmented on the planning image and the needle trajectories reconstructed from the validation images were corrected using an intensity-based rigid image registration algorithm available in 3D Slicer (Fedorov et al 2012). The registration result was visually confirmed, and manually adjusted when necessary. In our study, the average absolute translation required to register the planning (where the structures were segmented) and the validation images (where the needle path was reconstructed) was (0.8 mm, 1.7 mm and 5.7 mm) in the RAS coordinate system.
The radius of curvature, total insertion depth, needle length inside each structure and insertion angles into each structure were calculated. Additionally, the deviation of the needle path at the entry point was also calculated. The deviation was considered as the two-dimensional (2D) Euclidean distance between the resultant needle path and the desired path on the MRI slice crossing the perineum as depicted in figure 3. The following analyses were performed using the segmented anatomical structures and needle trajectories.
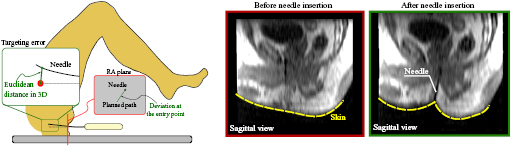
Figure 3. Left: the deviation at the entry point is computed as the distance between the needle and the intended path on the MRI slice. The targeting error is the 3D distance between the needle tip and the center of the target. Right: representative skin deformation during the needle insertion. The elastic contact between the needle and the skin before the puncture deviates the needle from the desired path.
Download figure:
Standard image High-resolution image2.4.1. Insertion depth versus targeting error
The relationship between the insertion depth and the targeting error was assessed by dividing the paths into two groups: (1) 'large-error' group and (2) 'small-error' group using the mean targeting error as the threshold. The means and the standard deviations were calculated for each group. The statistical difference between the groups was evaluated using the t-test after checking the equality of variances of the groups using the Levene's test.
2.4.2. Needle path curvature
Needle bending has been known to be one of the major causes for targeting errors in prostate biopsies (Blumenfeld et al 2007). It occurs as a result of the interaction between the bevel tip and the tissue (Rossa et al 2016), observed as a curved needle path. Therefore, the magnitude of needle bending can be quantified by the needle's radius of curvature. In order to verify the influence of the needle bending on the targeting error, we compare the radius of curvature of the needle paths between the 'small-error' and 'large-error' groups. A Mann–Whitney U test was used to check if the needle curvatures of the two groups are statistically different.
2.4.3. Impact of individual anatomical structures
The impact of each anatomical structure was assessed by comparing the targeting errors between 'intersecting' and 'non-intersecting' groups, where the groups were divided based on whether the needle path intersects the given structure. Since the data were not normally distributed, the differences between the groups were tested using the Mann–Whitney U test.
2.4.4. Deviation at the entry point
The needle path can be deviated at the skin entry point due to the interaction between the needle tip and the patient's skin. The thrust of the needle against the skin during punctuation deforms the skin and the underlying tissue layers. The deformation, in return, causes reaction forces against the needle due to the elasticities of the skin and the tissue, and may result in bending of the needle (figure 3).
In order to verify the impact of the deviation at the entry point, the deviations were compared between the 'small-error' and 'large-error' groups. The deviation of the entry point is calculated as the 2D distance between the needle and the intended path on the RA plane at the perineum (figure 3). The differences between the groups were tested using the non-parametric Mann–Whitney U test.
2.4.5. Statistical analysis using mixed-model regression
Additionally, we performed a regression analysis using a mixed model to evaluate the influence of individual structures to the targeting error. Our assumption is that the influence of a given structure to the targeting error also depends on the path length inside the structure. Therefore, the targeting error etg can be modeled as:

where, ai, bi and cpatient are the estimated parameters, L1, L2, L3, L4 and L5 are the needle length inside the prostate, pelvic diaphragm, bulbospongiosus, bulb of the penis and ischiocavernosus, respectively. L0 and  are the insertion depth into tissue that was not segmented (e.g. fat tissue) and the deviation at the entry point, respectively. The model also includes the distance between the needle guide and the patient skin (Lguide). The patient constant (cpatient) was considered the random effect, while the insertion depths and deviation at entry point were defined as the fixed effects. The p-values and the mean squared estimation error were used to evaluate the influence of each parameter. In this analysis, insertions with targeting error above 20 mm were considered outliers and excluded. The structures that are involved in at least 10% of the insertions were included in the modeling analysis (see table 3).
3. Results
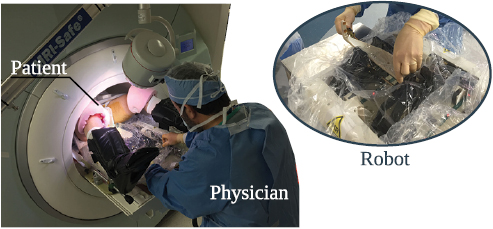
The robot was successfully used in 27 patients (figure 4). In two patients, the targets were outside the range and manually targeted. Besides the 27 cases, another two patients underwent non-targeted systematic biopsy and were not included in the study.
Figure 4. MRI-guided in-bore prostate biopsy performed with the assistance of a 4 DoF robot. The system was tested in 27 patients.
Download figure:
Standard image High-resolution image
3.1. Targeting accuracy
The mean targeting error was 7.4 mm (4.6 mm) (mean (SD)) with median value of 6.3 mm and range of (0.2 mm, 30.3 mm). Table 2 presents the targeting error for each prostate region and zone. While the one-way ANOVA showed no significant difference between the prostate regions (F2184 = 6.203, p = 0.214), the Boferroni post-hoc analysis revealed that the targeting error at the apex region was statistically lower than the error at the base and mid-gland (p = 0.019 and p = 0.002, respectively). In contrast, the one-way ANOVA showed a significant difference between the prostate zones (F2184 = 4.845, p = 0.009). The Boferroni post-hoc analysis revealed that the targeting error was only statistically different between central and transitional zones (p = 0.019).
Table 2. Mean targeting errors (with standard deviation) divided by prostate zone and region.
| Base | Mid | Apex | |
|---|---|---|---|
| Targeting error | 8.3 mm (5.9 mm) | 7.7 mm (4.3 mm) | 5.0 mm (2.8 mm) |
| Central | Peripheral | Transitional | |
| Targeting error | 5.9 mm (3.2 mm) | 7.5 mm (4.4 mm) | 9.9 mm (6.4 mm) |
3.2. Needle path analysis
3.2.1. Insertion depth versus targeting error
The t-test showed that the insertion depths were significantly different between the 'large-error' group and the 'small-error' group (t(184) = −2.521 and p = 0.013). The average insertion depths were 76 mm (14 mm) (mean (SD)) and 82 mm (13 mm) for the 'small-error' and 'large-error' groups, respectively.
3.2.2. Needle curvature
The mean radius of curvature considering all insertions was 1447 mm (1356 mm), which represents a mean curvature of  mm−1. The radius of curvatures for 'small-error' and 'large-error' groups were 1450 mm (1415 mm) and 1443 mm (1286 mm), respectively. There was no significant difference between the two groups (U = 4010 and
  ). The result indicates that, in our case, the needle bending inside the tissue was not a determinant factor for the targeting error.
3.2.3. Impact of individual anatomical structures
The involvement of each anatomical structure in the insertions is summarized in table 3. The bulbospongiosus and the bulb of the penis presented significant difference in targeting error between the 'intersecting' and 'non-intersecting' groups (both p < 0.001), while the pelvic diaphragm, ischiocavernosus, crus of the penis and transverse perineal did not present significant difference (p > 0.05). The analysis was not performed for the prostate since the targets were all inside the prostate.
Table 3. Number and percentage of insertions crossing the anatomical structures.
| Structure | Number | Percentage (%) | Structure | Number | Percentage (%) |
|---|---|---|---|---|---|
| Prostate | 144 | 76 | Crus of the penis | 5 | 2 |
| Pelvic diaphragm | 132 | 70 | Transverse perineal | 14 | 7 |
| Bulbospongiosus | 66 | 35 | Obturator internus | 0 | 0 |
| Bulb of the penis | 33 | 17 | Rectum | 12 | 6 |
| Ischiocavernosus | 28 | 14 |
3.2.4. Deviation at the entry point
The mean needle deviation at the entry point among the insertions with targeting error below the average was 2.2 mm (1.4 mm). On the other hand, among the insertions with targeting error above the average, the mean deviation was 3.3 mm (1.7 mm). The Mann–Whitney U test showed a clear statistically significant difference between the two groups (U = 2735 and p < 0.001).
3.2.5. Statistical analysis using mixed-model regression
The average estimation error ( ) was 2.22 mm (1.87 mm). Table 4 summarizes the estimated parameters and their p-values. The parameters L0, L2 and
  had p-values lower than 0.05. It is interesting to notice that the parameter related to the deviation at the entry point are greater than any other parameter, which indicates that the deviation at the entry point had the highest influence on the targeting error. In addition, the result suggests that the path length inside the pelvic diaphragm is also statistically relevant.
Table 4. Estimated fixed-effect parameters.
| b0 | b1 | a0 | a1 | a2 | a3 | a4 | a5 | |
|---|---|---|---|---|---|---|---|---|
| Parameter | 0.48 | 0.09 | 0.06 | 0.03 | 0.14 | 0.06 | 0.06 | −0.05 |
| p-value | 0.004* | 0.011* | 0.028* | 0.336 | <0.001* | 0.136 | 0.377 | 0.520 |
| Sum of sq. | 132.1 | 20.5 | 124.9 | 6.8 | 79.3 | 12.3 | 97.6 | 33.2 |
Note. p-values represent whether to reject the hypothesis that the structure actually has an impact on the error, while the parameter and the sum of the squares represent the degree of the structure influence. (b0-distance between the needle guide and the patient skin; b1-Deviation at entry point; a1-prostate; a2-pelvic diaphragm; a3-bulbospongiosus; a4-Bulb of the Penis; a5-Ischiocavernosus).
4. Discussion
The proposed system demonstrated a similar accuracy (median error of 6.3 mm) when compared to our previous work using the manual template-based approach (median error of 5.7 mm) (Tilak et al 2015). In the current study, the whole procedure was completed, on average, in 105 min. However, the procedure time can be significantly reduced by installing several components in the room permanently, simplifying adjustment mechanisms and skipping research-related steps, such as additional scans to validate the needle trajectory.
The statistical analysis showed that there was no significant difference in targeting accuracy between the prostate regions. Regarding the prostate zones, targeting error in the transitional zone was larger than in the central zone. It is worth noting that our targeting evaluation was influenced by the accuracy of the MRI-compatible robot and image registration. In our previous work, the maximum robot positioning error was reported to be 0.73 mm for translational movements and 0.272° for angular movements, which can result in a targeting error of 2–3 mm (Tilak et al 2015). Furthermore, the average Z-frame registration error was reported to be 1.1 mm and 1.4 mm on the right–left (RL) and anterior–posterior (AP) axes, respectively.
Despite the sources of error mentioned above, the targeting accuracy is also affected by several undesirable factors, such as needle bending and target motion (Blumenfeld et al 2007, Schouten et al 2012). In our study, the in-tissue bending due to the interaction between the needle and the soft tissue was not relevant for the targeting accuracy (p = 0.48). However, one of the consistent findings from our study is that the needle deviation during transperineal prostate biopsy was primarily influenced by the interaction between the needle and the skin, which was represented by the deviation at the entry point since the needle path outside the tissue cannot be captured by the MR images. The influence of the deflection outside the tissue was drawn based on the results presented in sections 3.2 (where the statistical analysis demonstrated the significance of this deviation) and III.C (where the deviation at the entry point had the highest degree of influence). It is also possible to observe in figure 3 the Sagittal view of a representative skin deformation due to the interaction with the needle. The elastic contact during the puncture deviated the needle from the intended path at the beginning of the needle path. On average, the needle was 2.7 mm away from the intended path just after the puncture.
A possible approach to cope with this issue is to perform an incision at the perineum before the insertion. Stoianovici et al made a 1 cm incision to facilitate the insertion of the needle (Stoianovici et al 2017). The incision reduced the needle deviation and contributed to the accuracy achieved in their study (targeting error of 2.5 mm). However, performing such an incision might increase patient trauma and discomfort. Another possible solution is to limit the deformation of the skin entry point due to the needle-skin interaction. In the current implementation, the needle guide was not in contact with the patient's skin in order to allow the robot to move without scratching the patient's skin, but a possible solution is to use a passive device to stabilize the patient skin and minimize tissue deformation during puncture.
Our analysis also confirms that the insertion depth has an influence on the targeting error; longer insertion depths increased the chances of having targeting errors above the average. Additionally, the trajectories crossing the bulbospongiosus seems to result in lower targeting errors (p < 0.001). On the other hand, the path length inside the pelvic diaphragm had a statistical relevance in the mixed-model analysis, which suggests that longer paths inside the pelvic diaphragm may increase the targeting error. The results indicate that it is preferable to plan a needle path crossing the bulbospongiosus. Our results also suggest that minimizing the path length inside the pelvic diaphragm and reducing the deviation at the entry point will reduce the final targeting errors. These observations can support a path planner algorithm to define the best needle path and its probability of success.
It is important to note that this study used static MR images acquired just after the insertion to analyze the needle path. Many authors considered that the shaft of the needle follows the tip path, especially for needle steering applications (Webster et al 2006); nonetheless, this might not be true in clinical cases, where the needle is subjected to internal tissue pressure and lateral motions. A more comprehensive trajectory analysis using real-time MR images will allow us to see the exact location of maximum needle deviation, yet tracking the needle tip and controlling the image plane position in real-time are still challenges to be addressed.
There are other limitations in this study. First, the needle paths were reconstructed from the susceptibility artifacts produced by the needle in the MR images. These artifacts are, in general, larger than the actual needle, which can lead to errors in the needle path reconstruction. Second, the number of estimated parameters in the mixed-model regression was relatively large for the given number of samples in the dataset; a larger dataset of needle insertions would improve the analysis. Furthermore, it is known that the geometry of the needle tip can also influence the results. During our study we could not observe any influence of different needle tip orientations in the targeting error, but different tip geometries will have a different interaction with anatomical structures and tissues as already observed by several studies (Podder et al 2005, van de Berg et al 2017). Therefore, future work should also address the influence of different tip geometries in the accuracy of transperineal biopsies.
5. Conclusion
We performed a clinical study to evaluate our needle-guide robot for MRI-guided prostate biopsy in human and presented a detailed analysis of the needle path to define the impact of different path characteristics on the targeting error using the clinical data. The evaluation indicated that the robot was able to achieve a similar accuracy when compared to our previous work. We also identified critical structures and provided a mathematical model to support the pre-operative planning.
Acknowledgment
This study was supported in part by the National Institutes of Health (R01EB020667, R01CA111288, P41EB015898). The content of the material is solely the responsibility of the authors and does not necessarily represent the official views of these agencies. The authors also thank Dr Soichiro Tani, MD (data acquisition support), Ms Janice Fairfurst, RT (intraprocedural MR imaging), Ms Angela Kanan, RN, Ms Susan Corrigan-Sheehan, RN, Ms Sandra Lawson, and Ms Shivon Cesar (supporting preclinical dry-run and clinical trial). We also thank Dr Mark G Vangel, PhD for his support with the statistical analysis. The authors have confirmed that any identifiable participants in this study have given their consent for publication.
Disclosure of conflicts of interest
NH has a financial interest in Harmonus, a company developing Image Guided Therapy products. KT received grant support through the institution provided by Canon USA. NH and KT's interests were reviewed and are managed by Brigham and Women's Hospital and Partners HealthCare in accordance with their conflict of interest policies.