

Abstract
Optimizing tracers for individual imaging techniques is an active field of research. The purpose of this study was to perform in vitro and in vivo magnetic particle imaging (MPI) measurements using a new monodisperse and size-optimized tracer, LS-008, and to compare it with the performance of Resovist, the standard MPI tracer.
Magnetic particle spectroscopy (MPS) and in vitro MPI measurements were performed in concerns of concentration and amount of tracer in a phantom. In vivo studies were carried out in healthy FVB mice. The first group (n = 3) received 60 µl LS-008 (87 mM) and the second (n = 3) diluted Resovist of the same concentration and volume. Tracer injections were performed with a syringe pump during a dynamic MPI scan. For anatomic referencing MRI was applied beforehand of the MPI measurements.
Summing up MPS examinations and in vitro MPI experiments, LS-008 showed better sensitivity and spatial resolution than Resovist. In vivo both tracers can visualize the propagation of the bolus through the inferior vena cava. MPI with LS-008 did show less temporal fluctuation artifacts and the pulsation of blood due to respiratory and cardiac cycle was detectable. With LS-008 the aorta was distinguishable from the caval vein while with Resovist this failed. A liver vessel and a vessel structure leading cranially could only be observed with LS-008 and not with Resovist. Beside these structural advantages both tracers showed very different blood half-life. For LS-008 we found 88 min. Resovist did show a fast liver accumulation and a half-life of 13 min. Only with LS-008 the perfusion fraction in liver and kidney was measureable.
MPI for angiography can be significantly improved by applying more effective tracers. LS-008 shows a clear improvement concerning the delineation while resolving a larger number of vessels in comparison to Resovist. Therefore, in aspects of quality and quantity LS-008 is clearly favorable for angiographic and perfusion studies.
Export citation and abstract BibTeX RIS
Abbreviations
| FFP | Field free point |
| MPI | Magnetic particle imaging |
| MPS | Magnetic particle spectroscopy |
| MRI | Magnetic resonance imaging |
| SPIO | Superparamagnetic iron oxide |
| SNR | Signal to noise ratio |
| ISNR | Integrated SNR |
| ROI | Region of interest |
1. Introduction
The tomographic imaging method magnetic particle imaging (MPI) allows visualizing the spatial distribution of super paramagnetic iron oxide (SPIO) nanoparticles. MPI promises high sensitivity and a spatial resolution in the sub-millimeter range (Gleich and Weizenecker 2005). Additionally, it shows a very high temporal resolution (Gleich et al 2008). The basic principle of MPI is based on the application of a magnetic gradient field featuring a field-free point (FFP). Particles in the vicinity of the FFP respond with a change of their magnetization when moving the FFP along a certain sampling trajectory. In distance to the FFP the particle magnetization is saturated such that the change of the magnetization is close to zero. Consequently, when recording the change of the magnetization with an electromagnetic receive coil, only particles within the vicinity of the FFP induce a voltage signal.
The spatial resolution of MPI is related to the size of the field-free region and the field strength for which the particle magnetization saturates (Gleich and Weizenecker 2005). While the former can be linearly influenced by the gradient strength of the FFP field, the later is linked to particle size. In theory, the larger the particles' iron core diameter the higher the spatial resolution (Goodwill and Conolly 2010). In practice, however, the core diameter is limited due to the particle anisotropy leading to magnetic relaxation effects. If the relaxation time is too long, the particle magnetization cannot follow the applied dynamic field and in turn is significantly damped.
While the magnetic core is the source of the signal generation, the coating determines the interaction between the particles and with the biological environment. Agglomeration can be prevented and blood half-life can be adjusted. It is known that Resovist (Bayer HealthCare AG), a formerly FDA approved liver MRI contrast agent, which is also a reliable MPI tracer, has a broad particle size distribution (Gleich and Weizenecker 2005). As only a fraction of the iron in Resovist is generating a MPI signal (Gleich and Weizenecker 2005) there is consequently a high potential to develop an improved tracer tailored to fit MPI purposes. In the last years several groups have studied the MPI performance of other iron oxide nanoparticles by using magnetic particle spectroscopy (MPS) in detail, an overview is given in Ludwig et al (2013). In this work we compared Resovist with a particle system specially tailored for maximizing the MPI signal by using a dedicated preclinical MPI system. A precursor of the tracer used in our study showed a threefold signal improvement in in vitro studies in comparison with Resovist (Ferguson et al 2015).
The purpose of this study was to perform in vitro and in vivo MPI measurements with LS-008 (LodeSpin, Seattle USA) and to compare it with the performance of Resovist. Criteria for comparison were sensitivity, spatial resolution, artifact level, SPIO distribution and blood clearance.
2. Methods
2.1. Tracers
Both tracers, ferucarbotran (Resovist, Bayer Pharma AG) and LS-008 (LodeSpin, Seattle, USA) have superparamagnetic iron oxide cores. Resovist is polydisperse and coated with negatively charged carboxydextran (Lawaczeck et al 1997). LS-008 consists of iron oxide cores with a median diameter of 25 nm and a monodisperse size distribution ( 0.05, where
  is the standard deviation of the number-weighted lognormal distribution function). The iron oxide cores in LS-008 were synthesized by the thermal decomposition of iron(III)-oleate with oleic acid in 1-octadecene. Details of the core synthesis can be found in Kemp et al (2016). The as-synthesized cores were hydrophobic and required an additional phase transfer step to disperse in aqueous solvents. Oleic acid-coated nanoparticle cores were encapsulated with an amphiphilic poly(maleic anhydride-alt-1-octadecene) (PMAO, Mn = 30–50 kDa), which was grafted with methoxy-polyethylene glycol-amine (m-PEG-NH2, Mn = 20 kDa) conjugated at 18.8% of the number of carboxylic acids in PMAO (Khandhar et al 2017). The final composition of LS-008 consisted of monodisperse PEGylated iron oxide cores at a concentration of 87 mM Fe in 1x-phosphate buffered saline. Surface characterization, using dynamc light scattering (Zetasize Nano ZS, Malvern Instruments), showed a z-average hydrodynamic diameter of 80 nm and a mostly neutral surface charge.
2.2. Magnetic particle spectroscopy
MPS measurements can proof the tracers' potential for the imaging performance in MPI. All MPS and MPI measurements were performed with a preclinical scanner (Bruker/Philips, Ettlingen/Hamburg, Germany) which provides three orthogonal adjustable drive field channels. While the amplitude and strength can be adjusted the frequencies of the drive fields are fixed and given by fx = 24 509.8 Hz, fy = 26 041.7 Hz, fz = 25 252.5 Hz. This leads to a period of the Lissajous trajectory of 21.53 ms covering a 3D volume. In principle, any MPI scanner can be used as MPS when the gradients of the selection field is chosen to be so small, that the field free point is larger than the sample. In this case the MPI signal is integrated over the entire sample. The gradient strength was set to 0.05 T m−1 for the MPS measurements since zero gradient lead to substantial background signal distorting the MPS spectrum. The drive field in x direction was used for the MPS measurements with an amplitude of 14 mT. 50 µl samples of LS-008 and of Resovist with each of a concentration of 45 mM were filled in 0.2 ml PCR tubes (Eppendorf AG, Hamburg, Germany). Measurements were carried out with 100 averages and 1000 repetitions.
2.3. System function measurements
For image reconstruction system functions reflecting properties of the tracer and the scanner are mandatory. Measurements of system functions were performed separately for LS-008 and Resovist using a robot and a point sample filled with 4 µl of 87 mM iron which covered a volume of 2 × 2 × 1 mm3. Resovist was diluted to exhibit the same iron concentration as LS-008. For both tracers the same parameters were used: drive field amplitude 14 mT, gradient field strength 1.5 T m−1, field of view of 37 × 37 × 185 mm3, bandwidth 1.25 MHz, and 600 averages. The resulting system matrix consisted of 25 × 25 × 25 image voxels covering a volume of 50 × 50 × 25 mm3. After 25 robot positions a background noise measurement was performed resulting in an overall scan time of 64 h each.
2.4. System function analysis for tracer comparison
Similar to MPS a MPI scanner gathers spectral information while performing a system function measurement. While during an MPS experiment the particles are always excited along their easy axis, the situation is considerably more complex for multidimensional excitations as applied during an imaging experiment. Therefore, it is essential to compare and validate a potential signal increase observed in MPS by analyzing the behavior in the multidimensional system function. For simplification of the analysis procedure we restricted our view to the x-channel and to the central robot position corresponding to the signal within the FFP. Background measurements performed without a tracer sample are used for calculating SNR values for each frequency (Franke et al 2016). The calculation of the SNR values was performed by the scanners software. During reconstruction generally a SNR threshold is applied to cancel out frequencies dominated by noise (Rahmer et al 2012).

The group of filtered frequencies contains all remaining frequencies after thresholding and N = |Filtered| is its number. Once filtered it is straight forward to sum up all SNR values to build an integrated measure (ISNR) which can picture the overall performance.

To find a suitable threshold we analyzed the frequencies between 1 MHz and 1.25 MHz where amplitudes are low and mainly noise is present. Starting with a threshold of one, letting pass all frequencies, we successively increasing the threshold stopping when ISNR(1 MHz, 1.25 MHz)/250 MHz < 10−2 MHz−1 was reached. Next the number of the remaining frequencies N was counted and the frequency fN determined, defining the highest frequency passing the SNR threshold. Finally, the ratio ISNRLS-008 (0 kHz, 1.25 MHz)/ISNRResovist (0 kHz, 1.25 MHz) over the complete spectra was calculated. This ratio can be directly interpreted as sensitivity amplification when using LS-008 instead of Resovist.
2.5. In vitro MPI and analysis
We judged the image quality of the resolution phantoms measured with various tracer concentrations. The application of a resolution phantom is essential since there is a direct but nonlinear link between spatial resolution and sensitivity, which makes theoretical predictions challenging (Ludwig et al 2013). The phantom consisted of a block of Polytetrafluorethylen with five holes of five different sizes of 5, 4, 3, 2, and 1 mm. The distances between the holes were in the order of 5, 4, 3, and 2 mm. For each tracer, LS-008 and Resovist, we filled six phantoms with iron concentrations of 87, 29, 9.7, 3.2, 1.1, and 0.4 mM. To avoid vaporization the samples were sealed with a foil. Positioning was performed by the same robot as used for system function measurements.
Images were reconstructed offline with an in house written reconstruction framework, written in Julia (Bezanson et al 2015). It is based on the iterative reconstruction scheme introduced in Knopp et al (2010) that solves a first order Tikhonov regularized least-squares functional. This is also known as the Kaczmarz algorithm. In order to obtain the best reconstruction result in terms of spatial resolution and noise the regularization parameter has to be individually optimized for each particle concentration. In general, a worse SNR in the measurement data has to be compensated for by a larger regularization parameter. To minimize noise enhancement, especially for the low concentration phantoms, we applied only one iteration step. The applied signal-to-noise ratio threshold (Rahmer et al 2012) was 1.4 as found by analyzing the system functions. Additionally, as we found substantially background noise below 80 kHz, a high pass filter was applied limiting the bandwidth to 0.08–1.25 MHz. That meant also that the third harmonic and all corresponding mixing frequencies were neglected since it was not possible to reliably subtract the background signal in a background subtraction step (Them et al 2016). 2000 averages were applied to improve the SNR.
To study the effect of the regularization parameter λ on the image quality, λ was varied in image reconstruction with steps of 2.5, 0.5, 10−1, 10−2, 10−3, 10−4, 10−5, and 10−6. A standardized region-of-interest (ROI) analysis was performed. Hereby, one ROItracer was placed over the area of holes filled with tracer material covering 17 × 9 pixels and the maximal signal values was determined. Next the mean noise floor was determined by surrounding the ROItracer by a second ROInoise (two times 17 × 4 pixels) excluding the ROItracer. The maximal SNR value was calculated by SNRmax = max(ROItracer)/mean(ROInoise) for each λ and concentration.
From the SNRmax analysis one regularization parameter was chosen to be a compromise for the different concentrations. These images were rated by an observer for image quality in concern of spatial resolution and sensitivity. Spatial resolution was judged by the delineation of the holes filled with tracer material. Sensitivity was judged by counting the number of holes that were visible in the MPI looking in each concentration step. When the reconstruction failed to resolve the filled holes the corresponding concentration was determined.
2.6. Animal handling and in vivo workflow
In vivo measurements in six healthy FVB mice were approved by the local committee on animal protection (Behörde für Gesundheit und Verbraucherschutz, Freie und Hansestadt Hamburg, Nr. 42/14). The six FVB mice (age: 8 weeks; average weight: 25 g) were divided in two equally sized groups of three animal each. The first group received 60 µl LS-008 with 87 mM iron, the second diluted Resovist of identical concentration and volume. Tracer injections were performed with a syringe pump (AL1000—220Z, World Precision Instruments) during a dynamic MPI scan.
The workflow was performed as previously published (Kaul et al 2015). Mice were anesthetized with 1–2% Isofluran at a flow of 0.5 l min−1 (Vapor 19.3, Dräger, Lübeck, Germany and Tec 7 Vaporizer, GE Healthcare, Chalfont St Giles, UK). Respiration was monitored throughout the experiments. A catheter (inner tube diameter 0.28 mm, Portex, Smiths Medical International Ltd, USA) was fixed in the tail vein for the injection of the tracer. Fiducal markers were placed on the mouse (Franke et al 2016).
First, MRI was performed for anatomic referencing. The MRI protocol consisted of a survey scan and three respiratory triggered T2-weighted scans covering the chest and abdomen in coronal, sagittal, and transverse orientations. The following scan parameters were used for the 2D turbo spin echo sequence: field of view (FOV) 32 mm, matrix 256 × 256, slices 28, thickness 0.8 mm (no gap), TR 1100 ms (triggered on every respiratory cycle at 40 cycles min−1), TE 28 ms, turbo factor 8, NSA 3 with a scanning time of 8 min each.
Then the mice positioned in the mouse bench were transferred to the MPI scanner. Fiducial markers and an online reconstruction procedure (Knopp and Hofmann 2016) were used to ensure that heart and liver were positioned into the central part of the field of view (Werner et al 2016). All MPI scans were performed with the same hardware settings as the in vitro experiments: gradient of the selection field 1.5 T m−1, amplitude of all three drive fields 14 mT resulting in a sampling volume of 37 × 37 × 18.5 mm3. The dynamic MPI scan consisted of 35 000 frames acquired with the full temporal resolution of 21.5 ms. After 6000 frames the injections of 60 µl of tracer material were performed using the syringe pump.
2.7. In vivo image reconstruction and data analysis
Reconstruction and post-processing were performed offline. Reconstruction was performed again with the Kaczmarz algorithm. Frequency filtering was applied with a bandwidth of 0.08–1.25 MHz. In contrast to the in vitro examinations where 2000 averages over 43 s were used, in the in vivo setting we aimed at reaching the full temporal resolution of 21.53 ms. As a consequence reconstruction parameter had to be adjusted. We increased the SNR threshold from 1.4. to 1.7 and the number of iteration steps was set to 3. The regularization parameter was set to 5 * 10−2 after systematically evaluating several parameters in the range of [10−4, 102] on individual frames of the time series. Firstly, the entire dynamic sequence was reconstructed with a block averaging of 5, which improved the SNR and in turn the spatial resolution of the data. Since it also lowered the temporal resolution by a factor of 5, we additionally performed single frame reconstructions, in order to visualize the major vessels during the first pass after bolus injection and in order to study the blood pulsation. Image quality concerning the delineation of the MPI signal in the inferior vena cava and by the amount of background signal was judged by an observer on a subjective scale.
Finally, co-registration was performed manually using the same image registration framework as mentioned in the in vitro experiments. Alignment of both datasets was achieved by looking for the fiducial marker and anatomic landmarks of the inferior vena cava and the heart. Image fusion/windowing, ROI handling and curve fitting were performed with ImageJ (NIH, USA) extended by a plugin (qMapIt). ROI were placed in the heart, liver, and kidney. Signal-over-time curves were extracted and compared for LS-008 and Resovist. Further quantification was performed to estimate the perfusion fraction by calculating ratios of the signal in the ROIs of liver to blood and kidney to blood, respectively. As commonly performed (Nigrovic 1993), signal decay curves in blood were fitted to a bi-exponential model a1 * exp(−m1 * t) + a2 * exp(−m2 * t). The first 6 s after signal maximum were discarded to minimize the influences of the injection. Then the curves were normalized and a Levenberg–Marquardt algorithm was applied for the non-linear least square optimization. The amplitudes a1 and a2 reflect the amount of the injected tracer but were not further analyzed. More importantly, m1 and m2 are the rate constants for the distribution and clearance were discussed.
3. Results
3.1. Magnetic particle spectroscopy
The two magnetic particle spectra of LS-008 and Resovist show decays in the amplitudes with higher frequencies (figure 1). In contrast to Resovist, LS-008 shows higher amplitudes and a longer decay which can be proven by the mean ratio of amplitudes of both spectra after a background subtraction of the noise floor. An averaged 3.4-fold amplification of LS-008 over Resovist was found.

Figure 1. Magnetic particle spectra of Resovist and LS-008 measured with a magnetic particle imaging system. (Left) LS-008 (gray) is offering higher amplitudes and a longer decay than Resovist (black). (Right) The ratio of amplitudes of LS-008 to Resovist shows a mean amplification of 3.4.
Download figure:
Standard image High-resolution image3.2. System function analysis for tracer comparison
The SNR comparison of the system function data shows that LS-008 has higher SNR values over the full frequency spectrum than Resovist (figure 2). We found the same suitable SNR threshold for the Resovist and for LS-008 system function to be 1.4. With this threshold for Resovist 3909 frequency components in the x-channel were found, the highest at 1.217 MHz. For LS-008 we found 8216 frequency components at 1.244 MHz the highest. This means that LS-008 provides more than twice frequency components. The ratio of the filtered and summed SNR values given by ISNRLS-008 (0 kHz, 1.25 MHz)/ISNRResovist (0 kHz, 1.25 MHz) was 3.7.

Figure 2. Magnetic particle spectra of Resovist and LS-008 measured with a magnetic particle imaging system using a 3D mode. (Left) Logarithmized SNR spectra of system functions of Resovist and LS-008. Only one of three channels is shown. LS-008 (gray) is offering higher SNR values and more frequency components than Resovist (black). (Right) The ratio of the integrated SNR spectra shows a mean amplification of a factor of 3.7.
Download figure:
Standard image High-resolution image3.3. In vitro MPI
After the system function analysis we calculated the maximum SNR (SNRmax) in the reconstructed phantom images to depict the impact of regularization. Plotting λ over SNRmax we generally found a decrease of SNRmax with decreasing concentration (figure 3(C)). Resovist shows a significant drop down at 3.2 mM which was less pronounced for LS-008 but also visible. For λ smaller than 10−2 the situation worsens for the low concentration phantoms so we chose λ = 10−2 as a compromise for a direct image based comparison.
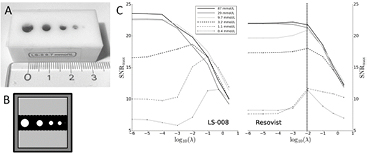
Figure 3. (A) Photo of the in vitro phantom. Holes are filled with tracer material. (B) Schematic drawing showing the position of the regions of-interest. Maximal signal determination was performed in the black area, noise analysis in the light gray area. The dark gray area was discarded and later on not reconstructed. (C) Impact of regularization λ on the image is displayed by plotting λ over SNRmax = max(signal)/mean(noise). As expected, SNRmax declines for LS-008 (left) and Resovist (right) with decreasing concentration but more for Resovist. λ = 10−2 (vertically dotted line) is generally a good setting for the varying Resovist concentrations as it shows high SNRmax values. For LS-008 an optimal regulation factor is concentration dependent and varies from 10−1 to 10−4.
Download figure:
Standard image High-resolution imageComparing the images one to one we can clearly depict a decrease in image quality with decreasing SPIO concentration for both tracers (figure 4(A)). The loss of image quality can be identified as a loss of detail, a loss of signal and an increased artifact level. First this occurs with the smallest hole containing the smallest amount of tracer material. Note that due to regularization noise visualizes as low resolution artifacts. When directly comparing both tracers, one can see that LS-008 performs clearly better than Resovist. With LS-008 four spots can be detected for concentrations higher 3.2 mM which is not possible with Resovist. Resovist depicts a significant noise increase at 1.1 mM while LS-008 still shows three delineated spots with less noise (figure 4(B)). At 0.4 mM the three spots cannot anymore be surely depicted as noise becomes more pronounced.
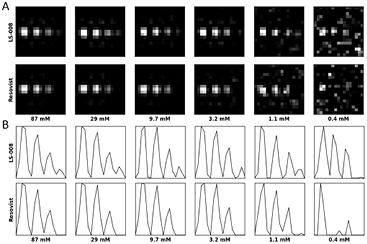
Figure 4. (A) Reconstructed images (without discarded area of figure 3 and λ = 10−2) for LS-008 and Resovist with decreasing SPIO concentrations from the left to right. At 1.1 mM the image quality is already degraded while 3 holes are still visible. At 0.4 mM reconstruction breaks down. (B) Intensity profile (in arbitrary units) along the center of the holes. Only with LS-008 four peaks can be detected. Furthermore, first and second peak for LS-008 are better delineated.
Download figure:
Standard image High-resolution image3.4. In vivo magnetic particle angiography
We analyzed the applicability of the tracers for MPI angiography. To show the reproducibility of the MPI measurements the inflow of all six examination are shown in figure 5. Both tracers could visualize the propagation of the bolus through the inferior vena cava in all six animals. Concerning the artifact level there was a clear visible quality difference (figures 5 and 6). Compared to Resovist, LS-008 clearly showed fewer temporally fluctuating artifacts probably due to the higher SNR. There were other pronounced differences in tracer performance. In frames showing the bolus leaving the heart, LS-008 clearly distinguished the aorta form the caval vein (figure 6(C)); furthermore, a vessel passing the liver and a cerebral vessel structure leading cranial was also observed (figure 6(D)). Both anatomical details were missing in images acquired with Resovist. We also examined the signal change in the caval vein triggered by periodic cardiac and respiratory motion. Again, LS-008 offers more details than Resovist (figure 6(E)) as the signal modulation caused by breathing can be clearly depicted. This modulation was visible during the whole dynamic scan time and might me exploited in future to track vital signs. The non-periodic temporal variations were generally higher for Resovist.
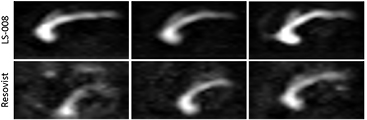
Figure 5. The experiments were performed with three mice for LS-008 and Resovist each. (Top) In all measurements with LS-008 a nice delineation of the inferior vena cava during the inflow can be found. A part of the aorta is visible as well. (Bottom) With Resovist the image quality is lower with a higher background signal and lower vessel sharpness.
Download figure:
Standard image High-resolution image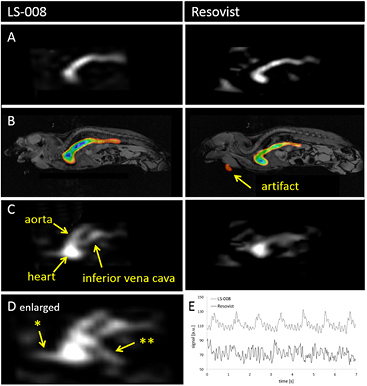
Figure 6. MPI angiography of mice with injections of LS-008 (left column) and Resovist (right column). (Line (A) and (B)) Bolus inflow through the inferior vena cava to the heart for MPI signal only (A) and co-registered with MRI (B). (Line (C)) Two seconds later and in another slice the aorta leaving the heart is visible with LS-008 but not with Resovist. The amount of artifacts increases with Resovist. (D) Five seconds after arrival in the heart with LS-008 a vessel (**) crossing the liver becomes visible. A cerebral vessel (*) as well as aorta and caval vein are shown. (E) With LS-008 in contrary to Resovist the respiratory and cardiac cycles are detectable.
Download figure:
Standard image High-resolution image3.5. Tracer distribution and kinetics
We examined the organ perfusion and SPIO distribution. Using LS-008 the visualization of the liver and kidneys as well perfused organs was successful (figures 7(A) and (B)). With Resovist kidneys could not be surely identified. A clear difference in tracer distribution between LS-008 and Resovist was depicted after 8 min (figures 7(C) and (D)). Resovist, formally developed for liver diagnostics, showed after the arrival of the bolus a decaying signal in blood while at the same time a signal increase in liver (figure 8). In contrast, the signal decay with LS-008 in blood was slower. Furthermore, after an initial perfusion the signal levels remained constant in liver and kidney. Based on the ROI analysis of the LS-008 data we calculated the perfusion fraction, defining the part of a voxel containing vessels and capillaries, being approximately 30% for liver and 22% for kidneys (figure 8).

Figure 7. Perfusion and distribution of SPIO in mice: (A) coronar image of LS-008 passing through the inferior vena cava between the kidneys after injection. (B) Signal distribution in the kidneys 3 s later. (C) and (D) Iron oxide particles are mainly metabolized by the liver. (D) After 8 min Resovist shows a strong signal in the liver. (C) LS-008 shows a weak signal caused by perfusion.
Download figure:
Standard image High-resolution image
Figure 8. Example of the dynamic signal change in heart (light grey), liver (black) and kidney (grey). (A) LS-008 shows a slow clearance after a pronounced bolus injection. Liver and kidney show a signal enhancement mainly caused by perfusion. (B) Resovist is more rapidly cleared from blood. Uptake and accumulation in liver proceed complementarily.
Download figure:
Standard image High-resolution imageModeling a bi-exponential function to the decaying signal of the intracardial blood we depicted rate constants (mean value ± standard deviation). For LS-008 we found m1 = 4.30 ± 1.54 min−1, m2 = 0.0079 ± 0.0067 min−1 and for Resovist m1 = 1.10 ± 0.49 min−1, m2 = 0.0519 ± 0.0089 min−1. m2 reflects the slower phase which is the blood clearance; m1 the fast distribution after injection. For LS-008 the blood half-life of the slow phase is 88 min and for Resovist, respectively, 13 min. In figure 9 the signal over time curves generated from the rate constants are shown. Here the 50% signal drop for Resovist is reached around 5 min. For LS-008 we extrapolated a 50% signal drop to be at 77 min.

Figure 9. Comparison of signal decay over time in the heart of LS-008 and Resovist. Tracers were injected in three mice separately. Each signal decays was normalized and fitted to a bi-exponential model. The rate constants were averaged and curves calculated. LS-008 shows a much lower clearance rate than Resovist. Confidence limits (dashed lines) were calculated by the standard deviations of the averaged rate constants.
Download figure:
Standard image High-resolution image
4. Discussion
LS-008 significantly improves MPI angiography by applying a more effective tracer regarding signal generation and image resolution. On the first glance, it might be not surprising that LS-008 performs better for angiographic purposes. LS-008 is a blood pool tracer while Resovist was developed as a diagnostic contrast agent of liver MRI. LS-008 is characterized by its PEG-coating granting a long blood half-life and its monodisperse superparamagnetic iron cores that are optimized for MPI signal generation.
The system function analysis revealed an amplification of 3.7 regarding the SNR of LS-008 compared to Resovist when using the same iron concentration. This result is in good agreement with the MPS measured with our MPI scanner. For the in vitro MPI comparison, the improved SNR directly translates to an improved image resolution as for a given concentration of LS-008 more frequencies are above the noise level. As it has been discussed in (Knopp et al 2011) it is also possible to increase the spatial resolution by improving the SNR of the measurement signal. Again, it is worth to mention that the regularization parameter trades spatial resolution and SNR. As there is generally not a single optimal regularization parameter value for all concentration levels the consequence is a suboptimal reconstruction if low and high tracer concentrations are present in the sampled volume at the same time. While for lower concentrations a larger regularization parameter might be favorable for higher a smaller would be preferable. As we placed the phantoms filled with different concentration sequentially into the MPI scanner we did not study this scenario but in vivo this is often fulfilled. A muscle with its small capillaries has in comparison to a big blood vessel a blood volume fraction of around 5% and well perfused organs of 25%. We used for the in vitro comparison a regularization value of 10−2 and here LS-008 performed better concerning the delineation and number of visualized vessels rated by an observer.
In our study we also compared the in vivo performance in mouse experiments. Resovist was diluted by a factor of 5.7 to the same concentration as the LS-008 sample that we received. Even if the group sizes were limited to three animals each, we showed that LS-008 outperforms Resovist regarding the quality of delineation and number of visualized vessels. In aspects of quality and quantity LS-008 is clearly favorable over Resovist so we did not use more than three mice each. A further aspect is the different clearance rate of the tracers. Blood half-life may be an important for determining the MPI application. Long circulation times are advantageous if a stationary phase is required or if measurements need to be performed over a longer time scale. We did not aim to measure blood half-life precisely but we could show that Resovist accumulates faster in the liver than LS-008. That Resovist has a fast liver accumulation and so a fast blood clearance is not unexpected because it was developed for liver MRI and a fast accumulation was aimed. PEG, which is used to coat LS-008, is known to increase water solvability and it prolongs circulation times (Banerjee et al 2012). The size of the PEG coating is critical because it impacts the colloidal stability and defines the hydrodynamic diameter. Clustered SPIO have a shorter blood half-life than individually coated SPIO (Khandhar et al 2015). Our results are in good agreement with previous half-life measurements of Resovist. Blood half-life values of Resovist have been analyzed by MPS in rabbits (Haegele et al 2014). Here two different production lines were compared with each other and it was found that they differ significantly. The authors found that 5 min after the first measurement, which took place directly after injection, 40% respectively 20% of the initial MPS signal was found. As we injected the tracer during the measurement we could observe the injection profile in the reconstructed data. We want to emphasis that the injections were performed in a standardized fashion by a pump so we found the injection profiles to be very similar. Invasive blood sampling is slow and misses the signal peak after injection. Nevertheless, to assure bolus mixing we had to cut off the first part of the signal over time curve before fitting a bi-exponential function in order to distinguish between a fast and a slow phase, representing distribution and clearance of the tracer. As a consequence of the longer slow phase when performing experiments in the range of several minutes up to an hour, LS-008 is preferable.
The in vivo validation is of major importance since tracers' interaction with biological tissue can significantly change the signal behavior. For instance, immobilized particles are known to generate less signal since the Brownian remagnetization process is effectively blocked (Shah et al 2015). From the biological and medical point of view this interaction might offer the potential to be used for characterizing pathologies. Multispectral MPI might be a tool to investigate this in future (Rahmer et al 2015). The fast degradation of particles inside of a cell by the acid environment of the lysosomes (Arami and Krishnan 2014) may increase the difference in the magnetic fingerprint between bound and unbound tracer even more. Thus, the signal quality is not the only aspect that defines a suitable MPI tracer but the specificity to label a certain tissue as well. The uptake of charged particles in cells is generally faster than that of non-polar particles which make them potential candidates for cell labeling and cell tracking (Zheng et al 2016). In contrast, blood pool tracers or labeling of blood cells (Rahmer et al 2013) offer the potential of interventional applications. As vessels can be discriminated from tissue the radiologist can treat e.g. a stenosis (Salamon et al 2016).
The characterization of tracers for MPI was a topic of several publications (Ferguson et al 2012, 2015, Ludwig et al 2013, Eberbeck et al 2011, Bauer et al 2015) mostly performed in vitro. Generally, authors point out that MPI tracer development is of high importance to push MPI applications into the medical field (Bauer et al 2015). Magnetic particles have to be produced in high amounts and in reproducible quality (Kemp et al 2015). Tracers can already be produced in high quality concerning size distribution, crystalline phase, chemical composition, and anisotropy (Ferguson et al 2015, Bauer et al 2016). The precursor of LS-008 showed a threefold SNR improvement in comparison to Resovist (Ferguson et al 2015). These measurements performed with MPS are in good agreement with our MPS measurements and with our system function analysis that was performed using it in 3D imaging trajectories. These trajectories can cause a different relaxation behavior, giving the potential to tailor and optimize the tracers for certain trajectories.
One limitation of this study is the fact of using only single batches of tracer material. As previously shown (Haegele et al 2014) variations in the quality of the batches are possible. Standardization is important and experiments also should be reproducible. We used standardized phantoms, a robot for exact positioning and a syringe pump for injections. Scanner hardware, excitation trajectories and reconstruction algorithms have an impact on the characterization of tracers. We did show that the regularization has a strong influence on the reconstruction result. Until now there is no consensus about the design of phantoms and about the procedures of measuring and analysis. Standardized phantoms and analysis techniques have to be developed to improve the ability for direct comparisons.
5. Conclusion
In conclusion, we investigated with LS-008 and Resovist two different kinds of tracers. The blood pool tracer LS-008 offers the possibility to study perfusion of organs while tracers accumulating in cells can be used to characterize tissue specific aspects. Both kinds of tracer give complementary information such that MPI will be capable of multispectral imaging when using tailored tracers for different applications. The development of optimized MPI tracers has high potential to improve MPI significantly. MPI angiography benefits form LS-008.
Acknowledgments
We gratefully acknowledge funding and support of the German Research Foundation. (DFG, grant number AD 125/5-1) and the Free and Hanseatic City of Hamburg. Work at LodeSpin Labs was supported by NIH grant R42 EB013520-02A1. KMK also acknowledges the Alexander von Humboldt Foundation for the 2016 Forschungspreis.