

Abstract
In a dramatic physics demonstration, a professional flutist produces four resonances with a 12 ounce Boylan soda bottle solely through her breath control. The 22 cm bottle acts like a Helmholtz resonator for the lowest pitch. The three higher pitches fall near the 3rd, 5th, and 7th harmonics for a 22 cm closed pipe. A video of this remarkable feat is provided (Ruiz 2016 YouTube: Four Resonances with a 12-ounce Soda Bottle (https://youtu.be/ibtVrp2NF_k)). The video also reveals that a flutist can bend resonance pitches by as much as 10% through control of air speed.
Export citation and abstract BibTeX RIS
The resonances and experimental data
Coauthor Erika Boysen, professional flutist and Assistant Professor of Flute at the University of North Carolina at Greensboro (NC, USA), is shown in figure 1 producing the lowest resonance on a soda bottle. The bottle she is holding is made by Boylan (www.boylanbottling.com), has a height of 22 cm, and holds 12 fluid ounces. In a later section the dimensions of the bottle are used to compare experimental results with physics models of resonance.
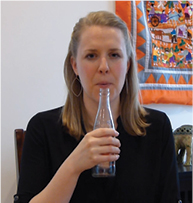
Figure 1. Professional flutist and coauthor Erika Boysen producing the lowest bottle resonance.
Download figure:
Standard image High-resolution imageThere are two applicable models for the bottle resonances: (1) the Helmholtz resonator and (2) closed-pipe harmonics. For an ideal Helmholtz resonator, think of a large jug with a small neck. The Helmholtz resonance of the system occurs because the air in the small neck region of the bottle acts like an oscillating mass attached to a spring produced by the large volume of air in the cavity below the neck. In contrast to the Helmholtz resonance of neck air-mass oscillation, closed-pipe resonances are standing waves with the usual alternating pressure nodes and antinodes, spaced at quarter wavelengths apart throughout the entire length of the pipe. The closed-pipe standing waves occur at frequencies which are odd multiples of the fundamental standing wave. After discussing the frequency data, the mathematics of the Helmholtz and closed-pipe models will be used to analyze the data.
A total of four resonances are produced by the flutist varying her air direction, speed and embouchure (lip position) formation. Watch the video [1] of reference 1 to witness the difficult and entertaining achievement of these resonances. The frequencies for the resonances are provided in figure 2 along with the closest note on the piano keyboard for each case.

Figure 2. Measured values for the four resonances, compared with piano keyboard frequencies. Middle A on the piano, to which orchestras commonly tune, is A4 = 440 Hz.
Download figure:
Standard image High-resolution imageFinding the frequencies
Three methods are used to measure the resonance frequencies: (1) matching tones with an online keyboard [2], (2) listening to beats with an online tone generator [3], and (3) employing the free Audacity frequency spectrum analyzer [4]. These methods are demonstrated in the video abstract [1]. While the Audacity software package gives the best results, introducing students to the other approaches allows the teacher to make a connection to music and demonstrate the physics of beats. Using the piano also shows students that the keyboard can be used as a frequency-measuring device. However, both of these methods have some limitations.
Keyboard
Matching tones with an online keyboard [2] is fun and relates the resonances to musical tones. But the keyboard method in general can only give approximate values as the actual resonance frequencies may not fall exactly on piano keys.
Beats
For the method of beats, when two frequencies  and
and  are near each other (
 ), the average pitch
  is heard pulsating at the difference of the frequencies: the beat frequency
  , where
  . A clip of one of the resonances is played simultaneously with the online tone generator [3] in the video of [1]. When the frequency of the tone generator is near the resonance, beats are heard. The frequency slider of the online oscillator can then be adjusted until the beats stop. At this point the reference tone matches the pitch of the unknown frequency.
A second video [5] is included where the audio of each bottle resonance shown in figure 2 is looped for one minute so that students can explore measuring the frequencies using the online keyboard [2] and tone generator [3]. Due to the looping of the sounds, it can be challenging to zero in on the frequency using beats since there are glitches from the splicing of the repeated loops. However, one can employ a beats trick here in order to do the measurement over the glitches. Find the frequencies at which the beat frequency is 4 Hz on either side of the unknown frequency. These rapid beats are easier to identify against distracting background noise (glitches). Consider an example where the unknown pitch has a frequency of 400 Hz. Finding the pair of frequencies where the beat frequency is 4 Hz will lead to frequencies 396 Hz and 404 Hz on the tone generator. The average of these frequencies is the frequency of the unknown. Instead of 4 Hz, you can use another beat frequency such as 3 Hz with this technique if that is more convenient. A student in the class with a sense of rhythm should be able to estimate the frequency pair fairly quickly without needing a clock or timer. Students can repeat the experiment a few times and then discuss the uncertainty in Hz for the measurement.
Audacity
The best method for frequency determination employs the frequency spectrum analyzer in the free audio software Audacity [4]. As illustrated in the video abstract [1], a recorded *.wav (or *.mp3) version of the sound file is opened with Audacity and a segment of the wave shown on the Audacity display screen is selected. From the menu, 'Analyze', is chosen, then 'Plot Spectrum' is selected. Next, the number of frequency divisions is set to 4096 and the mouse is placed over the tallest peak, the resonance frequency. The spectrum display indicates the measured value along with the closest corresponding note on the piano.
The experimental results using Audacity are 192 Hz, 1198 Hz, 1968 Hz, and 2632 Hz, as reported in figure 2. Comparisons of the last three values, 1198:1968:2632, are close to the ratios 3:5:7, indicating odd harmonics characteristic of a closed pipe. In the following sections physical models are used to calculate the measured frequencies of the bottle resonances. The first consideration is the lowest resonance listed in figure 2, which has an experimental value of  . The bottle is taken to be a Helmholtz resonator for this resonance.
The Helmholtz resonator
The Helmholtz resonator applies to a large bottle with a small narrow neck. See figure 3. The large volume of air  behaves as a spring driving the smaller mass of air in the neck like a harmonic oscillator. The classic Helmholtz formula for the frequency is given by

where  is the speed of sound,
  is the area at the top of the bottle,
  is the length of the neck, and
  is the larger volume of air in the bottle. For a derivation of this formula, see [6, 7].

Figure 3. Helmholtz resonator. The large volume of air designated by  acts like a spring that drives the smaller mass of air in the neck region (volume
  ) as a harmonic oscillator.
Download figure:
Standard image High-resolution imageAuthors today often modify the original Helmholtz formula to incorporate end-correction effects by taking the effective length of the neck to be  , where
  is the inner radius at the top of the bottle [7, 8]. Replacing
  with the effective length, gives the frequency

The Boylan soda bottle does not have the ideal shape for a Helmholtz resonator. A big empty apple-cider jug would be a much better fit. Nevertheless, the Helmholtz model will be applied for the lowest resonance. See figure 4 for the dimensions of the 12 ounce Boylan soda bottle.

Figure 4. The 12 ounce Boylan soda bottle, modeled by rectangular and trapezoidal cross sections. Volumes are given in millilitres (ml), equivalent to cubic centimetres (cm3). The inner diameter at the top of the bottle is 2.0 cm.
Download figure:
Standard image High-resolution imageThe soda bottle is idealized with rectangular and trapezoidal cross sections. A volume of 12 fluid ounces is equivalent to 355 millilitres (ml). But while the model (figure 4) gives a calculated total of 357 ml, the actual Boylan bottle filled with water to the top holds 371 ml. When a more complicated geometry is employed to match the 371 ml total volume, the same result for the Helmholtz frequency is obtained to two significant figures. Therefore, the model of figure 4 will be kept.
Since the Boylan bottle does not have the ideal shape of a Helmholtz resonator, which value should be taken for the length of the neck? Let's take the neck length to be  , where a horizontal dividing line is drawn across the middle of the trapezoidal region. The upper region is then considered to be part of the neck and the lower region becomes part of the large Helmholtz volume
  . The radius at our dividing line is the average of the smaller inner radius (2.0 cm/2 = 1.0 cm) at the top of the bottle and the larger inner radius (5.5/2 = 2.75 cm) at the bottom of the bottle. The average value is (1.0 + 2.75)/2 = 1.88 cm. The volume of the lower-cut trapezoidal section is given by the formula
  , where
  ,
,  , and
, and  . The result is
  , which must be combined with the
  to arrive at the Helmholtz volume
  .
.
The Helmholtz formula can now be applied, where

with  , the speed of sound at room temperature,
  , since the inner radius at the top opening is 1.0 cm,
 and
and  , the effective neck length.
The result, rounded off to two significant figures, is
The experimental value of  is very close to the theoretical estimate. Therefore, the soda bottle acts as a Helmholtz resonator for the lowest pitch produced by blowing gently across the top of the bottle.
The closed-pipe model for the remaining resonances
An ideal closed pipe is a cylindrical pipe closed at one end and open at the other. Such a closed pipe has standing-wave resonances described by the formula  where
where  is odd,
  is the speed of sound, and
  is the length of the pipe. The total vertical length of the bottle is
  with an uncertainty of 2 mm, measured with a ruler outside the bottle and verified by placing a dowel into the bottle. The bottom of the bottle is not perfectly flat, varying about 2 mm. Therefore, the length measurement has an uncertainty of about 1%.
Once again, to incorporate the corrective end-effects, the physical length  is replaced with the effective length
 . The resonance frequencies are then given by
where n is odd.
The above theoretical resonance frequencies are compared with the actual bottle resonances in table 1.
Table 1. Predicted closed-pipe resonance frequencies compared with the experimental results.
| Harmonic | Predicted value for 22 cm closed pipe (Hz) | Experimental result (Hz) | Percent deviation from predicted value (%) |
|---|---|---|---|
| 1 | 382 | Not observed | Not applicable |
| 3 | 1145 | 1198 | 4.6 |
| 5 | 1908 | 1968 | 3.1 |
| 7 | 2671 | 2632 | −1.5 |
Agreement with experiment is impressive. Note that the first closed-pipe harmonic is skipped. The missing fundamental is verified by examining the spectrum of the third harmonic, which is shown in figure 5. The tallest peak is harmonic 3 as expected, but the 'white noise' of the breath also generates the Helmholtz resonance and many closed-pipe harmonics. The additional odd harmonics have amplitudes lower than the peak of the third harmonic (see figure 5). The fundamental is missing since the nearby Helmholtz resonance drives the air-mass in the neck as a harmonic oscillator, making it difficult for a standing wave to form near the Helmholtz frequency. In engineering, Helmholtz resonators are used to suppress low-frequency standing waves in buildings [9] and in car muffler systems [10].

Figure 5. The spectrum for the resonance at 1198 Hz, the third closed-pipe harmonic. The 'white noise' in the breath also produces at lower amplitudes the Helmholtz resonance (192 Hz) and many additional closed-pipe resonances (all odd harmonics as expected). The fundamental is missing since the nearby Helmholtz resonance makes the lowest-frequency standing wave difficult to form.
Download figure:
Standard image High-resolution imageThe linear fit of the data in figure 5 is beautifully displayed in figure 6. For a double peak (e.g. harmonic 19) in figure 5, the average is taken for the plot in figure 6. The excellent linear graph (figure 6) reveals that the missing fundamental frequency is at 383 Hz. This value is only 1 Hz off from the theoretical value of 382 Hz listed in table 1.

Figure 6. Plot of the spectral data (odd harmonics) from the second bottle resonance (figure 5) minus the Helmholtz resonance. The frequency of the missing fundamental found from the best linear fit of the form y = mx is 383 Hz, in excellent agreement with the predicted theoretical value of 382 Hz.
Download figure:
Standard image High-resolution imageThe flutist and variance of resonance pitch
One should be careful not to focus too much on the very small discrepancies found between the predictions from physics models and the experimental results. For one reason, the bottle is not an ideal Helmholtz resonator, nor is it an ideal closed pipe. But an equally important second reason is that an experienced flutist can bend the pitch, making the resonance frequency flat (lower in pitch) or sharp (higher in pitch).
It is less strenuous on the flutist to demonstrate pitch bending with a small bottle. See figure 7 for a small blue bottle and its dimensions. In the video abstract [1] the flutist produces a pitch variance of 10% with this bottle. Though the small bottle is far from being an ideal Helmholtz resonator due to the rather narrow main volume region, applying the Helmholtz model anyway predicts a theoretical frequency

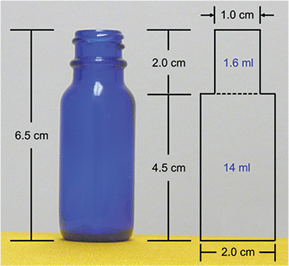
Figure 7. Small blue bottle and schematic approximation of its dimensions.
Download figure:
Standard image High-resolution imageAnalyzing the blue-bottle spectrum with 'white noise' produced by blowing gently across the top of the bottle, the experimental value for the Helmholtz resonance is found to be 810 Hz (using Audacity). Given the fact that the blue bottle is far from being an ideal Helmholtz resonator, the theoretical value of 860 Hz is fairly close to the experimental result of 810 Hz.
A screenshot from the pitch-bending section of the video from [1] appears in figure 8. As explained in the video, the faster the speed of air from the lips, the higher the pitch change. When the speed of the air column is lower, the pitch is lower. Resonance is obtained as long as the system is being driven near the resonance frequency. In addition, the angle at which the flutist blows across the top similarly affects pitch. If the bottle is angled toward the player, the distance through which the air column travels from the player's lips to the opening changes such that the pitch is lowered. Conversely, by rolling the opening away from the player, the pitch becomes higher.

Figure 8. Screenshot from our video. Coauthor Erika Boysen demonstrates the altering of pitch by controlling the speed of the air column coming from her lips.
Download figure:
Standard image High-resolution image
Though the Helmholtz amplitude-versus-frequency graph peaks at 810 Hz (resonance), the response amplitude is at least 80% of the peak value in the neighborhood of the resonance from 700 Hz to 900 Hz. Amplitude is displayed by Audacity as decibels (dB) referenced to 0 dB. The air jets of the flutist produce complicated turbulent air flow patterns that drive the bottle near resonance through a range of frequencies. Since the Helmholtz resonator is the mechanical analog of a mass on a spring, one can consider (as an analogy) what happens when a mass on a spring is driven by an applied sinusoidal driving force. The mass then oscillates at the driving frequency with amplitude given from the amplitude-versus-frequency response graph (or related formula).
The pitch-bending achieved by the flutist with the blue bottle was measured using Audacity to range from 707 Hz to 784 Hz. The corresponding change in pitch is nearly one whole step, i.e. two semitones. Although the variance is 10%, the pitches sound very close to the whole step from F5 to G5. In equal-temperament tuning, G5 is  higher than F5.
Conclusion
The video of four resonances produced by a flutist [1] with a single bottle is an effective demonstration that will capture the attention of physics students. The lowest resonance obtained is the Helmholtz resonance for the bottle. The higher three resonances fall in the harmonic series determined by the length of the bottle, which acts like a closed pipe (closed at the bottom of the bottle and open at the top). The obtained harmonics are 3, 5, and 7 since the first harmonic is suppressed by the muffling effect of the Helmholtz resonator [10]. The comparison between theory and experiment is excellent.
The bottle demonstration is rich in science, presenting teachers with an opportunity to introduce physics in order to explain the resonance effects. The demonstration is also a technical feat. The bottle sings at higher and higher pitches as the energy supplied builds, adding more suspense at each step. Students will be fascinated with this enjoyable and skillful illustration of resonance.
Acknowledgments
The authors would like to thank the referee for many helpful comments.
Biographies

Michael J Ruiz is professor of physics at the University of North Carolina Asheville (UNCA), USA. He received his PhD in theoretical physics from the University of Maryland, USA. His innovative courses with a strong online component aimed at general students have been featured on CNN.

Erika Boysen is the professor of flute at the University of North Carolina Greensboro (UNCG). She received her DMA from the University of Michigan and MM from the New England Conservatory. More information can be found at www.erikaboysen.com.