
Abstract
In sodium-ion batteries (SIBs), TiO2 or sodium titanates are discussed as cost-effective anode material. The use of ultrafine TiO2 particles overcomes the effect of intrinsically low electronic and ionic conductivity that otherwise limits the electrochemical performance and thus its Na-ion storage capacity. Especially, TiO2 nanoparticles integrated in a highly conductive, large surface-area, and stable graphene matrix can achieve an exceptional electrochemical rate performance, durability, and increase in capacity. We report the direct and scalable gas-phase synthesis of TiO2 and graphene and their subsequent self-assembly to produce TiO2/graphene nanocomposites (TiO2/Gr). Transmission electron microscopy shows that the TiO2 nanoparticles are uniformly distributed on the surface of the graphene nanosheets. TiO2/Gr nanocomposites with graphene loadings of 20 and 30 wt% were tested as anode in SIBs. With the outstanding electronic conductivity enhancement and a synergistic Na-ion storage effect at the interface of TiO2 nanoparticles and graphene, nanocomposites with 30 wt% graphene exhibited particularly good electrochemical performance with a reversible capacity of 281 mAh g−1 at 0.1 C, compared to pristine TiO2 nanoparticles (155 mAh g−1). Moreover, the composite showed excellent high-rate performance of 158 mAh g−1 at 20 C and a reversible capacity of 154 mAh g−1 after 500 cycles at 10 C. Cyclic voltammetry showed that the Na-ion storage is dominated by surface and TiO2/Gr interface processes rather than slow, diffusion-controlled intercalation, explaining its outstanding rate performance. The synthesis route of these high-performing nanocomposites provides a highly promising strategy for the scalable production of advanced nanomaterials for SIBs.
Export citation and abstract BibTeX RIS

Original content from this work may be used under the terms of the Creative Commons Attribution 4.0 licence. Any further distribution of this work must maintain attribution to the author(s) and the title of the work, journal citation and DOI.
1. Introduction
The demand for rechargeable batteries has increased in many applications such as electric vehicles, cell phone devices, stationary energy storage, and grid stabilization. Lithium-ion batteries (LIBs) are widely used because of their long cycle life and high energy density [1, 2]. However, owing to the limited availability and increasing costs of lithium, as well as the unclear supply situation, the demand for alternative safe, available, and cheap batteries is increasing [3]. Sodium-ion batteries (SIBs) are highly promising alternatives because of the low cost of sodium and its virtually unlimited availability [4–6]. SIBs are commonly fabricated from hard carbon as an anode material and naturally abundant transition-metal-based cathodes (e.g. titanium, iron, manganese) without using cobalt, making SIBs sustainable and cheap [7].
The working principles of the SIBs and LIBs are similar. However, SIBs have lower energy density compared to LIBs because sodium is heavier than lithium and has a higher standard electrode potential (−2.71 V versus SHE for sodium as compared to −3.02 V versus SHE for lithium) [8, 9]. One of the greatest challenges is the significantly larger ionic radius (Na+: 1.02 Å, Li+: 0.76 Å) that often induces structural changes during Na+ insertion and extraction, which causes storage materials to disintegrate and capacity to gradually fade [10, 11]. Developing long-term stable, environmentally friendly storage materials based on abundant elements that provide high specific capacities and operate at a reasonable potential is considered a major challenge [12]. To date, hard carbon (HC) has mainly been used as an anode material for SIBs owing to its availability, low cost, and high capacity [13]. However, HC exhibits poor rate capability and cycling stability, which limits its commercialization as an anode material for SIBs [14].
Recently, titanium-based anode materials, such as TiO2, NaTiO2 [15], Na2Ti3O7 [16], and Na2Ti6O13 [17] have received attention because of their stability and low cost [18, 19]. In particular, titania (TiO2) is a low-cost, non-toxic anode material with a moderate sodium insertion/extraction voltage (∼0.7 V versus Na/Na+). Thus, it efficiently prevents sodium plating on the anode and provides a suitable working voltage when coupled with the cathode material. During charge/discharge, TiO2 exhibits only small volume changes leading to good long-term cycling stability [20, 21]. Therefore, TiO2 in the form of its different polymorphic structures, such as anatase, amorphous, rutile [22], and TiO2 (B) [23] has been studied as an anode material for SIBs. Among them, anatase has a higher theoretical storage capacity of 335 mAh g−1 and a lower energy barrier for the insertion of Na+ than rutile and amorphous TiO2 [22]. Nano-sized particles offer a high surface-to-volume ratio to facilitate ion transport, overcoming the long diffusion time of large Na+ ions into the TiO2 crystal structure [24, 25]. In addition, small particle sizes reduce the effect of mechanical strain during the intercalation/deintercalation of Na+ because they enable the dissipation of mechanical stress via the surface. This enables a high sodium storage capacity without material disintegration [20]. However, the poor electrical conductivity of TiO2 (anatase) limits its performance and practical capacity [26]. To overcome these problems and to improve the electrochemical performance of TiO2 as anode materials in SIBs, many researchers have investigated elemental doping [27, 28], morphological control [29], and carbonaceous decoration [30, 31]. Graphene and reduced graphene oxide (rGO) have been used to generate TiO2/graphene composites with increased electronic conductivity and superior mechanical strength [32, 33]. Because of their mechanical and electrochemical stability, TiO2/Gr anodes with long cycle lives could be achieved. In addition, a strong electrostatic interaction between graphene and TiO2 with opposite surface charges enhances the interfacial storage capacity for sodium ions [34]. A strong interaction between graphene and TiO2 can reduce the diffusion energy barrier, thus improving the sodium intercalation/deintercalation process and preventing the aggregation of TiO2 nanoparticles [35, 36]. Moreover, graphene acts as a conductive network matrix, which improves the electrochemical performance and stability of electrodes [37, 38]. Therefore, the integration of ultrafine TiO2 into highly conductive and stable graphene matrices results in exceptional electrochemical performance [39]. Recently, Wang et al reported that TiO2/rGO composite anodes in SIBs delivered high reversible capacities of 280 mAh g−1 at 17 mA g−1 and excellent cycling performance with negligible capacity loss after 500 cycles at a specific current of 85 mA g−1 [36]. Xiong et al demonstrated that TiO2/rGO provides a high capacity of 300 mAh g−1 and good cycling stability, with a capacity retention of 208 mAh g−1 over 300 cycles. They attributed this performance to the introduction of graphene, which prevents the aggregation of TiO2 particles and provides a short path for Na ions during cycling [40].
Related to the above-mentioned rGO materials, freestanding gas-phase plasma-synthesized few-layer graphene provides higher conductivity and a larger specific surface area (SSA) [41], which could further improve the capacity, rate capability, and stability of TiO2-based anode materials for SIBs. This is due to the fact that rGO suffers from saturated sp3 defects, undesirable contaminations, and oxygen-bonded groups [42]. Moreover, TiO2/rGO composites are usually prepared by post-impregnation, graphene oxide (GO) reduction, and a hydrothermal process [43], which requires multiple subsequent processing steps [20, 35, 36, 40, 43–45]. As a scalable alternative, few-layer graphene synthesis in microwave plasmas has been proposed as a single-step production of high-purity and highly conductive graphene [46]. Microwave plasma synthesis involves the fast decomposition of low-cost hydrocarbon precursors, such as ethanol, to rapidly and continuously produce ultra-high-quality carbon materials [47]. In addition, cost-effective TiO2 nanoparticles have been produced using scalable spray-flame synthesis [48, 49]. Spray-flame synthesis is a promising method that can be used to synthesize a wide range of oxide nanoparticles with high crystallinity, narrow particle size distribution, and outstanding homogeneity. Therefore, this process is a good source of battery electrode materials [50] based on low-cost precursors.
Herein, we address a new pathway for the preparation of TiO2/Gr nanocomposites in dispersions of TiO2 and graphene from gas-phase-grown starting materials by utilizing electrostatic forces. The aim of this study was to prepare stable composites of TiO2 and few-layer graphene, to investigate their electrochemical performance as anode materials in SIBs, and to understand the physicochemical properties of the novel TiO2/Gr anode materials and the Na-ion storage mechanism. We found that a synergetic effect between ultrasmall TiO2 nanoparticles and graphene nanosheets [20] enhances the electrochemical performance of the anode in SIBs. In this study, we demonstrate that high-performance TiO2/Gr composites for SIB anodes can be generated from gas-borne materials, opening a scalable production route.
2. Methods and materials
2.1. Characterization methods
X-ray diffraction (XRD) patterns were recorded using a PANalytical x-ray diffractometer (X'Pert) with Cu Kα radiation (λ = 1.5406 Å). Transmission electron microscopy (TEM) and high-resolution TEM (HRTEM) images were acquired using a JEOL JEM-2200FS. Raman measurements were performed using a Renishaw inVia Raman microscope with excitation laser wavelengths of 532 nm (1000–1800 cm–1) and 680 nm (100–1000 cm–1). X-ray photoelectron spectroscopy (XPS) analysis was applied to analyze the surface chemical states of the elements in the TiO2/Gr samples and was performed with a VersaProbe II (Ulvac-Phi) with monochromatic Al Kα light at an emission angle of 45°. All the binding energies were referenced to the Cu 2p peak at 933 eV. The graphene content of the TiO2/Gr nanocomposites was determined using thermogravimetric analysis (TGA, Netzsch 449 F1 Jupiter) up to 1000 °C at a heating rate of 5 K min−1 under a flow of synthetic air (250 ml min−1). Nitrogen adsorption/desorption isotherm measurements were performed at 77 K using a Quantachrome NOVA2200 analyzer, and the SSA was analyzed according to the Brunauer-Emmett-Teller method. The ζ-potential of the material dispersions in water was determined using a Malvern Zetasizer (Malvern Panalytical, United Kingdom).
2.2. Materials
Ethanol absolute (100% on anhydrase substance) used for microwave plasma synthesis of graphene was purchased from VWR Chemicals. Titanium (IV) isopropoxide (97%) and 2-propanol (100% on anhydrate substance) used for spray flame synthesis were purchased from Sigma-Aldrich and VWR, respectively. Chemicals required for surface treatment of graphene (sulfuric acid 95%–98%, nitric acid 69%) were purchased from Sigma Aldrich and Roth, respectively. The chemicals required for battery assembly (carboxy methyl cellulose (CMC) as binder, conductive carbon, glass microfiber filter, and sodium cubes) were purchased from Sigma Aldrich. The battery electrolyte (1 mol l−1 NaPF6 in ethylene carbonate (EC), polycarbonate (PC), and diethyl carbonate (DEC) (EC: DEC: PC, 1:2:1, by wt.) + 3 wt% FEC) was directly purchased from E-lyte. All chemicals were used as received without further purification.
3. Synthesis of nanomaterials
3.1. Synthesis of TiO2 nanoparticles
TiO2 nanoparticles were synthesized using a spray-flame reactor, as described previously [51] (supplementary material, figure S1). In brief, using the SpraySyn burner [52], a 0.3 mol l-1 solution of titanium (IV) isopropoxide in isopropanol (precursor solution) was injected by a syringe pump (2 ml min−1) into a two-fluid nozzle and aerosolized by a dispersion gas mixture of oxygen (8 slm; standard liters per minute, Air Liquide, purity 99.95%) and methane (2 slm, purity 99.99%). The generated spray is ignited by a premixed methane/oxygen pilot flame (2 slm/16 slm) surrounding the spray nozzle. The SpraySyn burner was mounted at the bottom of an enclosed reactor housing. Furthermore, a coaxial sheath airflow (120 slm) surrounding the spray and pilot flames stabilized the gas flow in the reaction chamber. In addition, quenching air (230 slm) was added downstream to quench the reactor off-gas and to suppress water condensation. The synthesized TiO2 nanoparticles were collected from a PTFE-coated filter membrane located downstream of the reactor.
3.2. Synthesis of graphene
Few-layer graphene sheets were synthesized using a microwave plasma reactor, as described previously [41] (supplementary material, figure S2). Briefly, a plasma was generated using a 2 kW microwave generator (Muegge, Germany) operated at a frequency of 2.45 GHz, and a cylindrical microwave antenna (Cyrannus, iplas company, Germany) to focus the microwaves to the center of a quartz tube located within the cylindrical antenna. Liquid ethanol (0.5 ml min−1), as graphene precursor, was transported into a controlled evaporation mixing system (CEM W-209–333-P, Bronkhorst, Netherlands), mixed with a carrier gas (Ar, 5 slm), and evaporated at 180 °C. The ethanol/argon mixture was then fed through a nozzle to the center of the plasma zone. A mixture of Ar (30 slm) and H2 (1 slm) was used as coaxial sheath gas to stabilize the central gas flow and to provide an appropriate gas mixture for the creation of a stable plasma. Within the plasma zone, ethanol undergoes chemical reactions, leading to the formation of high-purity few-layer graphene [41]. Synthesized graphene was collected from a PTFE-coated filter membrane located downstream of the reaction zone. The typical production rate of this process was 200 mg h−1 .
3.3. Preparation of TiO2/Gr nanocomposites
TiO2/Gr nanocomposites were assembled using a controllable ultrasonication-assisted self-assembly process in the wet phase, which requires materials with opposite surface charges according to the scheme demonstrated for other oxide/graphene composites [53]. The amounts of graphene loaded into the composite were 20% and 30%, namely TiO2/Gr20 and TiO2/Gr30 respectively. The ζ-potential of an aqueous dispersion of as-prepared TiO2 is +40 mV, whereas pristine few-layer graphene cannot be dispersed in water because of its hydrophobicity. To make it dispersible and simultaneously enable self-assembly with TiO2 based on electrostatic interactions, its surface must be modified with polar groups to provide a negative surface charge, that is, carboxyl groups. Therefore, pristine graphene was dispersed and stirred in a mixture of concentrated nitric acid and sulfuric acid (1:2) for 30 min, collected by centrifugation, and washed with deionized water. The graphene was then dried at 60 °C under vacuum for 24 h. In the following, this material will be referred to as f-graphene.
200 and 300 mg of f-graphene were dispersed in 70 ml of water by sonication (Hielscher UP200S, 60% amplitude, 60% cycle duty, 0.6 s pulse rate) for 30 min. The dispersion of the functionalized graphene (f-graphene) in distilled water showed a ζ-potential of –34 mV (supplementary material, figure S3). Afterwards, dispersions of 700 and 800 mg of TiO2 in 120 ml of distilled water were sonicated and added to the f-graphene dispersions (300 and 200 mg), respectively, under stirring, as shown in figure 1. The obtained mixtures were cooled in an ice bath and sonicated for 1 h. The prepared TiO2/Gr nanocomposites were collected by centrifugation, washed with deionized water, and dried at 60 °C under vacuum for 16 h.
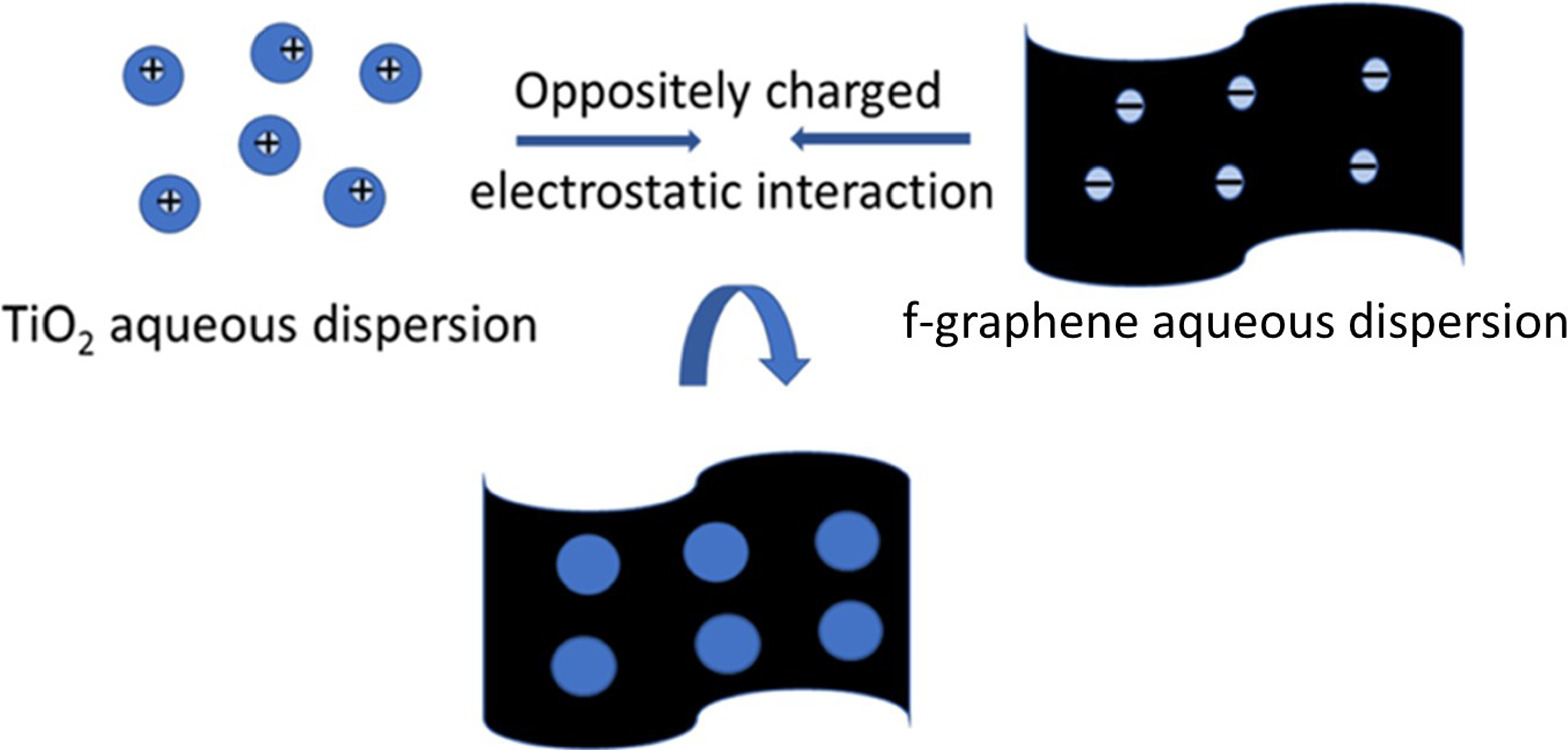
Figure 1. Schematic of the TiO2/graphene composite preparation through the interaction of positive surface charge of dispersed TiO2 nanoparticles and negative surface charge of f-graphene as confirmed by the respective ζ-potential measurements.
Download figure:
Standard image High-resolution image4. Electrode preparation and electrochemical characterization
4.1. Electrode preparation
The electrochemical performance of the as-synthesized TiO2, f-graphene, and TiO2/Gr nanocomposites as anode materials was investigated by integration into sodium half-cells. The as-synthesized TiO2, f-graphene, and TiO2/Gr nanocomposites were processed into working electrodes by mixing 75 wt% of the active material with 15 wt% Super P conductive carbon black (IMERYS-Graphite and Carbon) and 10 wt% binder (CMC, 3 wt% in H2O). Slurries of these mixtures were generated with 30% of solid content in water. The slurries were coated on copper foil as current collectors and dried at 60 °C for 12 h. The resulting electrodes were punched into discs (d = 12 mm) and dried at 120 °C for 16 h under vacuum before assembling them into T-type cells. The mass loading of the electrodes was controlled at 1.1–1.2 mg cm−2. Sodium foil was used as counter and reference electrode (12 and 8 mm in diameter), respectively. The working, counter, and reference electrodes were separated using a separator (glass microfiber filter binder-free, grade GF/F, Sigma Aldrich). 1 mol/l NaPF6 in ethylene carbonate (EC), polycarbonate (PC), and diethyl carbonate (DEC) (EC: DEC: PC, 1:2:1, by wt.) + 3 wt% FEC was used as electrolyte. T-type cells were assembled in a glovebox (O2 < 0.5 ppm, H2O < 0.5 ppm).
4.2. Electrochemical characterization
The charge/discharge cycling was performed using a Maccor battery tester in the voltage range of 0.01−3 V versus Na/Na+ at 25 °C. The first two cycles for the long-cycle tests were performed at 0.05 and 0.1 C charge/discharge rates for the formation. The charge/discharge rate of the TiO2/Gr nanocomposites at 1 C was 280 mA g−1 based on the value of the measured capacity after formation. Cyclic voltammetry and electrochemical impedance spectroscopy (EIS) of f-graphene, TiO2, and TiO2/Gr nanocomposites electrodes were measured with a Bio-Logic SAS (Model: VMP3) in the frequency range of 100 kHz to 0.1 Hz, and at different potentials between 0.01 and 3.0 V (versus Na/Na+).
5. Results and discussion
5.1. Thermogravimetric analysis (TGA)
To determine the mass fractions of graphene and TiO2 in the composites, the temperature-dependent weight loss was measured by TGA up to 1200 °C under synthetic air (supplementary material, figure S4). As-synthesized TiO2 exhibited a 6% mass loss, attributed to the desorption of water (2 wt%, below 120 °C) and the oxidation of unburned combustion residuals (4 wt%, at 150 °C–300 °C). In the nanocomposites, an additional weight loss occurred between 550 °C and 750 °C associated with the oxidation of graphene [54]. The related losses were 20.3 wt% for TiO2/Gr20, 30.5 wt.% TiO2/Gr30, and 40 wt% for TiO2/Gr40 respectively. Thus, the TGA results confirm that the intended target composition was achieved.
5.2. Structural characterization of graphene, TiO2, and TiO2/Gr nanocomposites
The as-synthesized few-layer graphene showed the characteristic morphology of crumpled 2D structures in TEM (figure 2(a)) with lateral structure sizes of several hundred nanometers [41]. Raman spectroscopy was used to analyze the quality of the graphene (figure 2(b)), where the Raman D band (∼1350 cm–1) refers to the degree of disorder, and the G band (∼1582 cm–1) indicates the bond stretching of all pairs of sp2 atoms in both rings and chains. Thus, strong covalent bonds are formed between two adjacent carbon atoms [55].
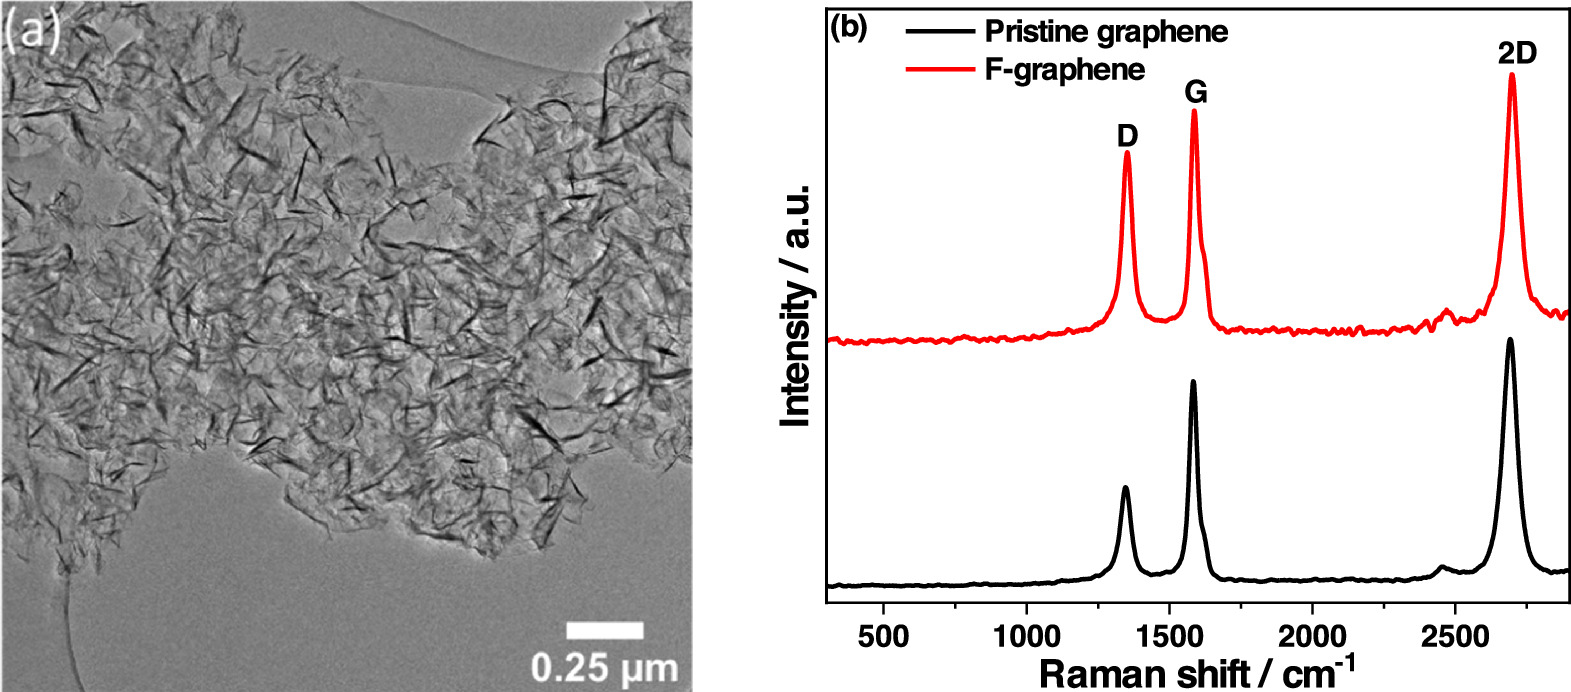
Figure 2. (a) TEM image of graphene, and (b) Raman spectra of graphene and f-graphene.
Download figure:
Standard image High-resolution imageThe ID/IG signal intensity ratio of the pristine graphene was 0.5, in combination with a strong 2D signal, indicating a very low degree of disorder and low defect density in the chemical structure. As expected, the ID/IG ratio of the functionalized graphene increased slightly to 0.77, indicating that a chemical change has taken place as a result of the functionalization.
The number of layers of the as-synthesized few-layer graphene was estimated from the theoretical SSA of single-layer graphene (2600 m2 g−1) versus the measured SSA of the as-synthesized graphene (320 m2 g−1), revealing that the as-synthesized graphene consisted of an average of eight layers stacked on each other. It is worth mentioning that there was almost no change in the SSA of graphene after surface functionalization (330 m2 g−1), indicating neither mechanical decomposition nor aggregation.
XPS analysis of pristine graphene revealed a carbon and oxygen contents of 99.2% and 0.8%, respectively, and the mass fraction of oxygen increased to 5% for f-graphene. The XPS results also indicated that the surface of f-graphene was slightly modified with attached carboxyl groups, details of the XPS analysis are provided in the supplementary material (figure S5).
In figure 3(a), the TEM image of TiO2 nanoparticles reveals aggregates with primary particles of spherical shape. The HRTEM analysis unveiled lattice fringes with a measured spacing of  nanometers (figure 3(c)). This spacing value corresponds to the anatase (101) crystal orientation of TiO2 [56]. The SSA of bare TiO2 obtained from the nitrogen adsorption measurements was 165 m2 g−1. Assuming spherical, monodisperse TiO2 nanoparticles, the average TiO2 crystallite size can be estimated from the SSA according to equation (1).

dp is the particle diameter and ρ is the weighted average density of the particle (4.25 g cm−3) considering the different densities and fractions of anatase and rutile as obtained from XRD analysis. The calculated primary particle size from the BET SSA was approximately 8.5 nm, which is in very good agreement with the TEM analysis, as shown in figure 3(b).
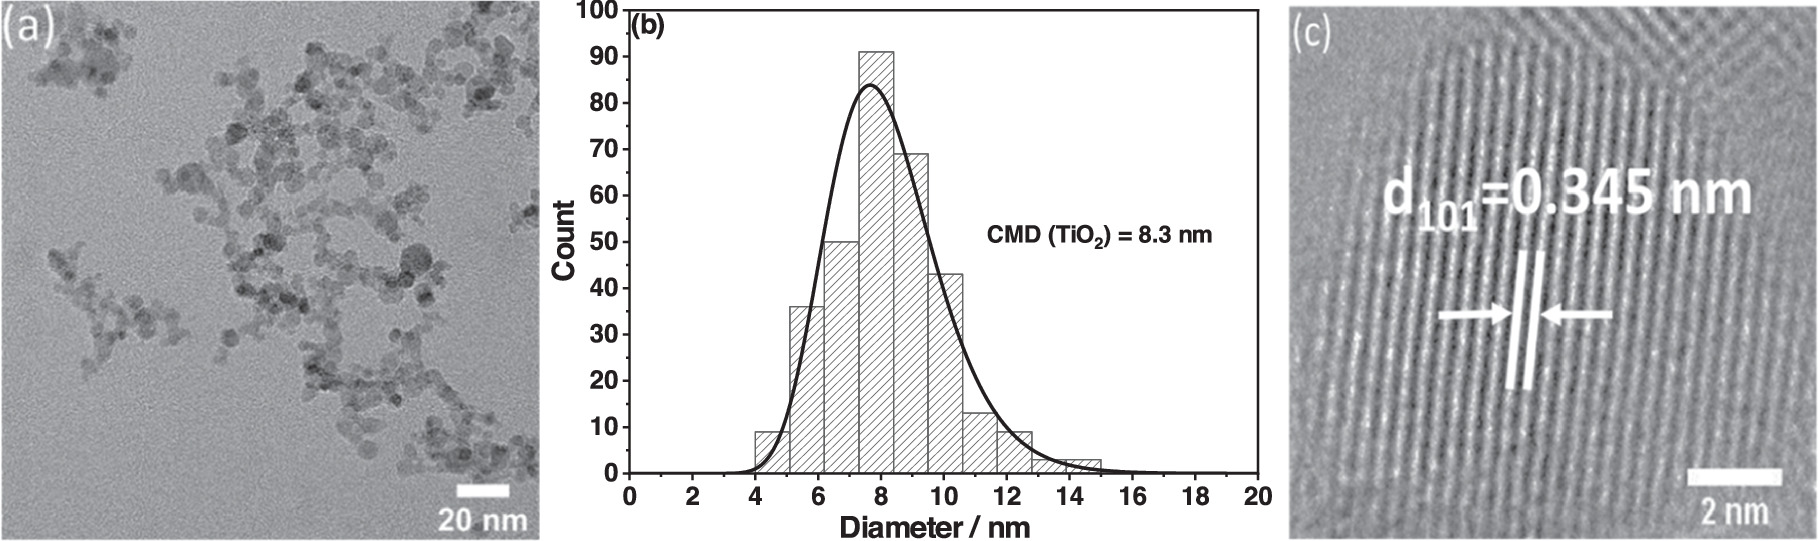
Figure 3. (a) TEM image of TiO2, (b) histogram of the particle size distribution from TEM with log-normal fit, CMD stands for count median diameter, and (c) HRTEM of TiO2 nanoparticles.
Download figure:
Standard image High-resolution imageThe Raman spectrum of bare TiO2 (figure 4(a), black line) shows five peaks at 146, 196, 399, 519, and 639 cm–1 which can be assigned to the characteristic TiO2 anatase Raman modes, consistent with the literature [57, 58]. In addition, powder XRD was used to analyze the structural composition of TiO2, which also indicated anatase as the main phase (ICSD card 98–015–4604) with traces of the rutile phase (ICSD card 98–020–0391). Rietveld refinement of the diffraction pattern revealed that the material consisted of 90 wt% anatase and 10 wt% rutile (supplementary material, figure S6).
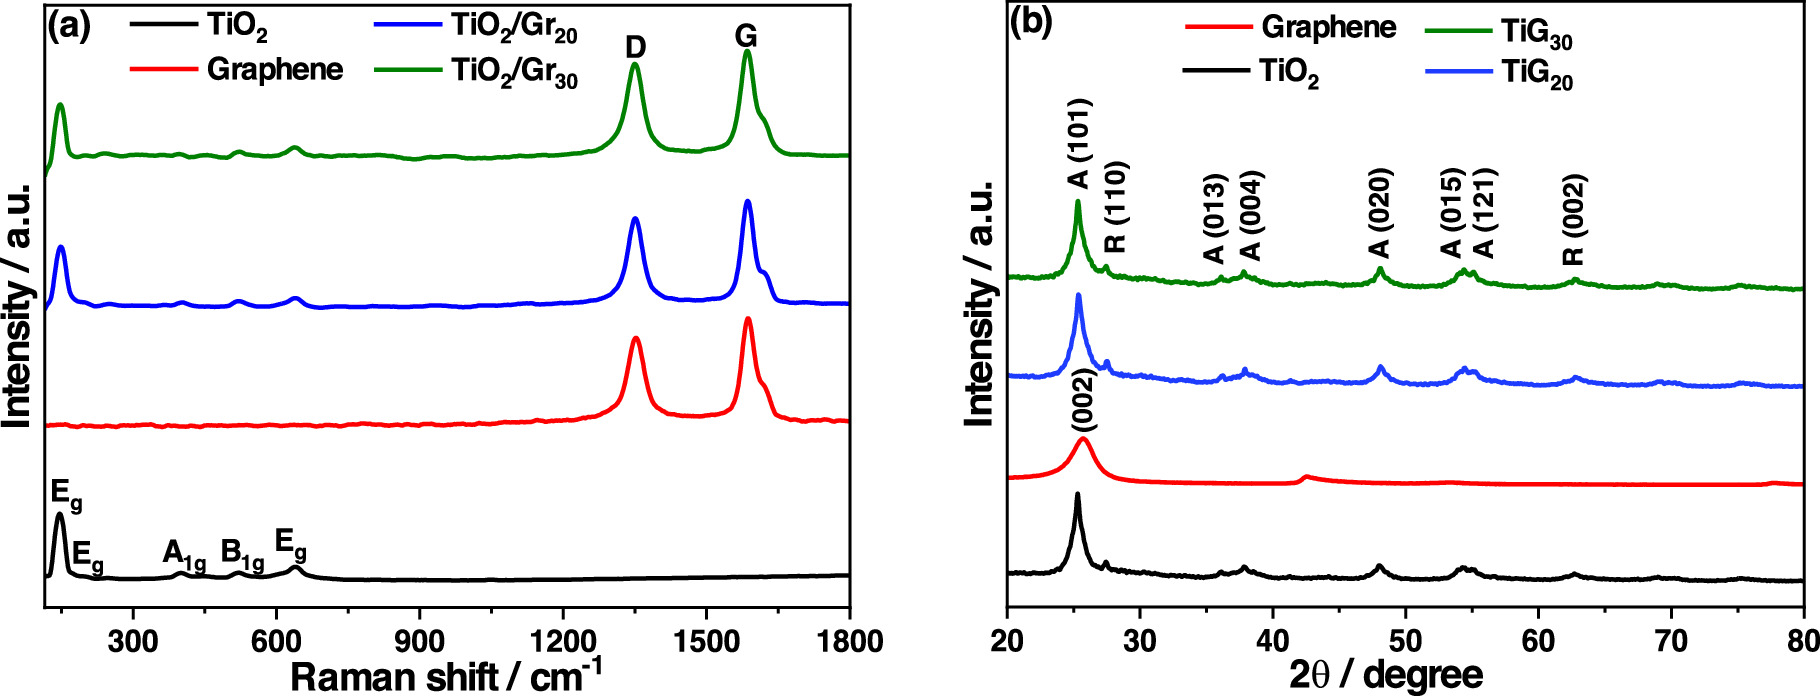
Figure 4. (a) Raman spectra and (b) XRD patterns for TiO2, graphene, and TiO2/Gr nanopowders. In the XRD graphs, (A) stands for anatase and (R) for rutile.
Download figure:
Standard image High-resolution imageRaman and XRD studies of TiO2/Gr20 and TiO2/Gr30 composites (figure 4, blue and green graphs) confirmed the presence of a composite material. The Raman results indicated that the deposition of TiO2 nanoparticles on the graphene nanosheets did not lead to a change or decomposition of the graphene structure because the ID/IG ratio is identical to that of the functionalized graphene (figure 2(b)). Thus, no change was detected in the Raman peaks of TiO2 and f-graphene after assembly, which confirms that the electrostatically induced self-assembly does not lead to a change in the structure of the materials.
The analysis of the XRD data revealed that the typical (002) diffraction peak of graphene at  (red graph, figure 4(b)) [59] almost disappeared after assembling the composites (green and blue graphs), suggesting that the signal was either masked (position is almost identical to the anatase (101) peak) or almost vanished because of the massive TiO2 nanoparticle coverage [60, 61]. The mixing of TiO2 and f-graphene was also confirmed by analyzing the SSAs of the composites. While the starting materials have SSAs of 165 m2 g−1 (TiO2) and 320 m2 g−1 (f-graphene), the SSA of the composites were in between, as expected, 197 m2 g−1 (TiO2/Gr20), 250 m2 g−1 (TiO2/Gr30), and 185 m2 g−1 (TiO2/Gr40).
TEM studies of TiO2/Gr30 showed a very uniform distribution of TiO2 on the graphene flakes (figures 5(a) and (b)), which was confirmed by elemental mapping of the nanocomposite (figures 5(d)–(g)). The HRTEM image shown in figure 5(c) indicates an intimate mechanical contact between graphene and TiO2 and also shows the crystal structure of anatase with an interlayer spacing of 0.345 nm, corresponding to the (101) plane as well as the graphene structure. The distribution of TiO2 on the f-graphene surface did not lead to changes in the crystal structure of TiO2. However, the agglomeration tendency of TiO2 nanoparticles in the TiO2/Gr40 nanocomposite increased (see supplementary material, figure S7).
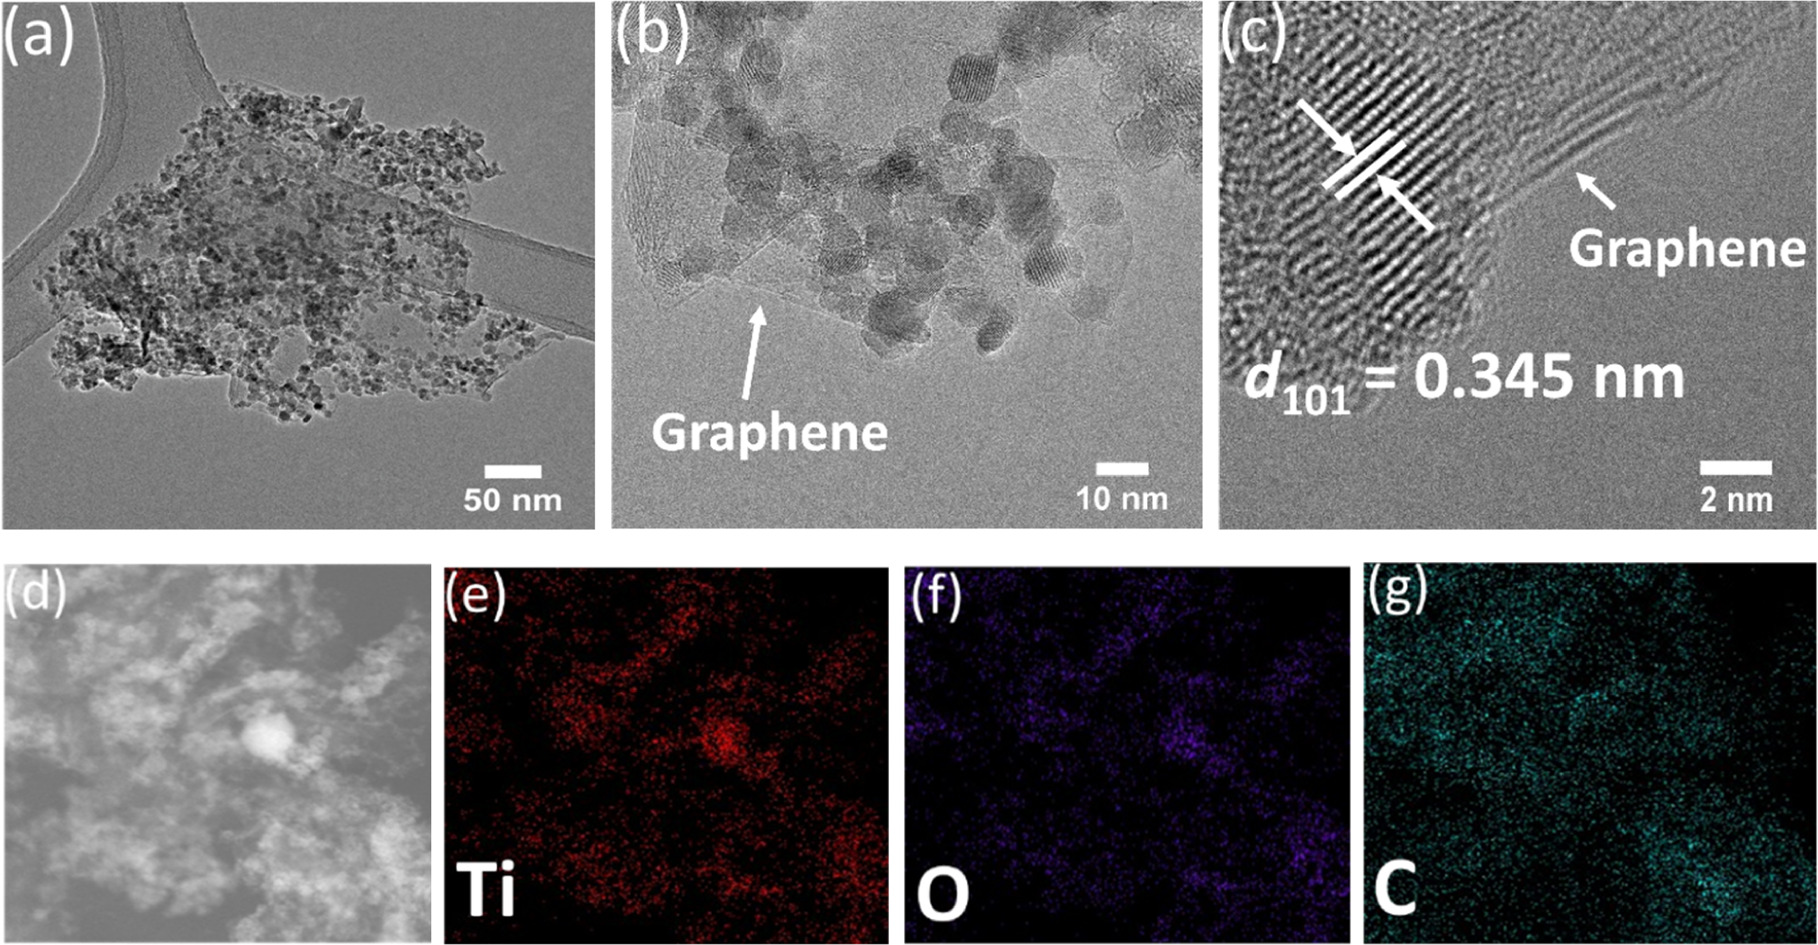
Figure 5. (a) Low-magnification, (b) high-magnification and (c) HRTEM image of TiO2/Gr30. (d)–(g): elemental mapping of TiO2/Gr30 nanocomposites indicating a homogeneous distribution of the TiO2 particles on f-graphene.
Download figure:
Standard image High-resolution image5.3. Electrochemical performance
The cycling stability and rate capability of TiO2, graphene, and TiO2/Gr nanocomposites were investigated by testing them as anode materials in electrochemical half cells. Figure 6(a) shows the respective results for all materials discussed. After formation, the reversible capacity of TiO2 (black graph) decreased within 60 cycles from 147 to 113 mAh g−1. The initial reversible capacity of f-graphene (red graph) was less than 100 mAh g−1, which can be attributed to the large size of the sodium ions and the low number of active adsorption sites of graphene [62]. An anode prepared by simple physical mixing of f-graphene (30 wt%) and TiO2 (purple graph) showed an initial capacity of about 131 mAh g−1, which is roughly the weighted average of the capacitances of the two starting materials. TiO2/Gr40 exhibited a higher capacity than TiO2, but a lower capacity than TiO2/Gr20 and TiO2/Gr30, which can be attributed to the agglomeration of the nanoparticles (see supplementary material, figure S7) as well as a lower SSA compared to both composites, and therefore a decreased number of active sites.
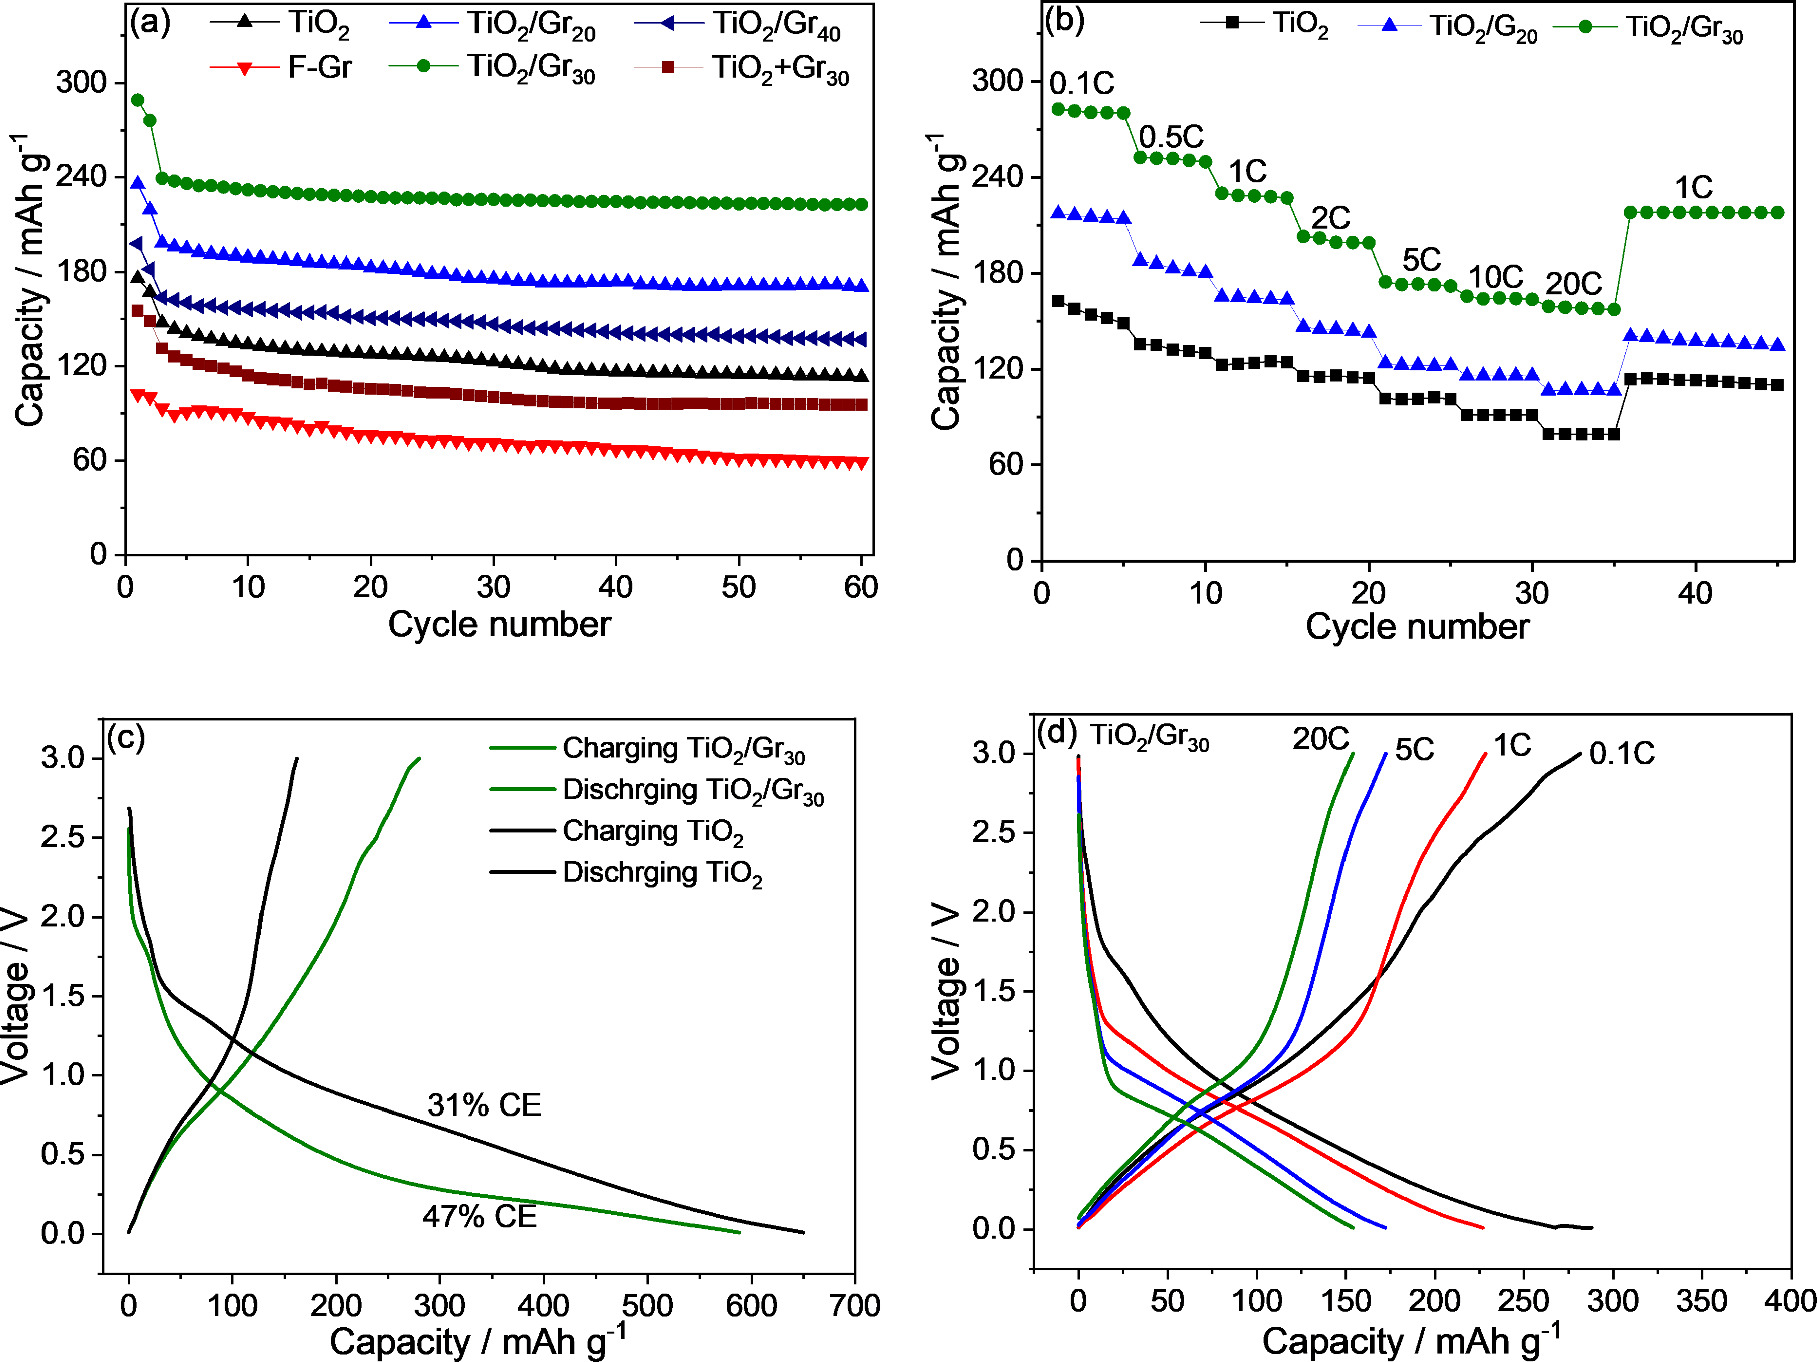
Figure 6. (a) Cycling performance at 0.5 C and (b) rate capability of graphene, TiO2, TiO2/Gr20 , and TiO2/Gr30. (c) Charge/discharge curves of the first cycle for TiO2 and TiO2/Gr30 , and (d) charge/discharge curves of the fifth cycle in each case (TiO2/Gr30 ) measured at 0.1, 1, 5, and 20 C.
Download figure:
Standard image High-resolution imageIn contrast, TiO2/Gr20 and TiO2/Gr30 both exhibited significantly increased initial capacities after formation (198 and 240 mAh g−1, respectively), which were much higher than the capacities of the physical mixtures discussed before. This increase in capacity can only be explained by a synergistic effect between the TiO2 nanoparticles and graphene [20] rather than their individual contributions. A similar behavior has been previously reported for a composite of TiO2 and reduced graphene oxide, and the synergistic effect has been attributed to the storage of sodium at the TiO2/rGO interface [20]. Compared to the starting materials and the physical mixture, the composites were also characterized by higher cycle stability (84% and 93% for TiO2/Gr20 and TiO2/Gr30, respectively, after 60 cycles).
In addition to the synergistic effect that can be attributed to the high TiO2/Gr interfacial area and short diffusion paths, the graphene nanosheets can decrease the polarization of the electrodes by maintaining sufficient electronic conductivity [63, 64], which also contributes to the improved performance. The decrease in polarization was also confirmed by cyclic voltammetry (CV) of TiO2/Gr30 nanocomposites compared to that of pristine TiO2 (supplementary material, figure S8). CV measurements were recorded after the third cycle at a rate of 0.1 mV s−1. The anodic and cathodic peaks of pristine TiO2 are located at (0.8 V) and (0.55 V) respectively, while the anodic and cathodic peaks of TiO2/Gr30 are positioned at 0.8 and 0.6 V. The higher current in the CV measurements of TiO2/Gr30 along with the lower polarization between the sodiation and desodiation voltages (ΔE = 0.2 V) indicates higher electrochemical activity, better reversibility, and lower polarization of the composite anode [65]. In addition, EIS was performed to further analyze the performance of the TiO2/Gr nanocomposites. In the Nyquist plots (supplementary material, figure S9), the semicircles are correlated to the SEI film and charge transfer resistances. The diameters of the semicircles of TiO2/Gr20 and TiO2/Gr30, i.e. their Ohmic contributions were noticeably smaller than that of pristine TiO2, also indicating higher electronic conductivity of the TiO2/Gr nanocomposites.
The synergistic effect of the TiO2/Gr nanocomposite is also expressed in the rate capability of the materials, as shown in figure 6(b). TiO2/Gr30 shows an average overall reversible capacity of 281 mAh g−1 at 0.1 C and still delivers a high capacity of 158 mAh g−1 at a charge/discharge rate of 20 C. In contrast, the TiO2 electrode showed a significantly lower rate performance with capacities of 155 and 79 mAh g−1 at 0.1 and 20 C, respectively. In addition, TiO2/Gr30 exhibited 95% of initial capacity at 1 C when the current density was reversed back to 1 C, whereas TiO2 exhibited only 70% of its initial capacity under the same conditions. Charge/discharge curves of TiO2 and TiO2/Gr30 show that the initial Coulombic efficiency of pristine TiO2 is significantly lower (31 versus 47%, figure 6(c)). The noticeable increase in Coulombic efficiency can be ascribed to the enhanced electronic conductivity of the composite (figure S9). Furthermore, the integration of graphene can enhance the structural stability of TiO2 [66]. Charge/discharge curves of different current densities of TiO2/Gr30 are also shown in in figure 6(d) supporting the results shown in figure 6(b).
Long-term tests at 3 and 10 C charge/discharge showed excellent composite capacity retention and stability of the TiO2/Gr30 nanocomposites (155 mAh g−1 after 500 cycles at a charge/discharge rate of 10 C with a capacity retention of 96% after 500 cylces, figure 7(b)).
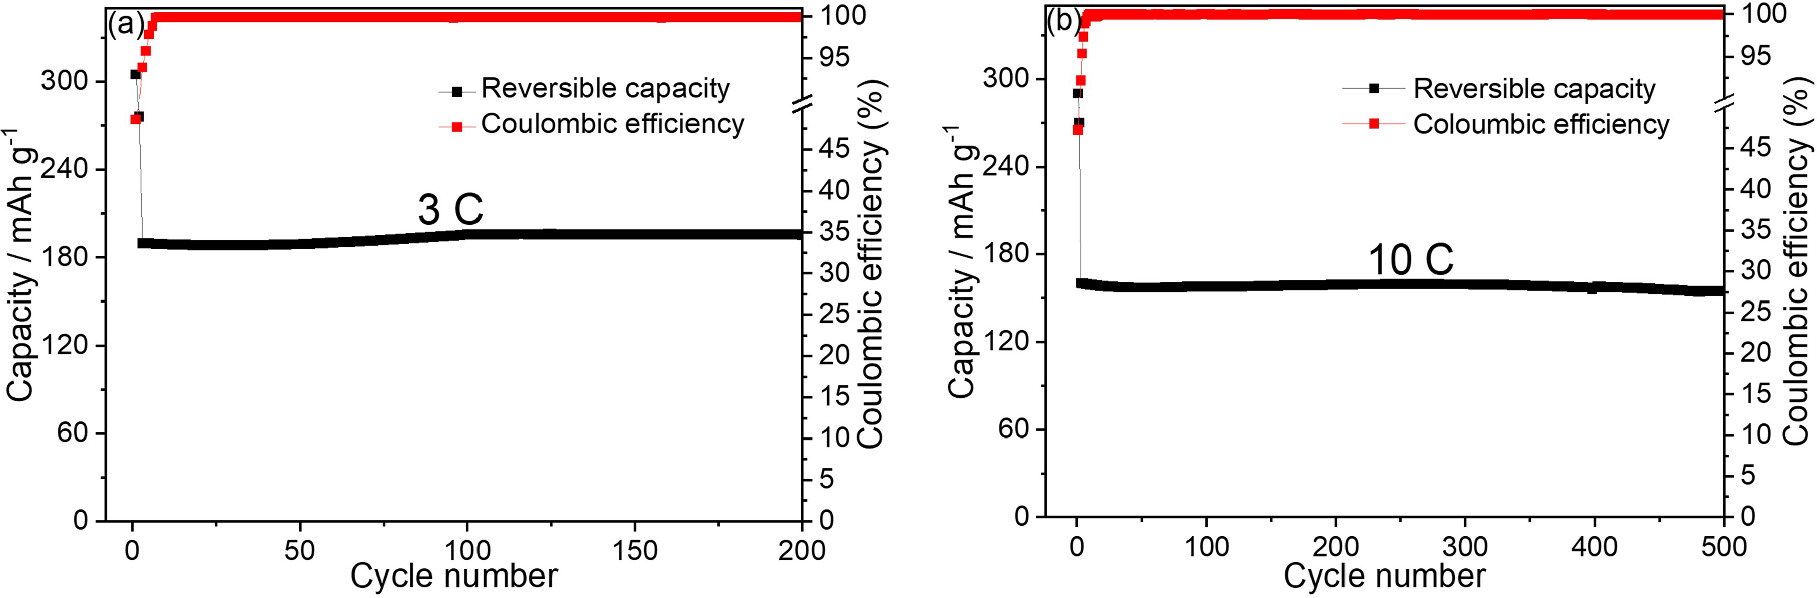
Figure 7. Cycle performance of TiO2/Gr30 at (a) 3 C and (b) 10 C charge/discharge.
Download figure:
Standard image High-resolution imageWe ascribe the outstanding high-rate performance of the TiO2/Gr30 nanocomposites to the enhancement of the electrical conductivity of charge transfer due to the strong interaction between TiO2 nanoparticles and graphene sheets, as well as the high TiO2/Gr interface area, which provides additional storage space to host Na ions [67]. Overall, the TiO2/Gr30 nanocomposites showed higher capacity and stability than most of the reported TiO2-based anode materials for SIBs (for comparison see table 1). Compared to previous works where rGO was used [43, 45], we attribute the excellent electrochemical performance of the nanocomposites investigated here to the utilization of high-surface-area TiO2 and highly conductive graphene, both synthesized by gas-phase methods.
Table 1. Comparison of the electrochemical performance of TiO2/Gr nanocomposites presented in this work with previous reports of TiO2-based anode materials for sodium-ion batteries (standardized to 1 C: 280 mA g−1).
| TiO2-based anode materials | Observations | References |
|---|---|---|
| TiO2 nanoparticles/graphene | Rate performance of 281 and 158 mAh g−1 at 0.1 and 20 C. | This work |
| TiO2 nanoparticles/graphene | Long cycle stability of 155 mAh g−1 after 500 cycles | This work |
| TiO2 quantum dots in graphene nanoribbons | Specific reversible capacity 101.6 mAh g−1 at 1.8 C after 100 cycles | [68] |
| Photonic split-second induced mesoporous TiO2-graphene | 212 and 93.2 mAh g−1 at 0.35 and 7 C. | [39] |
| Hydrogenated anatase TiO2 | 146 mAh g−1 at 8.5 C | [69] |
| N-doped modified graphene/mixed crystal phases TiO2 | 223.3 mAh g−1 at 0.35 C after 50 cycles and 101.1 mAh g−1 at 7 C | [70] |
| TiO2 nanoparticles/reduced graphene oxide | 98.2 and 72 mAh g−1 at 7 C and 14 C. | [20] |
| Carbon-free anatase/bronze TiO2 microsphere | 221 mAh g−1 at 0.08 C | [71] |
| Nitrogen-doped TiO2 nanotube | 232 and 114 mAh g−1 at 0.1 and 20 C. | [72] |
| TiO2 nanotubes anchored on a large-area graphitic carbon nitride/reduced graphene oxide | 138.5 mAh g−1 after 244 cycles at 0.35C 103.3 mAh g−1 at 2.7 C | [73] |
6. Sodium ion storage mechanism
For a more detailed investigation of the sodium-ion storage behavior of TiO2 in the composite, ex situ HRTEM studies were performed on materials obtained from the battery cells at charged and discharged states. Figure 8(a) shows the HRTEM image of a fully sodiated TiO2/Gr30 anode material, sampled at a voltage of 0.01 V. Compared to pristine TiO2, an additional lattice spacing value of 0.62 nm could be identified. This can be attributed to the formation of a new phase of Nax TiO2 due to the direct intercalation of sodium ions into the anatase phase. A similar lattice spacing value corresponding to the (−101) plane has been observed previously [74]. However, the typical d-spacing of the anatase phase (0.345 nm) still exists, indicating that the anatase phase was only partially transformed into a new phase. This is in line with the finding that the measured storage capacity of pure TiO2 was much lower than the theoretical value of 147 mAh g−1. Traces of this new phase still exist after discharge (3 V). Figure 8(b) also shows lattice spacings of 0.62 nm indicating that the anatase phase is not fully recovered, which also can explain the reduced first cycle efficiency. However, despite evidence of the TiO2/Gr interface storage mechanism of Na ions, direct intercalation of Na+ into the bulk of TiO2 occurs. From the EDX images, it is obvious that the amount of sodium is reduced after desodiation but does not vanish, also explaining, besides parasitic surface reactions, the low Coulombic efficiency of the first cycles.
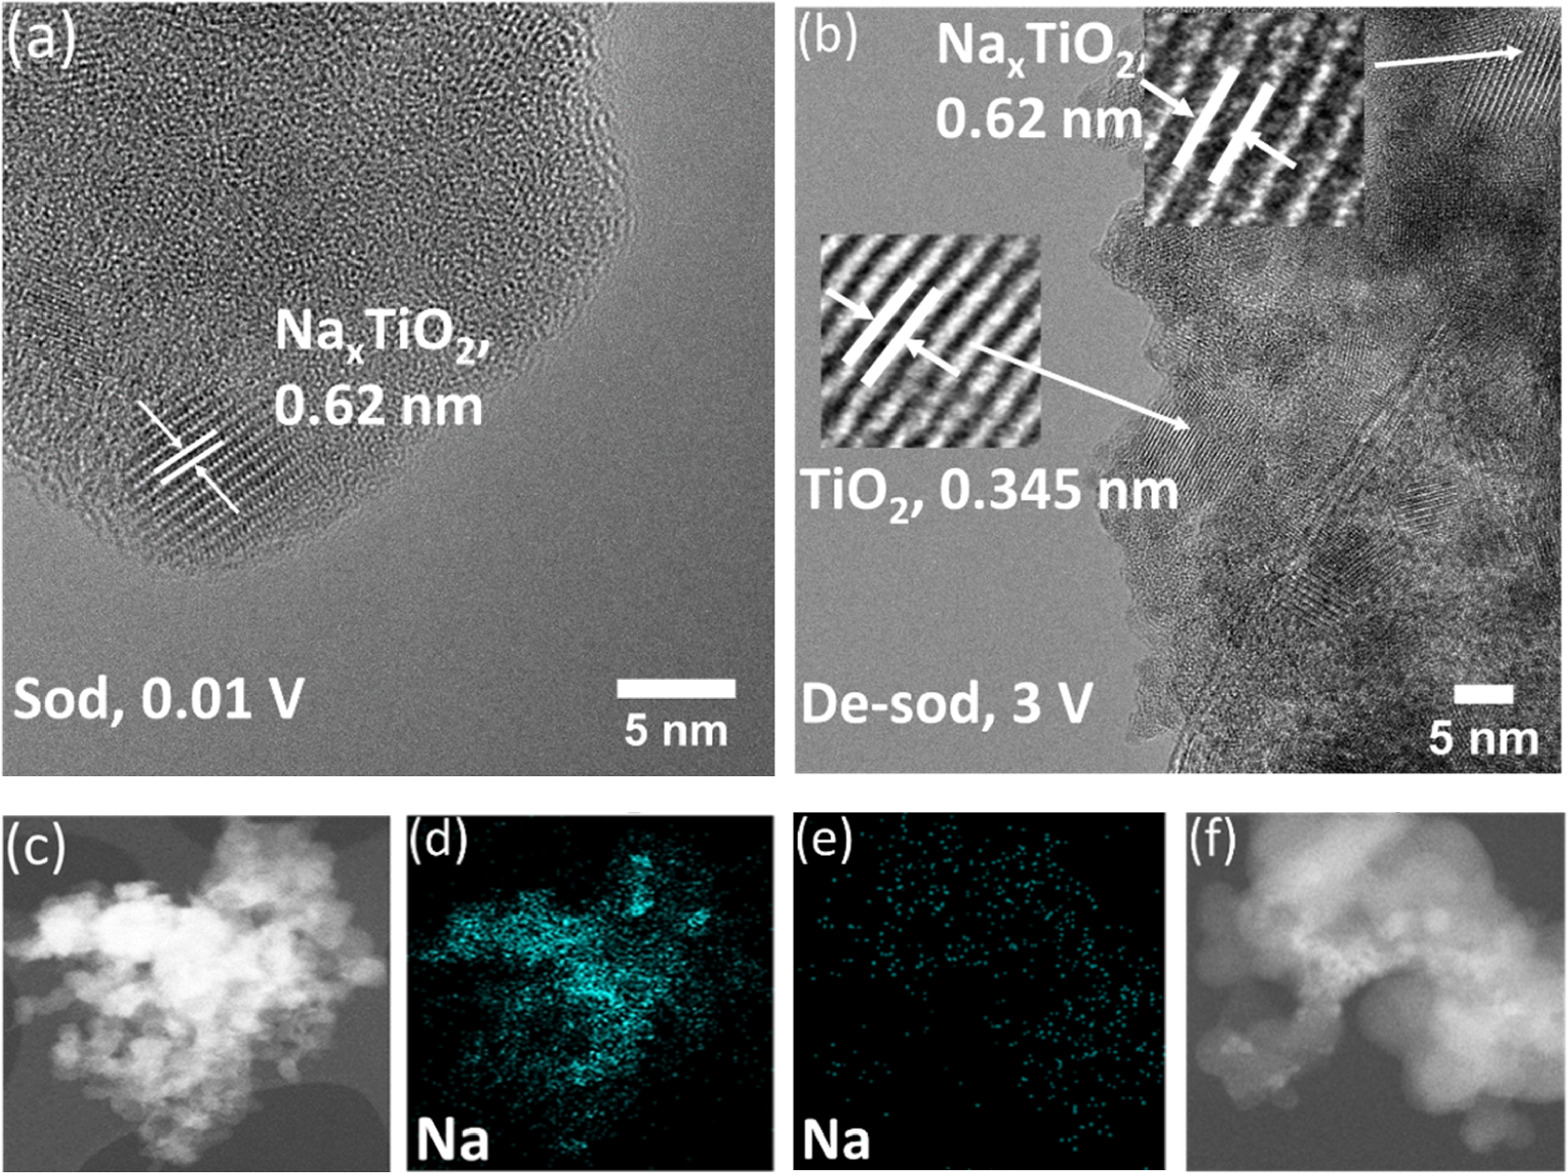
Figure 8. HRTEM images of (a) sodiated TiO2/Gr30 (0.01 V) and (b) de-sodiated TiO2/Gr30 (3 V) and the corresponding element mapping for the sodiated ((c) and (d)) and the de-sodiated composite ((e) and (f)).
Download figure:
Standard image High-resolution imageIn addition, to study the role of the new formed phase of Nax
TiO2 in enhancing the electronic conductivity of the anode material, impedance measurements were performed at the end of different cycles. We compared the charge transfer resistance (RCT) of TiO2/Gr30 before cycling and after the 1st and the 50th cycles (figure 9). The RCT before cycling was 69  decreases to 30
  after the first cycle, and to 17
  after 50 cycles. We attribute this to the formation of electronically conductive Nax
TiO2 leading to decreasing charge transfer resistances for further cycles [75].
after 50 cycles. We attribute this to the formation of electronically conductive Nax
TiO2 leading to decreasing charge transfer resistances for further cycles [75].

Figure 9. Impedance measurements of TiO2/Gr30 and fit of the spectra to the shown equivalent circuit to obtain the charge-transfer resistances before cycling and after cycle 1 and 50.
Download figure:
Standard image High-resolution imageIn addition to HRTEM analysis, ex situ XPS measurements were carried out to study the titanium oxidation state of the cycled electrodes at different charge/discharge conditions [69]. To this end, uncharged electrodes, electrodes sodiated to 1 and 0.01 V, and de-sodiated electrodes (3 V) were analyzed (figure 10).

Figure 10. XPS spectra at different discharge/charge of (a) pristine TiO2, and (b) TiO2/Gr30 electrodes.
Download figure:
Standard image High-resolution imageThe Ti 2P spectrum of the un-charged TiO2/Gr30 (figure 10(b)) shows two peaks at 458.5 and 464.2 eV which correspond to Ti+4 [71, 76]. After sodiation to 1 V, no obvious change in the spectrum was observed, suggesting that the main capacity of the composite up to 1 V was not obtained from the electrochemical reaction of TiO2 but from sodium ion storage at the surfaces and interfaces (figure 10(b)). With further sodiation (0.01 V), the binding energies of titanium for TiO2/Gr30 shifted to lower energy and a new peak appeared, which can be ascribed to the reduction of Ti+4 to Ti+3. After the electrode was de-sodiated to 3 V, the binding energies slightly shifted back to higher energies, but not to the original position of the un-charged electrode, which provides evidence of an incomplete re-oxidation of Ti+3 to Ti+4 after de-sodiation. This explains the reduced capacity after the first cycle. In contrast, pristine TiO2 showed a clear shift in the Ti4+ peak position when sodiated to 1 V and an additional peak around 454.5 eV appeared indicating Ti+3. De-sodiation to 3 V only led to an incomplete re-oxidation of Ti3+ to Ti4+, and the binding energy for the Ti4+ signal did not return to the original value either, so that the electrode still contained considerable amounts of Ti3+ after discharge, this also is in line with the significantly lower Coulomb efficiency compared to TiO2/Gr30. Overall, the sodium storage mechanism of the TiO2/Gr30 nanocomposites was established by both, TiO2 bulk and interface storage processes.
To further study the Na+ storage mechanism in both TiO2 and the TiO2/Gr30 nanocomposite, CV measurements were performed at different scan rates (0.1, 0.5, 1, 2, 5, and 10 mV s−1). Figures 11(a) and (b) show the results at scan rates of 2, 5, and 10 mV s−1, graphs for all scan rates are given in figure S10 in the supplementary material. As expected, with increasing scan rate, the anodic peak current increased and the signal slightly broadened. Owing to its higher capacity, the peak current of the TiO2/Gr30 nanocomposite was much higher than that of TiO2 which indicates better electrochemical reactivity [77, 78]. The relationship between scan rate υ and peak current I was utilized to study the kinetics of sodium ion intercalation/deintercalation using equations (2) and (3) [79]


Figures 11(a) and (b) represent the cyclic voltammetry data recorded at various sweep rates while the figures 11(c) and (d) provide insights into the relationship between the peak current and scan rate for pristine TiO2 and TiO2/Gr30, respectively. The b-values correspond to the slopes of the plots and are an indicator of sodium-ion storage mechanism in the structure. A b-value close to 0.5 indicates a diffusion-controlled electrochemical process, whereas a b-value close to unity refers to a capacitance-controlled surface mechanism [80, 81]. The b-values for TiO2 and TiO2/Gr were 0.65 and 0.81 indicating that both, diffusion and surface-controlled processes contribute to the sodium ion storage mechanism. Notably, in line with the XPS data, the b-value of TiO2/Gr30 is significantly higher, giving a clear indication that surface effects play a major role, which again underlines the synergistic functionality of the particle/graphene interface [20]. This underlines the superiority of the composite in terms of its electrochemical performance as an anode material for Na-ion batteries.

Figure 11. (a), and (b) Cyclic voltammetry measured at various sweep rates for pristine TiO2 and TiO2/Gr30 respectively. (c) and (d) indicate the relationship between peak current and scan rate for pristine TiO2 and TiO2/Gr30.
Download figure:
Standard image High-resolution image
7. Conclusions
In summary, we have established a new process for preparing TiO2/Gr nanocomposites. The advanced approach consists of gas-phase synthesis of both constituent nanomaterials followed by self-assembly towards functional nanocomposites with two different TiO2/graphene mass ratios. We benefit from the fact thatgas-phase synthesis,in contrast to the production of nanoparticles in the liquid phase, provides comparatively clean particles. Since no ligands or stabilizers are required, which otherwise can account for a considerable mass fraction, especially for the smallest particles due to their large surface-to-volume ratio. The particles produced can therefore be used directly as-synthesized without the need for further annealing steps, which is usually associated with particle growth.
We demonstrated the electrochemical performance of TiO2/Gr nanocomposites as anode materials in SIBs. The enhanced electrochemical performance of the TiO2/Gr composite compared to pristine TiO2 nanoparticles is due to several features. First, the strong synergistic effect between TiO2 nanoparticles and the graphene nanosheets due to the electrostatically induced self-assembly process, leading to outstanding electrochemical performance and excellent stability (96% after 500 cycles at 10 C). Second, the fast electron transport of TiO2 taking place with the help of the highly conductive graphene nanosheets. Third, nano-sized TiO2 enabling short diffusion paths for the Na ions. Thus, TiO2/Gr exhibits an excellent rate capability even at fast charge/discharge rates. Since—in addition to the storage of sodium in TiO2, a significant contribution to the storage capacity comes from the TiO2/Gr interface, the small TiO2 particle size is particularly advantageous. This study provides a new strategy for preparing promising anode materials for SIBs.
Acknowledgments
The authors thank Dr Ulrich Hagemann and Dr Markus Heidelmann from the Interdisciplinary Center for Analytics on the Nanoscale (ICAN), and Beate Endres and Sascha Apazeller (EMPI-RF) for XPS, TEM, BET, and TGA measurements. The authors acknowledge support from the Mercator Research Center Ruhr (MERCUR) within the DIMENSION project. AhmedK. Al-Kamal acknowledges the support of the German Academic Exchange Service (DAAD/ref. no. 91725972), the Max-Planck Institute for Chemical Energy Conversion (IMPRS-RECHARGE) program, and Mustansiriyah University.
Data availability statement
The data that support the findings of this study are available from the corresponding author upon reasonable request.
Supplementary data (0.6 MB PDF)
Supplementary data (0.6 MB DOCX)