
Abstract
We present a methodology for developing ultra-thin and strong formvar-based membranes with controlled morphologies. Formvar is a thin hydrophilic and oleophilic polymer inert to most chemicals and resistant to radiation. The formvar-based membranes are viable materials as support structures in micro- and macro-scale systems depending on thinness and porosity control. Tunable sub-micron thick porous membranes with 20%–65% porosity were synthesized by controlling the ratios of formvar, glycerol, and chloroform. This synthesis process does not require complex separation or handling methods and allows for the production of strong, thin, and porous formvar-based membranes. An expansive array of these membrane characterizations including chemical compatibility, mechanical responses, wettability, as well as the mathematical simulations as a function of porosity has been presented. The wide range of chemical compatibility allows for membrane applications in various environments, where other polymers would not be suitable. Our formvar-based membranes were found to have an elastic modulus of 7.8 GPa, a surface free energy of 50 mN m−1 and an average thickness of 125 nm. Stochastic model simulations indicate that formvar with the porosity of ∼50% is the optimal membrane formulation, allowing the most material transfer across the membrane while also withstanding the highest simulated pressure loadings before tearing. Development of novel, resilient and versatile membranes with controlled porosity offers a wide range of exciting applications in the fields of nanoscience, microfluidics, and MEMS.
Export citation and abstract BibTeX RIS

Original content from this work may be used under the terms of the Creative Commons Attribution 3.0 licence. Any further distribution of this work must maintain attribution to the author(s) and the title of the work, journal citation and DOI.
1. Introduction
Formvar has been widely used as both a support material for various nano- and micro-structures in applications such as transmission electron microscopy (TEM) grids and microfluidic systems [1, 2]. The formvar molecular structure or Poly(vinyl) formal (CAS# 9003-33-2) reported by Sigma-Aldrich is shown to be [C3H6O2]n with a reported density of 1.23 g ml−1. This polymer was found to be structurally stable at thickness of 50 nm, hydrophilic and oleophilic, inert to most acids and solvents, and can be made into porous structures [3]. Additionally, formvar was found to have exceptional radiation tolerance and possesses interesting chemical, thermal and electrical properties [4–7]. Microfiltration is a process based around the osmotic pressure differential of two fluids wetting to and separated by a filter. The pore size in microfiltration membranes can range from ∼0.05 to 10 μm [8]. An example of this functionality is seen in recent efforts to use semipermeable membranes to desalinate water in a lab-on-a-chip system [9]. Many of the current commercial systems use two relatively thick PTFE membranes one treated to be hydrophilic the other treated to be hydrophobic with 0.2 μm pore size. Other membranes in such devices often face the challenge of remaining structurally stable under high fluid pressures [10]. An ultra-strong and thin formvar membrane overcomes many of these challenges providing an adaptable support structure for thin filters in similar applications. Its flexible morphology also allows it to be transferred/placed onto a wide range of substrates including glass and ETFE.
Formvar-based membranes can be used to enhance a range of systems beyond microfluidic applications. Thin membranes provide a way to increase the size and scalability of current pressure sensing systems that utilize 2D materials [10]. Biological research into areas such as self-patterning membranes may be enhanced with the inclusion of inert, strong, and porous materials [11]. Recently there has been increased interest in the use of 2D materials as tunable membranes for gas purification [12]. The utilization of formvar-based membranes would facilitate the physical assembly of such systems [12]. Moreover, we have recently used these ultra-thin membranes to transfer large-area graphene sheets onto various substrates [13]. Because formvar can be easily dissolved in chloroform, it provides a cleaner and faster transfer compared to current existing polymer-assisted methods.
Herein we present thorough experimental and simulation studies to develop novel ultra-thin and mechanically strong formvar-based membranes with controlled porosities for nano- and micro-fluidic systems. We demonstrate new results of chemical compatability and wettability of formvar membranes. The formvar was produced using a previously reported method with alterations enabling porosity manipulation [14, 15]. Our technique allows for control over membrane characteristics governing selectivity, thus enabling flexibility in regards to its functionality. We discuss the effect of synthesis conditions on the membrane morphology and its mechanical properties by utilizing a range of characterization techniques including atomic force microscopy, drop shape analysis, Raman spectroscopy, and scanning electron microscopy. The membrane structural stability was also demonstrated via numerical simulations. The stochastic model characterizes the formvar membrane's performance in a pressure-driven loading scenario representative of those expected in nano- and micro-membrane applications, such as lab-on-a-chip devices or pressure sensors [16–18]. Our novel comprehensive experimental studies coupled with simulations models will contribute to the fundamental understanding of the membrane properties, opening up pathways for new groundbreaking technologies.
2. Methods
2.1. Membrane synthesis
Formvar resin (Poly(vinyl formal) CAS# 9003-33-2) used in the membrane synthesis was mixed with chloroform to form a solution with a ratio of 0.01 g ml−1, which was then further diluted to a 40% stock solution and balance chloroform to achieve the desired concentration. An amount of glycerol was added to the surface and then the solution was vigorously shaken for one minute, after which it was sonicated using a Sonics Vibracell CV18 sonic probe at a 40% amplitude. Clean glass slides were then dipped in the mixed solution and left to air dry for 12 h [19]. The glass slides were stored at a 60° incline to allow excess formvar to run off. After drying, the edges of the slides were scoured with a razor blade to facilitate separation. The slides were then exposed to water vapor at 105 °C for 30 s to separate the membrane from the glass. The glass slide was dipped into a dish of deionized water at a 35° angle to detach the membrane from the glass and float it on the surface [13]. The floating membrane was then transferred to the target substrate by placing the substrate above the membrane and pressing down to submerge both. The substrate and membrane system was then removed from the water and air dried for 6 h.
2.2. Microscopy
Formvar membranes were assessed using a Magellan3 400 Scanning Electron Microscope and an FEI Quanta Scanning Electron Microscope. The high magnification images were converted to binary images and analyzed using ImageJ software to determine area fraction of the pores for each sample [20]. The porosity was measured by comparing the black fraction to white fraction after manually converting them to a binary image such that the black regions corresponded to pores.
A Digital Instruments Enviroscope Atomic Force Microscope by Veeco was used to provide additional information on the structure and thickness of the membranes. Maps of the membrane were generated via Gwyddion program to confirm the information from SEM [21]. This program was used to generate detailed maps of the surface structure and provide thickness information. ImageJ binary processing was used to determine the porosity of the membranes.
2.3. Drop shape analysis
To determine efficacy in fluid applications, a Kruss DSA25 Drop Shape Analysis was used to assess changes in wettability and surface free energy of the different formvar membranes. A 2 µl drop of deionized water or diidomethane was placed onto the surface of the membrane, and the Kruss program determined wettability and surface free energy of the samples by analyzing the contact angle of each fluid on the membrane.
2.4. Short-term chemical compatibility
The range of formvar compatibility with other chemicals was obtained using an existing reported method for polymer compatibility [22]. Tributyl phosphate (99%), methanol, toluene, 6 M HCl, chloroform, glacial acetic acid, triethylamine (99.5%), decane, and kerosene were used. The formvar was fully immersed in the chemicals for 1 h and 15 min to ensure a practical minimum chemical resistance. Visual inspection was performed every 15 min to track any degradation of the films.
2.5. Raman spectroscopy
A graphene sheet was placed on the top of the membrane so that Raman spectroscopy could be used to further evaluate the condition of the formvar. A 532 nm Nd:YAG laser was used to generate the scattering to characterize graphene sheets.
2.6. Nanoindentation
The elastic modulus of the formvar was determined using a TI 950 TriboIndenter with a pyramidal diamond tip. The formvar used was a low porosity variety suspended over a 100 μm channel. A set of 40 indentations was made over various points along the channel.
3. Results and discussion
We focused on the effects of the synthesis parameters on the morphological properties of the formvar-based membranes. A set of thirteen different formulations was developed by altering the chemical ratios of formvar, chloroform, and glycerol, in addition to varying the sonication time. Formvar produced using this technique does not require complex separation methods as previously reported [23]. Table 1 highlights the specific ratios tested using the various characterization techniques. The results showed that porosity was most strongly affected by the ratio of chloroform to glycerol (chloroform:glycerol). This trend is highlighted in figure 1 showing porosity increases from 20% to 65% with changes in the glycerol concentration. It appears that longer sonication times and formvar to chloroform ratio tends to have a lesser effect on the porosity of the formvar membrane.
Table 1. Formvar formulations and subsequent compositions characterized along with resultant porosity.
| Formulation number | Formvar:chloroform ratio (g:ml) | Formvar:glycerol ratio (g:ml) | Chloroform:glycerol ratio (ml:ml) | Sonication time (s) | Average porosity (approximated) |
|---|---|---|---|---|---|
| 1 | 0.003 | 0.08 | 24 | 60 | 20% |
| 2 | 0.003 | 0.16 | 47 | 60 | 40% |
| 3 | 0.003 | 0.08 | 24 | 120 | 20% |
| 4 | 0.003 | 0.16 | 47 | 120 | 50% |
| 5 | 0.013 | 0.26 | 20 | 60 | 35% |
| 6 | 0.013 | 0.52 | 40 | 60 | 40% |
| 7 | 0.013 | 0.26 | 20 | 120 | 30% |
| 8 | 0.013 | 0.52 | 40 | 120 | No membrane formation |
| 9 | 0.003 | 0.20 | 59 | 120 | 65% |
| 10 | 0.003 | 0.17 | 50 | 120 | 40% |
| 11 | 0.003 | 0.15 | 44 | 120 | 35% |
| 12 | 0.013 | 0.67 | 51 | 120 | 65% |
| 13 | 0.013 | 0.45 | 35 | 120 | 30% |

Figure 1. Porosity of formvar membrane as a function of chloroform:glycerol ratio.
Download figure:
Standard image High-resolution imageTo generate a strong porous membrane, formulation 4 (in table 1) proved ideal. A high chloroform:glycerol ratio provides higher porosity and longer sonication seems to further contribute to this increase. The SEM images in figure 2 illustrate the porous structure of formvar-based membranes with tunable porosities, from a highly porous lacy to lower porosity holey material. While the lacy structures are often used as supports on commercial TEM grids, the holey structures—with smaller and more controllable pore sizes—have proven to be beneficial in filtration systems. Additional SEM images of the various formulations are included in the supporting information, which is available online at stacks.iop.org/NANO/29/215712/mmedia. Formvar-based membranes with zero porosity can be used to transfer 2D materials, such as graphene [13]. The binary images (figure 2(D)) generated by the SEM images were used in ImageJ to provide the porosity percentage included in table 1. Additionally, these images were used to quantify individual pore areas as well as edge-to-edge pore spacing for developing statistical distributions of membrane properties (table 2). Each porosity value presented in table 2 was calculated from a set of ∼250 measurements. Pore area measurements, which were fit to exponential distributions, included few large pores, many small pores, and edge-to-edge pore spacing values. These measurements were found to follow normal distributions. Figure 3 shows modeled distributions from table 2 overlaid with experimental measurements. These statistical characterizations are implemented to capture the stochastic nature of membranes in the modeling presented in section 4.

Figure 2. (A) SEM image of holey formvar structure taken from formulation 1. (B) SEM image of lacy formvar from formulation 4. (C) SEM image of holey formvar from formulation 7. (D) Binary conversion of C used for porosity calculations.
Download figure:
Standard image High-resolution imageTable 2. Pore size and spacing distributions of select formvar formulations.
| Pore area (μm2) | Pore spacing (μm) | ||||
|---|---|---|---|---|---|
| Formulation number | Approximate porosity | Average | Std. | Average | Std. |
| 1 | 20% | 1.085 | 1.948 | 1.689 | 0.514 |
| 2 | 40% | 2.316 | 2.598 | 2.040 | 0.603 |
| 4 | 50% | 1.381 | 1.755 | 1.303 | 0.412 |
| 7 | 30% | 2.006 | 3.137 | 1.839 | 0.573 |

Figure 3. Probability density functions of modeled pore area exponential distributions and pore spacing normal distributions compared with measurements from SEM images.
Download figure:
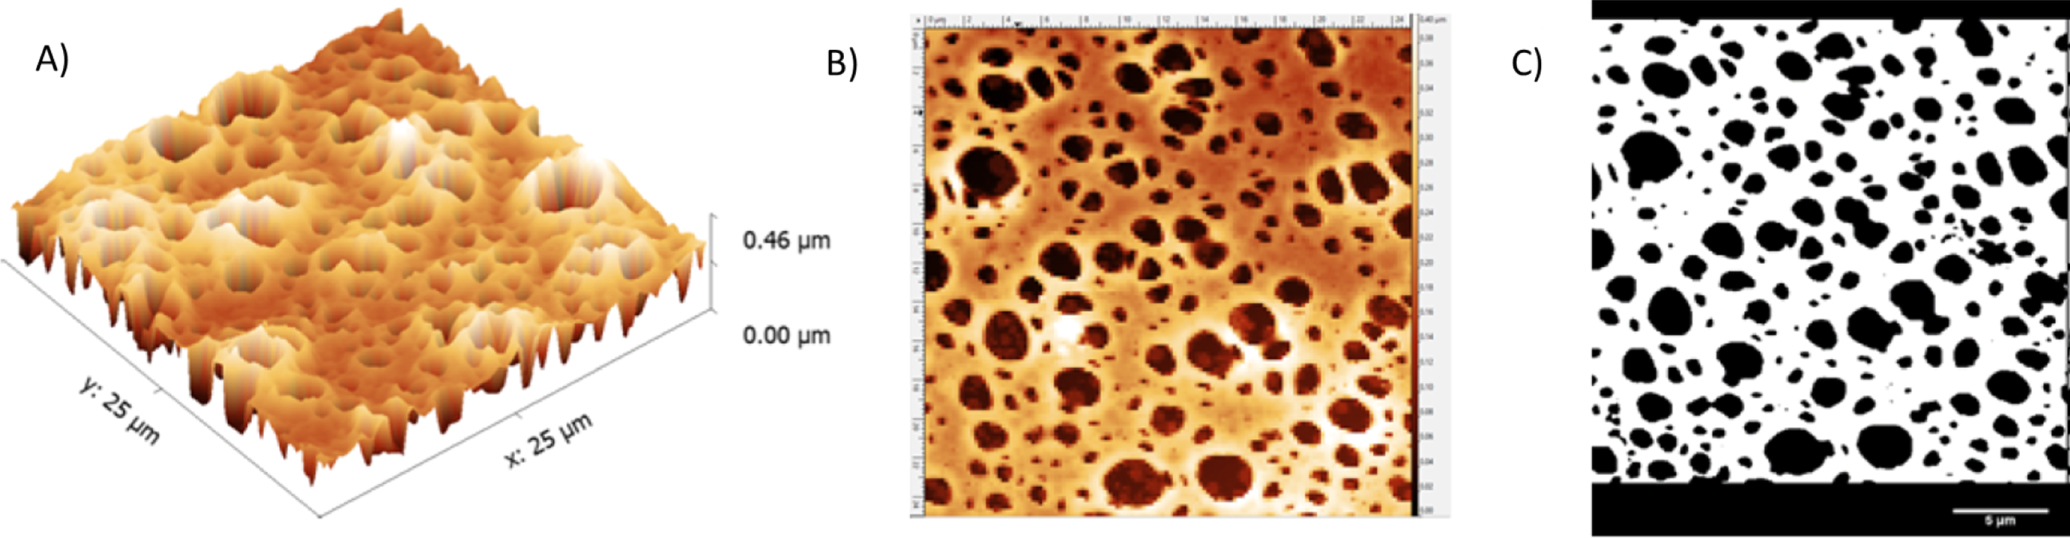
Standard image High-resolution imageThe 2D and 3D AFM images were used to determine surface roughness and porosity shown in figures 4(A)–(C). Line plots of areas across the surface allowed for comparison of roughness and textures between the different formulations. The samples with higher porosity have a lower surface roughness and a more level surface across the scanned areas. Membrane thickness, which plays an important role for a wide range of membrane-based applications, was found to average between 100 and 150 nm for all of the formulations.

Figure 4. AFM images of a high porosity holey formvar sample from formulation 4. (A) 3D render of the surface. (B) Heatmap indicating elevation data from AFM. (C) Binary image conversion of C for porosity measurements.
Download figure:
Standard image High-resolution imageThe surface energy and wettability measurements remained constant across the formvar formulations 4 and 7 and did not vary with the age of formvar up to at least two months. Table 3 shows the results of the testing, in which the surface was found to be moderately hydrophilic and oleophilic [24]. This indicates that the membrane wets well and can be viable in filtration and mass transfer apparatuses. Wettability of formvar membranes was found to be consistent and stable in aqueous and organic environments regardless of variations in production. This data was collected as both contact angle (figure 5(A)) and the information included in table 3.
Table 3. Results of contact angle measurements processed by Kruss DSA from multiple formulations of formvar.
| Diidomethane contact angle | Water contact angle | Surface free energy | Dispersive | Polar |
|---|---|---|---|---|
| 43.37° ± 1.6 | 63.34° ± 3.92 | 50.11 mN m−1 ± 2.95 | 39.04 mN m−1 ± 0.84 | 11.13 mN m−1 ± 2.12 |

Figure 5. (A) Contact angle results of analysis from formulation 1. (B) Before and after Raman spectra of graphene transferred on formvar membrane for compatibility testing. (C) Nanoindentation data of formvar from formulation 1 suspended over a channel.
Download figure:
Standard image High-resolution imageFor short-term chemical compatibility testing, large-area graphene sheet was transferred over the formvar structure. Graphene is an atomically thin carbon structure, which has a distinct and strong Raman scattering response, making it useful to detect deterioration of the formvar surface due to the chemical exposure. Figure 5(B) shows representative Raman spectra of a graphene/formvar sample, before and after a full immersion in triethylamine. The nature of the Raman bands (intensity and linewidth of D, G and 2D bands) of the graphene/formvar sample before and after the chemical exposure, did not significantly change indicating the unaffected nature of the graphene [25]. The latter demonstrates the structural integrity of the formvar was unaffected by the chemicals. If there were a dissolution of the formvar, the graphene would either be completely destroyed and produce no Raman response or significant changes in the D and G band ratio would occur. The chemical compatibility testing included: tributyl phosphate (99%), methanol, toluene, 6 M HCl, chloroform, glacial acetic acid, triethylamine (99.5%), decane, and kerosene. Formulations 1 and 4 were used to provide a range of porosity to highlight any effects that may have on the chemical resistance. Our studies revealed that only chloroform had a destructive effect, fully dissolving the formvar in a few minutes. High concentrations of HCl (above 6 M) had minor deleterious effects after an hour of exposure in bulk solution (see supporting information). However, microfluidic flow tests have been performed to accelerate and dramatize the effects (5–20 μl min−1) of 6 M HCl over the formvar and the HCl does in fact break down the formvar completely where exposed. This confirms the compatibility reported in the SDS from Sigma-Aldrich stating Formvar is not compatible with strong acids. Some of the chemicals used, such as kerosene, have been previously tested using different methodologies and our findings are in good agreement with previously reported ones [7].
To demonstrate the feasibility of formvar membrane applications in microfluidic systems, the membrane was suspended over a 100 μm channel and its elastic modulus was determined via nanoindentation. A diamond tip was pressed through the membrane and repeated 40 times over different areas of two samples with formulation 1. The low porosity was necessary to limit the amount of failed tests as the tip passed through pores. The elastic modulus of our formvar membrane was found to be 7.79 ± 0.94 GPa via nanoindentation, a value greater than twice that of other reported findings [26]. This elastic modulus value may vary with changes to the porosity and composition of the formvar. The plot in figure 5(C) shows an example of the output data from a series of indentations, at depths from 50 to 600 nm, on formvar membrane from formulation 1 suspended over a channel.
4. Modeling and simulation of membrane structural performance
Properties characterized by the experimental procedures discussed up to this point are combined in a numerical model to assess the formvar membrane behavior at an engineering scale. This model demonstrates the effects of the unique compositions on the structural behavior in a realistic system.
4.1. Stochastic pore model development
A stochastic membrane model was developed with COMSOL Multiphysics. The stochastic nature of the model captures randomness in the pore formulations by generating representative formvar samples drawn from the pore area and spacing distributions fit to SEM measurements (table 2 and figure 3). The thicknesses of all the formvar formulations are characterized by a normal distribution with a mean of 125 nm and standard deviation of 10 nm. 100 samples are drawn for each formulation with each sample having greater than 100 individual pores. As such, a complete suite of simulations for a given formulation involves more than 10 000 samples from the relevant statistical distributions. The stochastic nature of this model allows for the effects of inherent variability in the membrane synthesis to be evaluated. Understanding the effect of the natural pore variability on structural performance is critical for application of formvar as a support membrane in realistic, engineering-scale devices.
The model was leveraged to compare the unique formulations' structural performance in a pressurized microscale device. Performance of formvar formulations 1, 2, 4, and 7 are compared through simulation of a membrane sample spanning a circular opening with a 50 μm diameter loaded by a uniform pressure. These four formulations were selected due to their resulting porosities of 20%, 40%, 50%, and 30%, respectively. A uniform pressure loading is realistic for microscale systems, for example a microfluidic reactor where the membrane is exposed to flows in a channel with fluids of different densities on either side of the membrane. The membrane is fixed around the edges and a uniform pressure is applied, starting at 50 Pa and ramping to 400 Pa. The applied pressure causes tensile stresses in the membrane as loads are transferred to the clamped edges. The membrane does not carry bending stresses, due to the extremely small thickness to span ratio (0.0025). Young's modulus of the formvar is defined as 7.79 GPa, as determined by the nanoindentation measurements. Maximum von Mises stress is predicted for every porous sample of a formulation. Von Mises stress is selected for evaluation of membrane performance as an equivalent tensile stress accounting for tension in both in-plane directions.
4.2. Simulation results and discussion
Capturing the stochastic nature of the pore generation is critical for understanding the likelihood of a membrane formulation to maintain reliable performance for realistic fabrication of microscale devices. A membrane with relatively even-spaced pores allows for a more homogenous stress distribution as shown in figure 6(A). On the contrary figure 6(B) illustrates a membrane with large pores, some of which are closely spaced, resulting in high local stress concentrations as the tensile loads are forced to transfer across a small region. Stresses are higher near the edges of the membrane where tensile load is carried to the clamped support. Therefore, failure tends to occur in areas with small pore spacing between large pores, particularly close to the support edges.

Figure 6. Model predictions of 125 nm thick formvar membrane under 400 Pa loading sampled from (A) formulation 4 with uniform size and evenly distributed pores and even stress distribution (B) formulation 7 with large unevenly distributed pores and high stress concentrations.
Download figure:
Standard image High-resolution imageThe importance in these stochastic predictions of failure lies in understanding the reproducibility of formulations to be used in microfluidic reactors as well as applications in industry or otherwise. The membranes experimentally fail after increasing flow rate and undergoing larger than allowable stresses. Membranes have been found to succeed continuously and reproducibly during operation under lower flow rates where the fluid pressures do not cause exceedingly high stresses.
Figure 7 shows the variation in structural performance for the four formulations selected from table 2. The average behavior of the formulations is compared in figure 7(A) and the variability of the membrane behavior due to the irregularities of the pore size and spacing as well as thickness is shown in figure 7(B), where the dashed lines represent one standard deviation upper and lower bounds of the maximum stress prediction. Formulations 1 and 4 are found to have similar behavior with lower stress accumulation while formulations 2 and 7 are found to be less structurally stable and accumulate peak stresses at a faster rate. Membranes will begin to tear when the equivalent tensile stress exceeds the material's tensile strength. Therefore, formulations 1 and 4 are expected to withstand higher pressure loadings before failure than formulations 2 and 7.

Figure 7. (A) Average and (B) standard deviation of maximum von Mises stress predictions and relative (C) exponential distributions fit to pore area measurements and (D) normal distributions fit to pore spacing measurements of formulations 1, 2, 4, and 7 from table 2.
Download figure:
Standard image High-resolution image
Most significant in these findings is the link between the pore area and spacing distributions (figures 7(C) and (D)) and the membrane performance. Formulations 1 and 4 have area densities concentrated at lower areas (<1.5 μm2) compared to the densities of formulations 2 and 7 (>2.0 μm2). Pore spacing distributions of formulations 1 and 4 are also concentrated below those of formulations 2 and 7. An interesting observation is the similar structural performance of formulations 1 and 4, despite these two formulations having the greatest different in porosity at 20% and 50%, respectively. Formulation 4 was found to have both the highest pore density and relatively small pores, resulting in a highly porous membrane while maintaining the consistent and low magnitude stress accumulation with pressurized loadings.
5. Conclusion
A method of producing thin membranes with selective porosities for microfluidic systems has been presented. It was found that porosity was most strongly affected by the ratio of chloroform to glycerol. Sonication, while being the impetus for the porosity, does not seem to have significant control over the final structure. The hydrophilicity and oleophilicity is more fundamental to the formvar polymer and is independent of structural and compositional changes. Our extensive chemical compatibility studies present possible areas of applications for formvar-based membranes in various chemical environments. These membranes were additionally shown to have an elastic modulus of 7.8 GPa, a Surface Free Energy of 50 mN m−1 and an average thickness of 125 nm.
The feasibility of the membranes in operating conditions realistic to nano- and micro-devices has been demonstrated through numerical simulations. For most applications a strong, relatively high porosity membrane may be achieved via a formvar:chloroform ratio of 0.003 and a Formvar:Glycerol ratio of 0.16 with 120 s of sonication. Formulation 4 was found to have both the highest pore density by maintaining small and consistently spaced pores, resulting in the most consistent and low magnitude stress accumulation with pressurized loadings. Lastly, development of stochastic models, informed by the experimental membrane characterization, enables quantification of the natural variability in the formvar material as well as implications of this variability to desired applications.
Acknowledgments
The authors acknowledge financial support from the Laboratory Directed Research and Development (LDRD) program and the NNSA Plutonium Sustainment and Materials Recycle and Recovery Program. This work was performed, in part, at the Center for Integrated Nanotechnologies, an Office of Science User Facility operated for the US Department of Energy (DOE) Office of Science by Los Alamos National Laboratory (Contract DE-AC52-06NA25396) and Sandia National Laboratories (Contract DE-NA-0003525).