

Abstract
In the present work, multifunctional Ni0.5Zn0.5Fe2O4@albumen (NZF@Alb) and doxorubicin-loaded Ni0.5Zn0.5Fe2O4@albumen (NZF@Alb-Dox) core–shell nanoparticles have been prepared by a green and simple method using inexpensive chicken egg albumen and have been characterized for different physiochemical properties. The structural, morphological, thermal, and magnetic properties of the prepared nanoparticles have been investigated by an x-ray diffractometer, high-resolution transmission electron microscopy (HRTEM), field emission scanning electron microscopy, Fourier-transformed infrared, thermogravimetric analysis, and vibrating sample magnetometer techniques. Superparamagnetic Ni0.5Zn0.5Fe2O4 nanoparticles (NZF NPs) with the mean size ∼20 nm were coated with albumen matrix by an ultrasonication process. Inverse fast Fourier transform-assisted HRTEM micrographs and FTIR analysis revealed the coating of amorphous albumen on crystalline NZF NPs. NZF@Alb and NZF@Alb-Dox NPs have the mean size (D50) of ∼100 nm, good stability, and magnetic controllability. Magnetic measurements (field (H)-dependent magnetization (M)) show all samples to be super-paramagnetic in nature. Biocompatibilities of the NZF and NZF@Alb NPs were confirmed by in vitro 3-(4,5-dimethylthiazol-2-yl)-2,5-diphenyltetrazolium bromide (MTT) assay against RAW 264.7 cells. NZF@Alb NPs have been found to be more biocompatible than bare NZF. In Vitro Dox release behavior from NZF@Alb-Dox NPs has been studied at pH 7.4 and 5, and a sustained and pH-dependent drug release profile were observed. In vitro cytotoxicity or anticancer activity of the blank NZF@Alb NPs, free Dox, and NZF@Alb-Dox NPs against HeLa cells (cancer cell line) were also examined by MTT assay. The obtained results suggest that this scalable egg-albumen-based magnetic nanoformulation is suitable for targeted drug delivery applications. Thus, the present study could be extremely useful for the advancement of albumin-based nanocarrier design and development for biomedical applications such as targeted and controlled delivery of anticancer drugs.
Export citation and abstract BibTeX RIS
1. Introduction
Despite enormous research efforts towards developing anticancer drugs, cancer remains one of the deadliest of diseases [1]. Biomedical scientific communities have developed several types of molecular anticancer drugs to arrest cancer proliferation [2]. The efficacy of conventional molecular anticancer drugs (size <7 nm) presently being used in cancer treatment suffers from several limitations including rapid clearance (clearance through hepatic metabolism or renal clearance with a cutoff around 7 nm), lack of selectivity, toxicity toward normal cells, short blood circulation time, rapid metabolization in vivo, drug resistance, and poor water solubility. Promoting active drug accumulation in tumor tissues would minimize such issues and improve therapeutic outcomes [3]. Renal clearance can mostly be minimized by increasing the size of the drug molecule through conjugation to a carrier. Emergence of nanotechnology has helped researchers overcome these problems by enabling them to develop smarter nanocarriers for encapsulating and delivering anticancer drugs at targeted sites in the patient body. A primary aim of nanocarrier-based drug delivery system (NDDS) is to develop a platform that effectively reduces toxicity of drugs while retaining their pharmacological activity. NDDS offers solutions to almost all the above-mentioned limitations encountered by freely administered conventional molecular anticancer drugs and provides enhanced tumor cell death [4].
Various kinds of nanocarriers having different compositions, morphologies, structures, and sizes have been developed with the aim of improving the therapeutic efficacy and safety of anticancer drugs [5]. Materials to be chosen for nanocarrier development should be biocompatible, biodegradable, and hydrophilic in nature. The biological recognition mechanisms of our body treat conventional synthetic nanoparticles as foreign objects to the body and do not accept them, thereby hindering their access to the target. In recent years, due to excellent biocompatibility, low toxicity, and biodegradability, natural biopolymers such as proteins (collagen, gelatin, elastin, albumin, etc) have gained considerable favor over synthetic polymers in the development of nanocarriers. Combining biomolecules with synthetic nanoparticles has emerged to counteract the extraordinary ability of our body to recognize and clear foreign objects [6]. Biomolecule coatings also provide nanoparticles with many bioactive functions, such as the bypassing of different biological barriers [6]. Moreover, protein-based carriers have demonstrated biocompatibility, biodegradability, nontoxicity, prolonged circulatory half-life, low levels of reticuloendothelial system clearance, and improved pharmacokinetic properties [7–9].
Among different types of proteins, nontoxic, non-immunogenic, biocompatible, biodegradable, and water-soluble albumin proteins have been considered ideal materials for the fabrication of nanocarriers since the success of abraxane, paclitaxel-loaded HSA nanoparticles [10–12]. Albumin-based nanoparticles show high binding capacity with various drugs and targeting ligands, and are acceptable in the body without any serious side effects [13]. Nanoparticles prepared only from albumin (without targeting agent) show good anticancer activity [9] but lack in the tumor-targeting ability that minimizes drug accumulation at the tumor site. A few researchers have reported that accumulation of albumin in solid tumors makes it a potential carrier for site-targeted drug delivery [14, 15]. These nanocarriers may have shown promising results in preclinical models but the translation of ligand-recognition-based targeting into the clinic remains challenging [5].
Excellent targeting ability in nanocarriers can be achieved by incorporation of magnetic nanoparticles (MNPs) within the nanocarrier's matrix, and this is simpler than complicated ligand-based targeting. Unlike ligand-based targeting, magnetic tumor targeting is not dependent on type of specific receptors expressed on different tumor cells, which expands the scope of application of a single type of magnetic nanocarrier to a wide variety of tumors. Albumin protein coating on MNPs makes them more biocompatible, invisible to the immune system, hydrophilic, stable in biological fluids, and provide long circulation time, which are basic requirements for biomedical applications; hence, these coatings are used to fabricate magnetic albumin nanoparticles. Magnetic albumin nanoparticles have become particularly attractive due to their association with MNPs, which are excellent theragnostic materials capable of carrying imaging and therapeutic agents together for simultaneous diagnosis and treatment [16].
Protein-coated magnetic nanoparticles can be prepared by many methods, including simple adsorption, photonic immobilization, free-radical crosslinking, sonochemical method, and covalent immobilization [17–27]. To date, several types of magnetic protein nanoparticles have been reported, including Fe3O4/BSA-anticancerDextron-FA-Dox [19], Fe3O4-BSA [20–22], Fe3O4-SiO2-BSA [23], Fe3O4-chitosan-BSA [24], GEM-Fe3O4-BSA [16], Fe3O4-HSA [25, 26], MnFe2O4-BSA [27], Ni0.5Co0.5Fe2O4-BSA [28], Ni0.5Zn0.5Fe2O4-BSA [29] etc. However, most of these contain commercially available but expensive BSA or HSA due to their sequence and structural homology. The Kaplan group [30] and Ye Tian et al [4] have successfully prepared doxorubicin (Dox)-loaded Silk Fibroin nanoparticles (SFNs-Dox) and Fe3O4-SFNs-Dox, respectively, by a salting-out method; their main disadvantage is their complex and long preparation time [31, 32]. Ni0.5Zn0.5Fe2O4 nanoparticle (NZF NP) is a versatile MNP, as it shows soft magnetic behavior, superparamagnetic nature, high saturation magnetization, high Curie temperature, good chemical stability, low coercivity, and biodegradability. Al-Qubaisi et al have studied anticancer activity of NZF NPs and concluded that they have potential cytotoxicity or anticancer activity [33, 34]. Very recently, L H Nie et al have found that NZF NPs have great adsorbing ability for BSA, suggesting that NZF NPs are a potential BSA-carrier candidate [29]. These studies motivated us to use NZF NPs as the magnetic component to provide guidability and targetability to the nanocarrier.
Egg albumen, a water soluble and highly functional (–SH, –OH, –COOH, and –NH2) protein having good binding capacity with metal ions, can be of potential use in immobilizing drug molecules because of its biocompatible and hydrophilic nature and presence of different functional groups [35, 36]. In addition, egg albumen is less expensive and more easily metabolized in the human body than the commercially available but expensive BSA or HSA that have been proposed as potential nanocarrier or shell materials. Although it is available in abundance and economically viable, egg albumen has been relatively unexplored for biomedical applications [37]. Recently, some researchers have reported the potential of egg albumen for drug-delivery application but they did not address the targeting ability, which ultimately reduces the efficiency of the drug [38–40]. Egg-albumen-assisted coating of Zn0.95Ni0.05O on NZF NP and NZF@mSiO2 core–shell nanocarriers have been reported in our previous works [35, 41].
The pharmaceutical industry is turning towards green chemistry due to its profitable and environmentally superior nature [42]. In the present work, we combine the merits of superparamagnetic NZF and albumen nanoparticles together to fabricate multifunctional nanoparticles for a targeted and controlled drug-delivery application for cancer treatment. Ni0.5Zn0.5Fe2O4@Egg albumen (NZF@Alb) core–shell nanoparticles are prepared by a green and simple method, using inexpensive chicken egg albumen, and are characterized for different physiochemical properties using different techniques. Doxorubicin, as a model anticancer drug, is loaded in the albumen matrix of NZF@Alb to get NZF@Alb-Dox, and its release behavior is studied at pH 7.4 and 5. Biocompatibility of the NZF and NZF@Alb NP is confirmed by in vitro cytocompatibility assay against RAW 264.7 cells (normal cells). The in vitro anticancer activities of the blank NZF@Alb NPs, free Dox, and NZF@Alb-Dox NPs against HeLa cells is carried out by MTT assay.
2. Materials and methods
2.1. Reagent
All reagents used in this study were of analytical grade. Zinc nitrate (>98% Zn(NO3)2.6H2O), nickel nitrate (>98% Ni(NO3)2.6H2O), iron nitrate (>98% Fe(NO3)3.9H2O), doxorubicin hydrochloride (DOX, 98%), 3-(4,5-dimethylthiazol-2-yl)-2,5-diphenyltetrazolium bromide (MTT) from Sigma Aldrich and citric acid, ammonia, phosphate-buffered saline (PBS), citrate buffer, and dimethyl sulfoxide (DMSO) from SRL, India were used in this study without any purification. Egg white was obtained from fresh hen eggs available in the market.
2.2. Preparation of Ni0.5Zn0.5Fe2O4 nanoparticles
NZF NPs were prepared following our earlier reported gel-combustion method [35, 43, 44]. In a typical synthesis procedure, nickel nitrate, zinc nitrate, and iron nitrate with a molar ratio of 1:1:4 were magnetically stirred to dissolve in 100 ml of water. Citric acid was added to this nitrate precursor solution with citric acid: nitrate molar ratio of 1:1. The resultant sol was continuously stirred at 90 °C for 1 h to evaporate excess water and form a viscous gel; this gel was subjected to heating at 300 °C that resulted in a self-ignited combustion reaction. The obtained powder was grounded by mortar and pestle and calcined to get reddish brown NZF NPs.
2.3. Preparation of NZF@Alb and NZF@Alb-Dox nanoparticles
To prepare NZF@Alb NPs, the required quantity of prepared NZF NPs was dispersed in 8 ml of water by bath ultrasonication. 2 ml of freshly extracted egg albumen was added drop-wise to this dispersion with continuous ultrasonication. The obtained NZF and albumen mixture was further sonicated for 30 min and then subjected to magnetic stirring for 4 h. The resultant albumen-coated NZF NPs (NZF@Alb NPs) were magnetically separated and stored for characterization. Dox-loaded NZF@Alb NPs (NZF@Alb-Dox NPs) were obtained by in situ incorporation of doxorubicin in albumen matrix during NZF@Alb NPs formation. NZF@Alb-Dox NPs were prepared following a similar procedure to that for NZF@Alb NPs but with the extra addition of doxorubicin in starting the aqueous dispersion of the NZF NPs. The obtained NZF@Alb-Dox NPs were magnetically separated and rinsed twice with deionized (DI) water to remove excess physically adsorbed Dox on surface of the nanoparticles. Finally, NZF@Alb-Dox NPs were stored in darkness. Supernatant having unloaded free Dox was also collected and stored for further use.
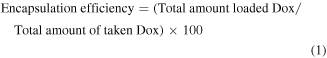
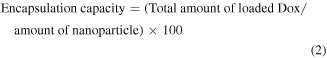
2.4. Encapsulation efficiency
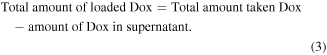
The amount of loaded Dox was quantified by subtracting the amount of free Dox in supernatant from the total Dox. A UV–vis spectrophotometer was used to determine the amount of unloaded free Dox present in the supernatant. The absorbance of the supernatant and pure Dox were measured at 480 nm (absorption maxima of Dox). A standard calibration curve of concentration versus absorbance was plotted for this purpose. Dox encapsulation efficiency (EE) and encapsulation capacity (EC) of nanoparticle were estimated from the following equations,
where
2.5. In vitro release study
In vitro release studies of Dox from NZF@Alb-Dox were carried out at 37 °C in two different buffers (citrate buffer and PBS) of pH 5 (mimicking cancer cell pH, especially for microenvironments in endosomes and lysosomes) [4] and pH 7.4 (mimicking blood plasma pH) [4] using dialysis bag diffusion method. In a typical procedure, 15 mg of NZF@Alb-Dox NPs in 0.5 ml buffer was placed in a dialysis bag (molecular weight cutoff of 14 kDa.) sealed from one end, and the other end of the bag was sealed. The dialysis bag with NZF@Alb-Dox NPs was then immersed in a 50 ml buffer solution (0.1 M) in a beaker and continuously stirred at 150 rpm and 37 °C. The dialysis bag acts as a donor compartment, and the beaker with buffer solution (release medium) acts as the receptor compartment. 3 ml aliquots were withdrawn from the release medium after the appropriate regular time interval, and equal amounts of fresh buffer were added to maintain the sink condition throughout the experiment. Each withdrawn sample was subjected to UV–vis spectrophotometry to monitor the amount of drug released. The concentration of the solution (release media) was determined by measuring the absorbance at 480 nm (λmax). Different mathematical models such as zero order, first order, Higuchi, and Korsmeyer–Peppas were used to fit the experimental release profile. To study the zero order, first order, Higuchi, and Korsmeyer–Peppas release kinetics, data obtained from in vitro drug release studies were plotted as cumulative amount of drug released versus time, log cumulative percentage of drug remaining versus time, cumulative percentage drug release versus square root of time, and log cumulative percentage drug release versus log time, respectively.
2.6. MTT assay
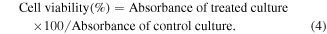
In order to elucidate biocompatibility of the NZF@Alb NPs, MTT Assay was performed. The in vitro cytocompatibility assay was carried out against RAW 264.7 cells. For checking the dose-dependent response, RAW 264.7 cells were incubated with different ranges of concentration varying from 50 to 1000 μg ml−1 of NZF@Alb NPs. In typical procedure, 100 μl media with RAW 264.7 cells was seeded onto the 96 well plates (∼5 × 10³ cells) and incubated in 5% CO2 atmosphere at 37 °C for 24 h. Then different concentrations of NZF@Alb NP suspension in media (50, 100, 200, 400, 800, and 1000 μg ml−1) were added to cells and further incubated for 24 h at 37 °C and 5% CO2. Then, 20 μl of MTT dye (5 mg ml−1 in 1X PBS) was added into each well and further incubated for 4 h. The media was carefully removed, and 100 μl of DMSO was added into each well. The plates were gently shaken for a few minutes to dissolve any formazan, and the absorbance was recorded at 570 nm with a microplate reader. Each experiment was conducted thrice in order to minimize experimental errors. Untreated cells in the medium were considered as control. Cell viability (%) was determined using the optical density at 570 nm relative to a control (untreated) value using the following equation:
The in vitro cytotoxicity of the plain NZF@Alb NPs, free Dox, and NZF@Alb-Dox NPs against HeLa cells was also carried out by MTT assay in the same way. Dose range of free Dox was chosen as 0.1, 1, 5, 10, 20, and 40 μg ml−1. For a better comparative study, and to get the same loaded Dox concentration (0.1, 1, 5, 10, 20, and 40 μg ml−1) the NZF@Alb-Dox dose range was fixed to 2, 20, 100, 200, 400, and 800 μg ml−1. In order to get contribution from NZF@Alb NPs to cell inhibition, the same dose as NZF@Alb-Dox was tested for NZF@Alb NPs.
2.7. Characterizations
The phase composition and crystalline structure of the NZF and NZF@Alb NPs were studied by x-ray diffractometer (XRD; Bruker D8 Advance) with θ–2θ geometry, using Cu Kα radiation in the 2θ range of 10° to 80°. The phase composition of NZF and NZF@Alb NPs was also studied by selected area electron diffraction (SAED) pattern. Particle sizes and morphologies of NZF, NZF@Alb, and NZF@Alb-Dox NPs were analyzed using transmission electron microscopy (FEI Tecnai T20G2 S TWIN TEM) and field emission scanning electron microscopy (Carl Zeiss Ultra 55 FESEM). A pinch of NPs was dispersed in 2 ml of DI water, a drop of this suspension was placed on a carbon-coated copper grid, and the grid was examined under TEM. For FESEM analysis, a pinch of powdered NPs was placed on the carbon tape pasted on the stub and coated with gold for 90 s to avoid any charging effect. The compositional analysis of the sample was carried out by energy-dispersive x-ray spectroscopy (EDS) performed by a Horiba Energy Dispersive x-ray microanalyzer attached to a Hitachi S-3400N scanning electron microscope. The structure and major functional groups present (NZF, albumen, NZF@Alb, and NZF@Alb-Dox NPs) were determined using Fourier-transformed infrared (FT-IR) spectroscopy. A PerkinElmer 2000 FT-IR spectrometer was used to obtain the FT-IR spectra from 400 to 4000 cm−1 by KBr pellet method. Thermogravimetric analysis (TGA) of NZF, albumen, NZF@Alb, and NZF@Alb-Dox NPs was performed by a Mettler Toledo TGA/SDTA 851e module under N2 atmosphere from 50 °C to 1000 °C at a heating rate of 10 °C/min. The magnetic properties of NZF and NZF@Alb NPs were studied using a Lakeshore (Model 7407) vibrating sample magnetometer (VSM) in magnetic fields up to 1.5 T at ambient temperature (298 K). Electronic absorption properties of NZF@Alb and NZF@Alb-Dox NPs were studied by PerkinElmer Lambda 35 UV–vis spectrophotometer. UV–vis studies were performed at room temperature in the range 200–800 nm. Hydrodynamic particle size distribution and Zeta potential measurements were carried out using Malvern Zetasizer.
3. Results and discussion
3.1. Preparation of NZF@Alb and NZF@Alb-Dox NPs
In the present work, superparamagnetic, multifunctional NZF@Alb and NZF@Alb-Dox NPs have been prepared by two-step processes for targeted and controlled delivery of anticancer drug. First, superparamagnetic NZF NPs were prepared by gel combustion method [35]. Then, using the prepared NZF NPs, Dox, and freshly extracted egg albumen, NZF@Alb-Dox NPs were prepared. NZF@Alb NPs were also prepared by the same procedure except for the addition of Dox. A schematic of the steps involved in the preparation of NZF@Alb-Dox and NZF@Alb NPs with plausible formation mechanisms are shown in figure 1. Egg albumen contains different types of proteins such as ∼60% ovalbumin, ∼12% ovotransferrin, and ∼11% ovomucoid [45]. These proteins have polar-COOH (hydrophilic) and nonpolar-alkyl (hydrophobic) groups. When NZF NPs are sonicated along with albumen, these polymeric proteins wrap the surface of NPs via hydrophobic or electrostatic interactions. A large number of negatively charged carboxylic groups present in albumen will bind with the positively charged surface metal ions to give a core–shell type albumen-coated NZF NP. Ovotransferrin is well known for its iron-binding property. Iron-binding capacity may also provide affinity toward iron of NZF NPs and help in deposition of ovotransferrin on the NZF NP surface, leading to formation of NZF@Alb NPs. Dox molecules have been loaded in albumen matrix via electrostatic interaction between positively charge amine groups of Dox and negatively charged carboxylic groups of albumen. The heating process can induce albumen denaturation and gelation, which can result in nucleation and precipitation of albumen on NZF NPs.
The various functional groups present in albumen are –SH, –OH, –COOH, and –NH2. The sulfhydryl groups in albumen form covalent disulfide (S–S) bonds at 70–80 °C, leading to irreversible gel formation [37]. Very high acoustic energy and heat generated during ultrasonication will cause gelation of albumins on the surface of NZF NPs and result in the formation of spherical particles (NZF@Alb NPs) via heterogeneous nucleation of albumen on the NZF NP surface [4, 46]. High-speed collisions between the albumen and NZF NPs during ultrasonication could also result in embedding of NZF NPs within the albumin matrix. Thus, the present method does not require any extra gelation agent for formation of albumin-based magnetic NPs. For preparation of NZF@Alb-Dox, positively charged Dox (pKa 8.3) and NZF NPs were dispersed in water, where part of the Dox was adsorbed on the surface of NZF NPs via electrostatic attractions, as NZF NPs have negatively charged carboxylate groups (citrate) on its surface [4]. The presence of citrate groups on the surface of NZF NPs was confirmed by FTIR and TGA analysis. Drop-wise addition of albumen, during ultrasonication, to the aforementioned mixture of NZF-Dox resulted in the formation of NZF@Alb-Dox. Negatively charged albumen (iso-electric point ∼5) will favorably be adsorbed on the surface of slightly positively charged NZF NPs due to partial decoration of Dox molecules and positively charged surface metal ions of NZF [45, 46]. Electrostatic and/or hydrophobic interaction among NZF, Dox, and albumen possibly played a major role in the formation of NZF@Alb-Dox. Negative surface charge of NZF@Alb (Zeta Potential ∼−23.3 mV) has facilitated loading of positively charged Dox molecules in albumen matrix. Prepared nanocomposites were found to be stable in aqueous media due to hydrophilic nature and electrostatic repulsive force between negatively charged coated albumen. Detailed physiochemical properties of NZF@Alb and NZF@Alb-Dox NPs are explained in the subsequent sections, and the characteristics of the particles analyzed by various techniques are summarized in table 1.

Figure 1. Schematic illustration of formation of NZF@Alb and NZF@Alb-Dox NPs. Dox is partly adsorbed on the surface of NZF NPs and then encapsulated in the albumen matrix during the gelation process. The diagram is not drawn to scale. pH-dependent Dox release behavior from NZF@Alb-Dox NPs is also illustrated.
Download figure:
Standard image High-resolution imageTable 1. Physical characteristics of NZF@Alb-Dox nanoformulation. The particle size (by DLS method) and zeta potential have been measured at pH 7.4.
| Sample | Particle Size by TEM (nm) | Hydrodynamic size by DLS (nm) | Zeta Potential (mV) | EC (%) | EE (%) | IC50 (HeLa cells) (μg ml−1) | Ms of NZF@Alb (emu gm−1) | Magnetic nature (NZF@Alb) |
|---|---|---|---|---|---|---|---|---|
| NZF@Alb-Dox | ∼100 | ∼169 | −15 | ∼5 | ∼90 | 20 | 36 | Superparamagnetic |
3.2. Structural and morphological analysis
The phase and crystalline structure of powdered albumen, NZF, and NZF@Alb NPs were evaluated by powder XRD using CuKα radiation (CuKα = 1.540 598 Å) at room temperature. Powder XRD patterns of Albumen, NZF, and NZF@Alb NZF NPs are shown in figure 2. NZF and NZF@Alb samples show diffraction peaks centered around 2Ѳ, 18.3°, 30.1°, 35.5°, 37.1°, 43.1°, 53.4°, 56.9°, 62.5°, and 73.9°, which can be assigned to reflections obtained from (111), (220), (311), (222), (400), (422), (511), (440), and (533) planes, respectively, of crystalline Ni0.5Zn0.5Fe2O4 NPs [35]. The observed diffraction patterns match with the characteristic diffraction patterns of the cubic spinel structure of Ni0.5Zn0.5Fe2O4 {space group: Fd3 m (227), JCPDS card no. 520278}. Presence of the characteristic diffraction peaks of cubic Ni0.5Zn0.5Fe2O4 phase structure in the XRD pattern of NZF@Alb NPs confirms that the structure of NZF nanocrystals does not change with albumen coating. In other words, the surface modification of NZF NPs with albumen and modification process does not adversely affect the crystal structure of the magnetic NZF phase [47]. NZF@Alb NPs shows similar XRD pattern except for the weaker intensities of the diffraction peaks compared to those of pure NZF NPs, which might be attributed to the coating of albumen shell on the surface of NZF NPs [20]. No diffraction peak of albumen was observed in the XRD pattern of NZF@Alb NPs, suggesting the amorphous nature of the albumen coating.
It is noteworthy to mention here that normally three main types of secondary structures of natural proteins are well distinguishable and those are α helix(crystalline), β sheet (crystalline), and disordered conformation random globules (amorphous) [31]. The XRD pattern of pure dried albumen shows the presence of a low-intensity broad hump in between 2Ѳ = 14° to 30° and centered at ∼23°, which suggests its nearly amorphous or very poorly ordered nature (due to the presence of few α helix and β sheet form). This broad peak, having d spacing of 3.8 Å (at 23°), could be assigned to the semicrystalline protein (d spacing ∼3.5 Å) [27, 31]. The broad hump at 23°, which was observed in the XRD pattern of dried albumen powder, is not observed in the case of NZF@Alb NPs. This low-intensity hump may have been relatively suppressed in the presence of high-intensity peaks of well crystalline NZF NPs. High sonication energy, continuous stirring, and incorporation of NZF in albumen matrix during preparation of NZF@Alb NPs may have reoriented ordered protein macromolecular chains and thus distorted the ordering (α helix and β sheet form) of protein molecules, resulting in the loss of crystallinity (amorphous disordered conformation of random globules). No impurity peak is detected in the XRD patterns of both samples. The average crystallite size of NZF NPs was estimated from the full width at half maximum of the corresponding diffraction peak using the Debye–Scherrer equation, D = 0.9k/βcos Ѳ, where k is the wavelength of x-ray (Cu Kα = 1.540 598 Å), β is the broadening of the diffraction line measured at half of its maximum intensity in radians, and Ѳ is the Bragg's diffraction angle. The average crystallite size of NZF NPs in pure phase and in nanocomposites was found to be ∼21 nm. Lattice constant of NZF NPs, estimated from the Powder Xray software, was found to be ∼8.4 Å. Similar XRD patterns for BSA-Fe3O4 nanocomposites have been reported earlier [19, 20].

Figure 2. XRD patterns of powdered albumen, Ni0.5Zn0.5Fe2O4, and NZF@Alb nanoparticles.
Download figure:
Standard image High-resolution imageParticle size and morphology of NZF and NZF@Alb NPs have been studied using FESEM and TEM. The FESEM images of NZF (a) and NZF@Alb (c) with corresponding EDS spectra (b and d) are shown in figure 3. It has been observed from FESEM images that NZF NPs are nearly spherical in shape, with mean particle sizes ∼22 nm. The particle sizes of NZF NPs have a Gaussian distribution and are shown in the insets of figure 3(a). Particles having spherical morphology and relatively bigger in size than pure NZF NPs have been observed from the FESEM image of NZF@Alb NPs, as shown in figure 3(c). The bigger particle sizes of NZF@Alb NPs compared to those of pure NZF NPs could be due to the coating of albumen around the surface of NZF NPs. In case of nanocomposite, two ranges of particles sizes were observed, i.e. smaller one from 35–50 nm and bigger one from 100–150 nm. It can be observed from the FESEM image that these bigger NZF@Alb NPs are formed by the aggregation of many smaller NZF@Alb NPs. However, the observed aggregate particles sizes do not exceed the useful range for biomedical applications. The EDS spectra of NZF NPs (figure 3(b)) show only the presence of Fe, Ni, Zn, and O in stoichiometric ratio, without any impurity peak, confirming the purity of the phases. Appearance of all elements of NZF with a few additional elements such as carbon and calcium, etc, in EDS spectra of NZF@Alb NPs confirm the formation of nanocomposite. It is noteworthy to mention that egg albumen contains different types of biologically useful and important minerals, and outer egg shell is made up of calcium carbonate.

Figure 3. FESEM micrographs of NZF (a) and NZF@Alb (c) nanoparticles with corresponding EDS spectra (b), (d). Inset of Fig (a) shows particle size distribution histogram of NZF nanoparticles.
Download figure:
Standard image High-resolution imageParticle size of NZF NPs and coating of NZF NP with albumen was further confirmed by TEM and high-resolution transmission electron microscopy (HRTEM) analysis. Figure 4(a) shows TEM image of pure NZF NPs with corresponding particle size distribution. From the TEM micrograph, the average size of NZF NPs was estimated to be ∼20 nm and the shape of the NPs was observed to be spherical (figure 4(a)). The value obtained is in good agreement with size obtained from FESEM and XRD, indicating that the nanoparticles consist of a single crystallite. TEM micrographs of NZF@Alb NPs are shown in figures 4(b) (at relatively low magnification) and (c) (at high magnification). Coating of albumen (grey color) on NZF NPs (black) is clearly visible in these low- and high-magnification TEM micrographs of NZF@Alb NPs. Average particle size of NZF and NZF@Alb NPs are found to be ∼22 and ∼100 nm, respectively. Thickness of albumen coating is found to be in the range of 10–15 nm. HRTEM images of two different NZF@Alb NPs are shown in figures 4(d) and (e). HRTEM of core region of NZF@Alb NPs shows presence of highly ordered atomic plane whose d spacing matches well with that of crystalline NZF, thus confirming the NZF core. The shell region does not show any ordered arrangement of atoms, indicating the amorphous nature of coated albumen (figure 4(e)). For better clarity and understanding, inverse fast Fourier Transformation (IFFT) of HRTEM image of selected core region (figures 4(d) and (e)) has been carried out and the obtained IFFT images are shown in inset of figures 4(d) and (e). The IFFT image in the inset of figure 4(d) clearly shows the presence of well-ordered atoms and atomic planes with d spacing of 0.29 nm that can be assigned to the (220) plane of NZF [35]. The IFFT image in the inset of figure 4(e) also shows the presence of well-ordered atomic planes with d spacing of 0.48 nm that can be assigned to the (111) plane of NZF. d-spacing was obtained by line profile method, and a line profile graph of the IFFT image of figure 4(e) is shown in figure 4(h). Thus, from TEM and HRTEM analysis, it can be concluded that crystalline NZF NPs are well coated with an amorphous albumen layer. Figures 4(f) and (g) shows the indexed SAED patterns of NZF and NZF@Alb NPs, respectively. The SAED patterns of both NZF and NZF@Alb NPs show a distinct dotted ring pattern, which confirm the polycrystalline nature of both the samples. The obtained SAED patterns were indexed for cubic system by estimating the d-spacing from the ring pattern and compared with the standard value. Appearance of ring patterns of NZF in the SAED pattern of NZF@Alb NPs confirmed the formation of nanocomposite. It can also be concluded that the coating process and coating of albumen on the surface of NZF NPs does not change the crystalline nature of the magnetic NZF component.
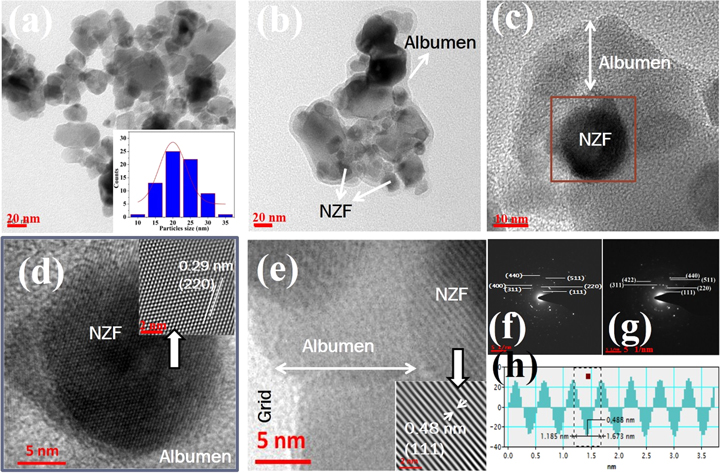
Figure 4. TEM images of NZF (a) and NZF@Alb (b), (c) nanoparticles. Inset of (a) shows particle size distribution histogram of NZF nanoparticles. HRTEM images of two different NZF@Alb NP with corresponding IFFT images (inset) of core region are shown in (d) and (e). Indexed SAED pattern of NZF and NZF@Alb nanoparticles are shown in (f) and (g), respectively. Line profile graph through atomic planes in IFFT image (inset of (e)) is shown in figure (h).
Download figure:
Standard image High-resolution imageTEM analysis of NZF@Alb-Dox NPs also has been carried out, and TEM micrographs at different magnifications are shown in figures 5(a)–(d). It was observed that many smaller NZF NPs aggregated within the albumen matrix to form spherical morphology of size ∼100 nm. Similar to the NZF@Alb NPs, coating of albumen (grey color) on NZF NPs (black) is also very clearly seen in the TEM micrographs of NZF@Alb-Dox NPs. Thickness of albumen coating was found to be ∼12–17 nm. Figure 5(e) shows the HRTEM image of the red framed square region of figure 5(d) and (f) shows the HRTEM image of another NZF@Alb-Dox NP. Coating of amorphous albumen on crystalline NZF NPs can very clearly be seen in HRTEM images (figures 5(e)–(f)). IFFT image (inset of figure 5(e) of core region, indicated by arrow) shows presence of highly ordered lattice plane with the d-spacing of 0.48 nm ((111) plane of NZF), confirming that core particles are NZF NPs. For better clarity and understanding of the amorphous coating on crystalline core, the IFFT of two regions, crystalline core and both core and shell region, has been carried out and the results are shown in figures 5(g) and (h), respectively. These two regions are selected from figure 5(f) and marked with green and yellow squares, respectively. The appearance of only highly ordered atomic planes in figure 5(g) and highly ordered atomic planes with relatively blurry regions in figure 5(h) confirm that crystalline NZF NPs are coated with amorphous albumen. d-spacing of these atomic planes is found to be 0.244 nm, which corresponds to the (311) plane of cubic NZF NPs. These observations are consistent with XRD results, which also indicated presence of amorphous albumen in NZF@Alb NPs. Similar TEM results for BSA-coated MNPs were earlier reported by researchers [19, 48]. Interestingly, both the NZF@Alb and NZF@Alb-Dox NPs synthesized in this investigation not only display simple core–shell morphology but also show a rich interaction and good contact between the protein and magnetic nanoparticles.
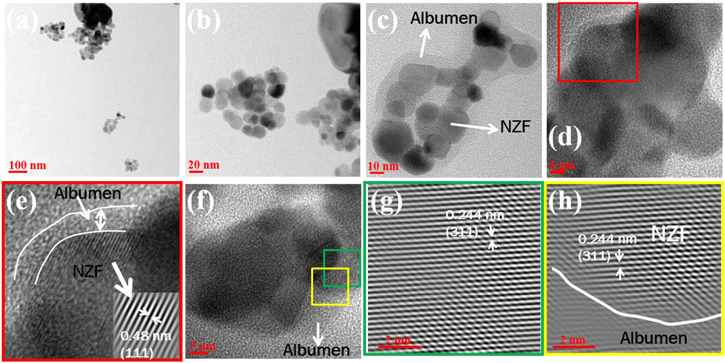
Figure 5. TEM micrographs of NZF@Alb-Dox nanoparticles at 100 nm (a), 20 nm (b), 10 nm (c), and 5 nm (d). HRTEM image of the red-framed square in (d) to show lattice fringes of crystalline NZF NPs as shown in (e). IFFT from the core region indicated by arrow in (e) is shown in the inset of (e). HRTEM image of other NZF@Alb-Dox nanoparticles is shown in (f). (g) and (h) show IFFT images of green- and yellow-framed squares, respectively, in (f).
Download figure:
Standard image High-resolution image3.3. Thermal analysis
To confirm the albumen coating on NZF NPs, to quantify the weight percent of NZF and albumen in nanocomposite, and to investigate the thermal stability of the prepared nanosystems, thermal analyses were carried out. TGA and DTG of albumen, NZF, and NZF@Alb NPs are shown in figures 6(a) and (b), respectively. Appearance of degradation patterns in TGA and DTG curves of NZF@Alb similar to that of pure albumen confirms the presence of albumen in NZF@Alb NPs. For better understanding of TGA curve, the temperature range has been divided into three ranges, i.e. 50–150, 150–500, and 500 °C–950 °C. In the first range (50 °C–150 °C) all the samples show ∼3%–6% weight loss, which can be attributed to the loss of physically adsorbed water on the surface of nanoparticles. In the second range (150 °C–500 °C) major weight losses were observed in all samples, attributable to the loss of organic citrate and albumen from NZF and NZF@Alb NPs, respectively [20]. In this range, about 35% and 63.3% weight losses were observed for NZF@Alb and pure albumen, respectively. In the third range (500 °C–950 °C) relatively lower weight loss than the second range has been observed, and this may be attributed to the loss of higher-molecular-weight organic species and decomposition of carbonates such as calcium carbonate [20]. It was assumed that available calcium in albumen would have formed calcium carbonate in the presence of evolved CO2 during the burning of organic matrix. The presence of calcium in egg albumen was also observed in EDS analysis. In the last range, ∼17% and 27% weight losses were observed for NZF@Alb and pure albumen, respectively. Total weight losses for NZF, NZF@Alb, and pure albumen were found to be 11.8%, 58%, and 97.3%, respectively. Weight % of albumen in NZF@Alb NPs was estimated to be ∼40%. Thus, prepared NZF@Alb NPs were found to be thermally stable until 250 °C, with slight weight loss due to physically adsorbed water molecules. DTG curves of NZF@Alb NPs and pure albumen show almost similar behavior, with one major peak centered at 300 °C (figure 6(b)). This peak can be assigned to the loss of organic albumen [21]. Two more peaks with relatively smaller intensities also have been observed in DTG curves of both NZF@Alb and pure albumen. Peaks centered at 65 °C can be assigned to loss of water molecules and other peaks which appeared above 700 °C (at 825 °C for pure albumen and at 720 °C for NZF@Alb) can be due to the loss of higher-molecular-weight organic species or decomposition of carbonates [49]. The peaks at around 300 and 825 °C in pure albumen have slightly shifted to lower temperatures at 290 °C and 720 °C, respectively for NZF@Alb NPs. This shifting could be due to the presence of NZF NPs, which could have catalyzed the thermal decomposition process, resulting in decomposition at relatively lower temperature.

Figure 6. TGA (a) and DTG (b) curves of albumen, NZF, and NZF@Alb nanoparticles.
Download figure:
Standard image High-resolution image3.4. Magnetic properties
The field-dependent magnetic behaviors of NZF and NZF@Alb NPs are shown in figure 7. Various magnetic properties including saturation magnetization (Ms), remanent magnetization (MR), and coercivity (Hc) have been obtained from the M–H curve. The saturation magnetization (Ms) value of magnetic material determines its response towards the external magnetic field. The Ms values for NZF and NZF@Alb NPs were found to be 56 and 36 emu gm−1, respectively. Relatively lower content of NZF in NZF@Alb than the pure NZF sample is the reason for the observed smaller Ms value for NZF@Alb than NZF NPs. Obtained Ms value (36 emu gm−1) of NZF@Alb NPs is sufficient for magnetically guided drug delivery applications. Both the samples were found to be superparamagnetic in nature, with very low remanent magnetization and coercivity. The superparamagnetic nature of the prepared samples is due to very small and single-domain (magnetic) equivalent particle size of NZF NPs (22 nm). TEM and XRD results have shown that prepared NZF NPs were made up of single crystal. When the size of magnetic particles comes down to single-domain (magnetic) size, then thermal vibration surpasses the energy barrier for its spin reversal, leading to superparamagnetic behavior [35]. Remanent magnetizations of NZF and NZF@Alb NPs are found to be 1.35 and 3.70 emu gm−1, respectively. The coercivity values are 36 and 77 Oe for NZF and NZF@Alb NPs, respectively. The slight increase in coercivity for the NZF@Alb NPs could be attributed to domain wall pining by the non-magnetic albumen. Magnetic controllability of NZF@Alb NPs has also been demonstrated and shown as a digital image in the inset of figure 7. It was observed that NZF@Alb NPs can be easily magnetically controlled by applying an external magnetic field. Comparative aqueous dispersibility and stability of NZF and NZF@Alb NPs have been demonstrated in our earlier study, and it was observed that NZF@Alb NPs have better dispersibility and stability than bare NZF NPs in water [35]. Polymeric albumen proteins wrap the surface of nanoparticles and the hydrophilic parts of the protein interact with water, giving rise to stability of the suspension. Improved steric and electrostatic forces between the NZF@Alb NPs could also be the reason for the improved stability of NZF@Alb NP suspension.
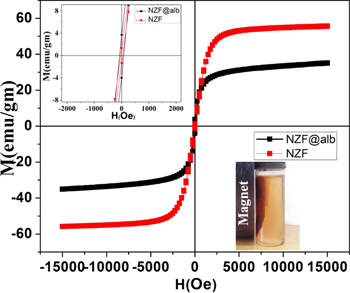
Figure 7. Room temperature (M-H) curves of NZF and NZF@Alb nanoparticles. Inset figure in second quadrant shows enlarged M-H curves. Inset digital photograph in the fourth quadrant shows magnetic controllability of aqueous NZF@Alb NPs.
Download figure:
Standard image High-resolution image3.5. FTIR analysis
In order to investigate the chemical structure of NZF@Alb-Dox NPs and to investigate available functional groups, FTIR analysis was carried out. FTIR results were also used to support the coating of albumen on NZF NPs and loading of Dox in NZF@Alb-Dox. FT-IR spectra of NZF, Albumen, NZF@Alb, and NZF@Alb-Dox NPs are shown in figure 8(a). The IR spectra of NZF NPs shows two principle absorption bands in the wavelength range 400–600 cm−1; the first band is around 416 cm−1 and the second is around 564 cm−1. These two vibration bands can be attributed to the intrinsic lattice vibrations of octahedral and tetrahedral coordination complexes, respectively, in the spinel structure [35]. Two additional bands at 1631 and 1418 cm−1 may be due to the undecomposed citrate on the surface of NZF NPs and could be assigned to the stretching and bending vibration of C=O and C−O, respectively. The characteristic absorption bands of albumen at 1642 (and 1660) and 1548 cm−1 were attributed to the Amide I and Amide II bonds of protein molecules and originated from −C=O stretching vibration and –N–H bending vibration, respectively, coupled with C-N stretching [20, 37]. Absorption bands of albumen at 1600–1700 cm−1 (1642 and 1660 cm−1) are directly related to the protein backbone conformations and have been used for studying protein secondary structures [4]. Appearance of bands of the same intensities at 1660 and 1642 cm−1 indicated the equal presence of α helix (crystalline) and random (amorphous) secondary structure in dried albumen sample (inset of figure 8(a)) [50]. The XRD pattern of the dried albumen powder also suggests the partial crystalline nature of the sample. The spectra of pure albumen showed many other important peaks, at 3375 and 3074 cm−1 due to -OH stretching vibration with contribution from –NH stretching of the secondary amide, at 2929 and 2963 cm−1 due to –CH stretching, at 2877 cm−1 due to –SH stretching, at 1400 cm−1 due to carboxylate C−O bending vibration, at 1450 cm−1 due to amine III, at 1242 cm−1 due to C−O−H stretching, at 1160 cm−1 due to C−N stretching, and at 1076 cm−1 due to C−O stretching vibration [37, 39, 51]. A peak due to plane wagging was observed at 644 cm−1 and it can be assigned to the out-of-plane N-H bending [27]. In the IR spectra of NZF@Alb and NZF@Alb-Dox NPs, nearly all absorption bands of albumen and NZF have been observed. The simultaneous appearance of characteristic bands of both albumen (1000–1700 cm−1) and NZF (400–600 cm−1) in FTIR spectra of NZF@Alb confirmed successful formation of the nanocomposite. In the case of NZF@Alb NPs, appearance of only one band at 1638 cm−1 and disappearance of a band of crystalline α helix at 1660 cm−1 suggested increased randomness and irregular structures of coated albumen (inset of figure 8(a)). This phenomenon can be attributed to the electrostatic interaction of albumen with the nanoparticles, and high ultrasonication energy could have caused reorientation of the albumen chains. The HRTEM and XRD pattern of the NZF@Alb nanocomposite also suggested the amorphous nature of coated albumen. A relatively lower fraction of crystalline β-sheet in BSA in the Fe3O4/BSA nanocomposite has also been observed by Tian et al using FTIR [4]. In the IR spectra of NZF@Alb-Dox, the nanocomposite main band of Dox (1640 cm−1, C=O) overlaps with the main band of albumen (1642 cm−1), resulting in a relatively intense and broader band [52]. Figure 8(b) shows the absorption bands of NZF@Alb and NZF@Alb-Dox NPs with a normalized intensity between 900–1700 cm−1. Increase in intensity, broadening of bands between 1000–1700 cm−1, and appearance of new bands of Dox at 1286 cm−1 (skeleton vibration of Dox), 1197 cm−1 (asymmetric stretching of C−O−C), and 994 cm−1 (stretching vibration of C−O) confirmed Dox loading in NZF@Alb-Dox (figure 8(b)) [53]. The N–H wag bands of pure Dox, which normally appear at 870 and 805 cm−1 [54], diminished in the FTIR spectrum of NZF@Alb-Dox. From this FTIR result, it can be inferred that attachment of DOX to the NZF@Alb NPs occurs via the interaction of –NH2 of DOX with the –COOH groups of albumen.
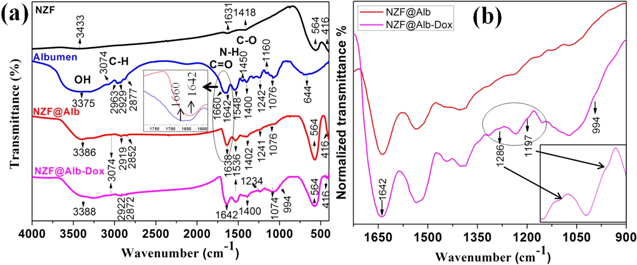
Figure 8. (a) FTIR spectra of NZF, albumen, NZF@Alb, and NZF@Alb-Dox nanoparticles. Inset of figure (a) shows enlarged spectra of the 1600–1750 bands of albumen and NZF@Alb. (b) FTIR spectra of NZF@Alb and NZF@Alb-Dox nanocomposite between wavenumbers 900–1700 cm−1. Inset of figure (b) shows enlarged spectra of the circled region.
Download figure:
Standard image High-resolution image3.6. Doxorubicin (Dox) loading study
Due to the good anticancer activity of clinically accepted Dox, their loading and release behaviors have widely been studied in vitro and in vivo [4, 19]. Herein, Dox was chosen to load in NZF@Alb NPs due to such suitable and favorable properties such as excellent anticancer activity against variety of cancer cells, clinical acceptance, opposite charge (positive at pH ∼7.4, pKa value 8.3) to that of albumen carrier (negative at pH ∼ 7.4, Zeta Potential ∼−23.3 mV, isoelectric point of albumen ∼5), and hydrophilic nature (doxorubicin hydrochloride) etc [4, 19]. The hydrophilic nature of Dox could ensure its good miscibility in hydrophilic albumen matrix, which is expected to lead to good compatibility of Dox with albumen nanocarrier. Albumin proteins have been proven to be a suitable and compatible carrier for Dox, and several research studies using albumin as Dox's carrier have successfully been conducted [7–9, 13, 19, 36, 55, 56]. The encouraging results of these studies show compatibility of Dox with albumin carriers and also motivated us to use Dox as an anticancer agent to be loaded in NZF@Alb NPs.
In this work, Dox-loaded NZF@Alb NPs (NZF@Alb-Dox NP) were obtained by the in situ incorporation method, where the drug is loaded at the time of preparation of the nanocarriers. UV–vis absorption spectra of total Dox and free Dox remaining in the supernatant are shown in figure 9(a). Almost complete suppression of the Dox peak (∼480 nm) in the UV–vis absorption spectra of supernatant suggested that most of the Dox molecules have been loaded in the nanocarrier. Electrostatic interaction between negatively charged albumen and positively charged Dox (at pH 7.4) could have resulted in excellent loading of Dox in albumen. To support this explanation, the surface charge of NZF@Alb NPs at pH 7.4 was studied by zeta potential measurement and shown in figure 9(f). The zeta potential value of NZF@Alb NPs was found to be ∼−23.3 mV, which confirmed negative charge on its surface. The excellent loading behavior of Dox in NZF@Alb and appearance of peak of Dox in UV–vis absorption spectra of NZF@Alb-Dox suggested Dox compatibility with nanocarrier. Dox encapsulation efficiency and the encapsulation capacity of nanocarrier were estimated to be ∼90% and ∼5% (50 ng Dox/μg particle), respectively. Similar results were reported by other researchers for similar kinds of systems [4, 19]. Loading of Dox was also confirmed by UV–vis absorption spectra of NZF@Alb-Dox (figure 9(b)). The appearance of a hump of Dox between 480–510 nm confirmed the presence of Dox in NZF@Alb-Dox NPs. Pure Dox has an absorption peak centered at ∼480 nm (inset of figure 9(b)). Digital images (figure 9(b)) show the physical appearance of aqueous NZF@Alb and NZF@Alb-Dox NPs at the same concentration (∼0.25 mg ml−1); the difference in their colors can be observed clearly. Incorporation of Dox (red color) in NZF@Alb (brown color) has resulted in reddish-brown-colored NZF@Alb-Dox NPs. All quantifications of Dox loading and release studies were done using a standard calibration curve (y = 0.013 36x + 0.011 92, R2 = 0.999) shown in figure 9(c).

Figure 9. (a) UV–vis absorption spectra and digital photographs of Dox before loading and free Dox in supernatant. (b) UV–vis absorption spectra of NZF@Alb and NZF@Alb-Dox. Inset of (b) shows UV–vis absorption spectra of pure Dox. Digital images shown in (b) show the physical appearance of aqueous dispersion of NZF@Alb and NZF@Alb-Dox NPs at same concentration of nanoparticles (∼0.25 mg ml−1). (c) UV–vis absorption spectra of different known concentrations of Dox with corresponding standard calibration. Time-dependent Dox release behavior from NZF@Alb-Dox at pH 5 (black) and pH 7.4 (red). Plots of Dox release data fitted to Higuchi (pH 5) and Korsmeyer–Peppas (pH 7.4) kinetic models are shown in (e) and (f), respectively. (g) Zeta potential result of NZF@Alb NP dispersed in PBS of pH 7.4.
Download figure:
Standard image High-resolution image3.7. In vitro release study of Dox
Besides drug loading, time-dependent release is the other important parameter for drug efficacy and delivery in a sustained and controlled manner. In vitro release behavior of Dox from NZF@Alb-Dox NPs was investigated under various environmental pH values and is demonstrated in figure 9(d). The release studies were carried out at 37 °C in two different buffers of pH 5 (mimicking cancer cell pH, especially for microenvironment in endosomes and lysosomes) and pH 7.4 (blood plasma) [4, 19, 55, 59, 62]. A sustained and pH-dependent release of Dox from NZF@Alb-Dox NPs was observed. It was observed that low-environment pH accelerates the DOX release. 15 mg of NZF@Alb-Dox (5% Dox content) was used for the release study. In the first 10 h at pH 5.0 (18.8% of loaded Dox), the Dox release % was considerably higher than those at pH 7.4 (10.4% of loaded Dox). After 24 h, the Dox release values at pH 5 and 7.4 were noted to be 29% and 20% of total loaded Dox. After 50 h of incubation, the Dox release values at pH 5 and 7.4 were found to be 41.5% (∼311 μg) and 32.5% (∼244 μg) of total loaded Dox in NZF@Alb-Dox. Very controlled and sustained release of drug from nano-carrier is desired for anticancer drug-delivery applications. The obtained Dox release profile (gradual increment with time) and nearly 29% release in the first 24 h show its sustained release behavior, which is better than the reported result (∼40%–45% Dox release in ∼24 h) for similar kinds of systems (Dox-BSA-Fe3O4-DEX-FA) [19]. Sustained release behavior of Dox could be attributed to the good electrostatic interaction between –NH2 of Dox and –COOH groups of albumen at tested pH. Relatively fast Dox release at lower pH than pH 7.4 (pH 5) can be attributed to a relatively weak electrostatic interaction between albumen matrix and Dox molecules at that lower pH value. In other words, pH-dependent release behavior of Dox from NZF@Alb-Dox NPs is due to electrostatic interactions between Dox and albumen, which is also in agreement with other reports [4, 55]. Negatively charged carboxyl groups of albumen could bind positively charged amino groups of Dox (pKa 8.3) via electrostatic attractions. Albumin protein, having isoelectric point around pH ∼5, remains negatively charged at pH 7.4 [55]. The electrostatic interactions between Dox and albumen became weak due to protonation of albumen at lower pH, resulting in relatively faster release of Dox from NZF@Alb-Dox NPs. The sudden increase in the Dox release percentage within the first hour could be attributed to the loosely and physically adsorbed Dox molecules on the surface of the NZF@Alb NPs. These pH-responsive NZF@Alb-Dox NPs may reduce the unwanted release of Dox during its transportation in the blood circulation system and improve the effective release inside tumor cells (magnetic targeting), and thus reduced side effects and improved efficacy of Dox are anticipated. Release kinetics of drug from a reservoir is generally interpreted using different mathematical models [57]. Thus, release kinetics of Dox from NZF@Alb-Dox at pH 5 and 7.4 were analyzed using zero-order, first-order, Higuchi, and Korsmeyer–Peppas models and the obtained parameters (R2, K0, K1, KH, and n) are shown in table 2. Experimental release data were fitted to these models, and the best fitted model was identified by the best correlation coefficient (R2). It was observed that release data at pH 5 and 7.4 were fitted well with the Higuchi and Korsmeyer–Peppas models, respectively. Release data fitted with Higuchi (pH 5) and Korsmeyer–Peppas (pH 7.4) models are shown in figures 9(e) and (f), respectively. The Higuchi model suggests that, at pH 5, Dox is released by diffusion-controlled process according to Fick's Law. In the case of the Korsmeyer–Peppas model, the value of n suggests the involved release mechanisms; n ≤ 0.5 indicates Fickian diffusion and n > 0.5 indicates anomalous diffusion (in case of thin coating). The mentioned range of n values and the corresponding drug-release mechanism slightly differ for different geometries (such as film, cylindrical, and sphere). For sphere, n ≤ 0.43 indicates Fickian diffusion and n in the range of 0.43 < n < 0.85 suggests the mechanism is non-Fickian diffusion or anomalous diffusion [58–60]. Thus it is imperative that, at pH 5 (n = 0.424), Dox release mechanism was via Fickian diffusion, whereas, at pH 7.4 (n = 0.646), it was via an anomalous or non-Fickian diffusion process. This could be explained in terms of reduced electrostatic interaction between Dox and albumen at lower pH. In the absence of electrostatic interaction at pH 5, Dox could have been released through a diffusion-controlled process. Anomalous diffusion of Dox at pH 7.4 could be attributed to many factors such as good electrostatic interaction between Dox and albumen, swelling and erosion of albumin matrix, etc. The zero-order kinetic model does not fit well with the experimental data; however, the first-order kinetic model has shown better fitting than the zero-order kinetic model.
Table 2. Release kinetic parameters of Dox released from NZF@Alb-Dox at pH 5 and 7.4.
| Dox release at | Zero Order | First Order | Higuchi | Korsemeyer–Peppas | ||||
|---|---|---|---|---|---|---|---|---|
| K0 | R2 | K1 | R2 | KH | R2 | n | R2 | |
| pH 5 | 0.764 | 0.889 | 0.010 | 0.930 | 5.799 | 0.975 | 0.424 | 0.951 |
| pH 7.4 | 0.688 | 0.924 | 0.008 | 0.931 | 5.085 | 0.925 | 0.646 | 0.938 |
3.8. MTT assay
Biocompatibility of the NZF and NZF@Alb NPs was confirmed by in vitro MTT assay against RAW 264.7 cells (normal cells) (figure 10(a)). A dose-dependent response was observed for both the NZF and NZF@Alb NPs. Both the samples were found to be biocompatible and non-toxic in nature, with a minimal cells inhibition even at very high doses. For the maximum tested dose (800 μg ml−1) the cell viability for NZF and NZF@Alb NPs was found to be ∼85% and ∼88%, respectively, which suggested the biocompatible nature of both the samples. A relatively improved biocompatibility of NZF@Alb NPs over bare NZF NPs was observed and could be attributed to the albumen coating. The in vitro cytotoxicity of the blank NZF@Alb NPs, free Dox, and NZF@Alb-Dox NPs against HeLa cells (cancerous cells) are shown in figure 10(b). Cytotoxicities for NZF@Alb NPs, free Dox, and NZF@Alb-Dox NPs against HeLa cells were found to be dose dependent. A moderate toxicity (28.4% cell inhibition at 800 μg ml−1) toward HeLa cells has been observed for NZF@Alb NPs. In a recent study, Al-Qubaisi et al have concluded that NZF NPs have potential cytotoxicity against HT29, MCF-7, and HepG2 cells through glutathione depletion in cancer cells, which results in increased production of reactive oxygen species (ROS) and eventually cell death [33, 34]. In the present case, even though NZF@Alb NPs do not show much toxicity toward HeLa cells (due to coating of biocompatible albumen), the soft and superparamagnetic nature of NZF NPs retained its importance due to good magnetic controllability. Free Dox shows ∼60% cell inhibition up to 10 μg ml−1, and thereafter the inhibition rate becomes nearly constant. The IC50 of free Dox was found to be 10 μg ml−1. In the case of NZF@Alb-Dox, a linear dose-dependent cell inhibition was observed with an IC50 value of 20 μg ml−1. Maximum cell inhibition (at 40 μg ml−1) for free Dox and NZF@Alb-Dox were found to 66.2% and 64.3%, respectively, after 24 h incubation. NZF@Alb-Dox showed decreased cytotoxicity compared to free Dox for the same concentration of Dox. However, free Dox lacks in magnetic tumor-targeting ability, which can lead to severe side effects. Less cytotoxicity of NZF@Alb-Dox than free Dox could be due to the very slow release of loaded Dox from nanocarrier as opposed to the fast diffusion of free Dox molecules. Due to the slow release rate, a large portion of Dox molecules (∼71%, as ∼29% Dox released at pH 5 after 24 h) were still within the NZF@Alb-Dox (after 24 h incubation), which results in a lower actual Dox dose with NZF@Alb-Dox than that delivered with free Dox [61]. Similar observations were also made by earlier researchers [19, 56, 61]. MTT assay against HeLa cells has shown promising anticancer activity in NZF@Alb-Dox, which shows NZF@Alb to be a suitable and compatible nanocarrier for Dox.

Figure 10. (a) Cell viability measured by MTT assay of RAW 264.7 cells treated with different concentrations of NZF and NZF@Alb NPs. (b) Growth-inhibition results or cytotoxicity assay for HeLa cells treated with free Dox, plain NZF@Alb NPs, and NZF@Alb-Dox NPs with different concentrations. The concentration of NZF@Alb NPs against HeLa cells is shown on the upper x axis of (b).
Download figure:
Standard image High-resolution image3.9. Stability studies
Long-term stability of nanoparticles has been studied using XRD, UV–vis spectroscopy, and dynamic light scattering (DLS) techniques, and their results are shown in figures 11 and 12. XRD patterns of NZF@Alb NPs stored in a glass vial at room temperature for 1 and 6 months are shown in figure 11(a) (top two patterns). It was observed that the sample was quite stable, and its crystalline structure does not change even after 6 months. To observe structural changes occurring in the NZF@Alb-Dox NPs incubated in buffers of pH 5 and 7.4 for 50 h, XRD (figure 11(a)) and TEM (figure 12) analyses of samples were carried out. XRD patterns of NZF@Alb-Dox NPs incubated in buffers of pH 5 and 7.4 for 50 h are shown at the bottom of figure 11(a). All four XRD patterns show characteristic diffraction peaks of spinel cubic NZF NPs, and the absence of any extra peak shows the chemical and structural stability of the material. Figure 11(b) shows UV–vis absorption spectra of NZF@Alb-Dox NPs stored in dark for 1 month. Appearance of absorption peak of Dox (at ∼480–500 nm) in UV–vis absorption spectra of NZF@Alb-Dox suggested good stability and compatibility of Dox with the nanocarrier. For biological applications, it is important to study the hydrodynamic particle sizes of the nanocarriers and their distribution in liquid media. Thus, hydrodynamic particle size distribution and stability of NZF@Alb-Dox NPs were studied by DLS technique at pH 7.4 PBS. The hydrodynamic particle size distribution of NZF@Alb-Dox NPs after 1 and 15 days of incubation at pH 7.4 PBS is shown in figures 11(c) and (d), respectively. The hydrodynamic particle size of NZF@Alb-Dox NPs (in PBS) for 1 and 15 days was found to be ∼169 and ∼175 nm, respectively.
Hydrodynamic particle size and particle size distribution of NZF@Alb-Dox NPs were also studied in biological media (DMEM supplemented with 10% FBS, 1% L-glutamine, and 100 U ml−1 penicillin), and is shown in figure 11(e). The hydrodynamic particle size of NZF@Alb-Dox NPs in biological media was found to be ∼174 nm. All the DLS results have shown a single distribution peak with narrow particle size distribution. Figure 11(f) shows hydrodynamic particle size against time, which indicated long term colloidal stability of NZF@Alb-Dox NPs in physiological condition (PBS 7.4) since not much size fluctuation was observed. Dispersibility and colloidal stability of NZF@Alb-Dox NPs in different media such as Milli-Q water, PBS, and biological media have been examined. Figures 11(g) and (h) are digital images of NZF@Alb-Dox NPs dispersed in Milli-Q water, PBS, and biological media taken at t = 0 and 5 days. These images showed stable nature of the NZF@Alb-Dox NPs in all the tested media even after long storage. The hydrophilic nature of coated albumen, electrostatic repulsion between the particles, and steric forces could be the reasons for good colloidal stability.
Surface charge and colloidal stability of NZF@Alb and NZF@Alb-Dox NPs in PBS have also been studied by zeta potential measurement. The zeta potential values of NZF@Alb and NZF@Alb-Dox NPs are found to be ∼−23.3 and −15 mV, respectively. The slight decrease in the zeta potential value of NZF@Alb-Dox compared to NZF@Alb could be due to the loading of positively charged Dox molecules. Both the samples were found to be colloidally stable in nature. Figures 12(a) and (b) show TEM micrographs of NZF@Alb-Dox NPs incubated in buffer of pH 5 and 7.4 for 50 h, respectively. Coating of amorphous albumen on crystalline NZF NP can be seen in both cases, which suggested the stable nature of NZF@Alb-Dox NPs. Figure 12(c) is the HRTEM image of the framed (yellow) region in (b), which clearly shows the presence of albumen coating on crystalline NZF NPs. No obvious structural changes in NZF@Alb-Dox NPs at both pH values was observed. The inset of (c) shows IFFT image of the indicated atomic lattice fringes on NZF NP, which also confirmed that the crystalline nature of NZF NP did not get altered during incubation. These results simultaneously demonstrated a high chemical and physical long-term stability of the prepared nanoparticles. Long-term stability studies of nanoparticles using similar techniques have already been reported earlier [63, 64]

Figure 11. Characterization of the long-term stability of nanoparticles. (a) XRD patterns of NZF@Alb NPs stored in a glass vial for 1 and 6 months (top two) and NZF@Alb-Dox NPs incubated in buffers of pH 5 and 7.4 for 50 h (bottom two). (b) UV–vis absorption spectra of NZF@Alb-Dox NPs stored in dark for 1 month. DLS hydrodynamic particle size distribution of NZF@Alb-Dox NPs after 1 day (c) and 15 days (d) of incubation at pH 7.4 PBS. (e) DLS hydrodynamic particle size distribution of NZF@Alb-Dox NPs dispersed in biological media. (f) Hydrodynamic particle size of NZF@Alb-Dox NPs against time to show its long-term stability. Digital images of NZF@Alb-Dox NPs dispersed in Milli-Q water, PBS, and biological media taken at t = 0 day (g) and 5 days (h).
Download figure:
Standard image High-resolution image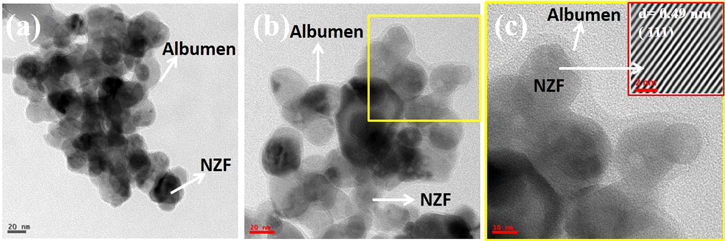
Figure 12. TEM micrographs of NZF@Alb-Dox NPs incubated in buffer of pH 5 (a) and 7.4 (b) for 50 h. (c) shows HRTEM image of framed (yellow) region in (b). Inset of (c) shows IFFT image of indicated NZF NPs.
Download figure:
Standard image High-resolution image
It is suggested that NZF@Alb based nanoformulations, which possess efficient anticancer activity together with low systemic toxicity, can act as ideal nanocarriers for the targeted parceling of anticancer drugs. Thus, these types of nanoformulations would be very useful where targeted and pH-dependent delivery of hydrophilic anticancer drugs are required. Other potential biomedical applications of the prepared nano-formulations could be in the field of hyperthermia and MRI.
4. Conclusions
In summary, novel, multifunctional, pH responsive, water-dispersible, and magnetically guidable NZF@Alb and NZF@Alb-Dox NPs were successfully prepared by a simple and eco-friendly method using inexpensive chicken egg albumen, and characterized for different physiochemical properties. NZF and NZF@Alb NPs were found to be superparamagnetic and biocompatible in nature. The NZF@Alb and NZF@Alb-Dox NPs had a mean size ∼100 nm. Beside high loading efficiency, in vitro Dox release studies from NZF@Alb-Dox NPs showed a sustained and pH-dependent release profile. NZF@Alb-Dox showed promising anticancer activity against HeLa cells. Considering the obtained results, it is suggested that this scalable and pH responsive albumen-based magnetic nanoformulation would have potential applications in the targeted and controlled delivery of anticancer drugs for cancer treatment.
Acknowledgments
M Qasim greatly acknowledges the financial support (2012-13/MANF-2012-13-MUS-UTT-15733) obtained from the Ministry of Minority Affairs, through the University Grants Commission (UGC), in the form of a MANF fellowship in carrying out this research work. The technical support received from the School of Engineering Sciences & Technology (SEST), Centre for Nanotechnology, School of Physics and Central Instruments Laboratory (CIL) at the University of Hyderabad is greatly appreciated.