

Abstract
We present an original type of model electrode system consisting of bimetallic Au–Ag nanoparticles embedded in an amorphous carbon matrix with an extremely well-defined geometry of parallel, straight, cylindrical macropores. The samples are prepared in one step by direct laser deposition of the metal/carbon composite onto the inner walls of a porous 'anodic' alumina matrix serving as a template. The coating is homogeneous from top to bottom of the pores, and the amount of material deposited can be tuned by the duration of the deposition procedure. As a test system, we demonstrate that a bimetallic Ag–Au@C system is catalytically active for the electrochemical oxidation of glucose in alkaline solution, the anodic reaction of a direct glucose fuel cell. Furthermore, the electrocatalytic current density increases with the amount of Ag–Au@C NPs deposited, up to a point at which the pores are clogged with it. This type of model system allows for the systematic study of geometric effects in fuel cell electrodes. It can be generalized to a number of different nanoparticle compositions, and thereby, to various electrocatalytic reactions.
Export citation and abstract BibTeX RIS
1. Introduction
The kinetics of electrochemical reactions determine the efficiency and power density of fuel cells. Electrode materials can be tailored to specific applications based on either the chemical composition or porous geometry of the surface. In low-temperature fuel cells, electrodes mostly consist of hybrid materials in which a carbon-based support is functionalized with catalytically active nanoparticles (NPs) of noble metals, alloys or metallic composites [1–7]. While chemically inert, the porous carbon support provides the high specific surface area needed for large current densities. Because mass and charge transport in the electrolyte can become limiting in long and/or tortuous pores, the morphology of the support is often discussed as one key parameter in the electrode kinetics. However, commercial or lab-prepared carbon materials mostly display a disordered structure, so that systematically studying the electrochemical behavior of fuel cell reactions as they depend on geometry is not possible experimentally. Thereby, the data are mostly interpreted based on ad hoc models, and unraveling transport versus surface turnover effects is no trivial task, independently of the particular type of fuel cell considered [8–10]. Thus, we contend that a system of straight, parallel, cylindrical pores of well-defined diameter and length coated with a carbon/metal nanoparticle composite would provide a much-needed model system in the community.
This paper presents such a system in which Ag–Au NPs on a carbon (C) support are coated on the walls of nanoporous 'anodic' alumina. Not only is the geometry highly controlled and tunable, the preparative method is highly efficient, as well. Indeed, from the anodic template we obtain the Au–Ag@C surface in one single step using laser-induced surface decoration. Typical existing methods are multistage, in that they base on the subsequent deposition of carbon and metal NPs [1–7, 11, 12]. Furthermore, such depositions may not be arbitrarily applicable to porous or otherwise three-dimensional substrates.
We focus on the oxidation of glucose to prove our concept. This reaction lies at the heart of the so-called direct glucose fuel cell (DGFC), a device which would potentially transform organic waste into electrical energy [13–16]. Although many authors focus on microbial DGFCs, catalysis of the electrochemical reactions with metallic particles is possible, as well [13, 14, 17]. Here, we will focus on the Ag–Au system as catalytically active material for glucose oxidation. Although those elements are typically considered to be catalytically inert, they have been used in nanoparticulate form for the low-temperature oxidation of carbon monoxide [18], the hydrochlorination of acetylene to vinyl chloride [19], and the electrooxidation of glucose [17]. We note also that alloys and biphasic systems provide additional degrees of freedom with respect to monometallic nanosystems to optimize catalytic performance [20–24].
As a template system, 'anodic' alumina is selected as it provides not only ordered arrays of parallel, cylindrical pores but also the possibility of varying accurately their diameter and length (in the ranges of about 10–300 nm and 0.5–100 μm, respectively), and thereby, of performing systematic studies of geometric effects [25–31]. Decoration of anodic membranes with Au–Ag@C NPs is carried out with a laser-induced deposition technique developed for planar transparent or nontransparent substrates [32–34], and transferred here to structured templates. The approach is based on irradiation of the substrate/solution interface with a laser beam, which results in the formation of the metal/carbon composite material in the irradiated area (see the scheme, figure 1(a)). Here, the solution for laser-induced deposition consists of the photosensitive organometallic supramolecular complex (SMC) precursor [(Au13Ag12(C2Ph)20)(PPh2(C6H4)3PPh2)3] (PF6)5 (figure 1(b)) dissolved in dichloroethane, the laser-induced decomposition of which results the formation of the hybrid Au–Ag@C layer on the substrate surface [34]. This approach is general, in that a whole family of photosensitive homo- and heterometallic phosphine and alkyl clusters can be used as SMC precursors. Various cluster core size, qualitative and quantitative compositions (Au–Ag [35, 36], Au–Cu [37, 38], and Ag–Cu [39] pairs), as well as different organic ligand environments yield a broad range of NPs compositions, morphologies, and functional properties. Among the practically appealing features of this deposition approach are the aerobic, room-temperature conditions, the weak laser fields required, and the accurate control of the NPs deposition rate possible.

Figure 1. (a) Schematic view of the experimental realization of the laser deposition procedure. The label I represents the (tunable) laser intensity. (b) Schematic structural representation of the organometallic supramolecular complex (SMC) [(Au13Ag12(C2Ph)20)(PPh2(C6H4)3PPh2)3]5+.
Download figure:
Standard image High-resolution imageIn previous work, the hybrid Au–Ag@C NPs obtained upon laser deposition from the Au13Ag12-core SMC precursor on planar substrates has been characterized quite extensively by a number of experimental methods: the alloy nature of the metallic phase and its composition reflecting that of the SMC were demonstrated by x-ray microanalysis and x-ray photoelectron spectroscopy, the amorphous carbon support was investigated by vibrational spectroscopies, and the morphology of separate metal NPs embedded in the porous carbon matrix was imaged by electron and helium ion microscopic techniques [32, 33]. Based on this solid knowledge base, the present paper establishes the applicability of the laser deposition method to the functionalization of nanostructured surfaces to be used as catalytically active model systems for fuel cell electrodes.
2. Materials and methods
2.1. Materials
Chemicals were purchased from Sigma Aldrich, VWR, or Roth and used as received. Aluminum plates (99.99%) were obtained from SmartMembranes. The Au sputter target was ordered from Stanford Advanced Materials. The SMC [(Au13Ag12(C2Ph)20)(PPh2(C6H4)3PPh2)3] (PF6)5 was synthesized according to the published procedure [35].
2.2. Sample preparation
The preparation of the nanoporous anodic aluminum oxide templates was performed according the usual two-step anodization procedure [43]. For this, an electrochemical oxide formation was used. The application of a positive electrical potential to an aluminum plate and the attendance of an aqueous acidic electrolyte led to the formation of straight cylindrical pores. For the preparation of the membranes aluminum plates (∼2.3 cm2) were placed in a home-made PVC beaker with four circular openings and held between an O-ring and a copper plate used as electrical contact. Each cell was closed with a metal housing, which contains an Ag wire as counter electrode and a mechanical stirrer. The aluminum plates were first electropolished for 5 min under a potential of +20 V in a cooled mixture of perchloric acid (70%) and ethanol (v/v 1:3). The first anodization was carried out in 0.5 wt% phosphoric acid under +195 V for 1 h at 0 °C, then for additional 23 h in 1.0 wt% phosphoric acid under +195 V at 0 °C. The low initial concentration prevents catastrophic pitting ('burning'), whereas the higher concentration allows for a more rapid pore growth. The sacrificial disordered oxide layer was removed with chromic acid (2% H2CrO4 in H3PO4) at 45 °C for 23 h. The second anodization was performed under +195 V at 0 °C in 0.5 wt% phosphoric acid for 1 h and afterwards in 1.0 wt% phosphoric acid under +195 V. In our observations, the pore diameter remains constant within experimental uncertainty despite the change in concentration. The next step was the removal of the metallic aluminum backside with a solution of 13.6 g CuCl2 · 6H2O, 100 ml HCl and 400 ml H2O. The barrier layer of the phosphoric acid membranes was removed by submerging the samples completely into 10 wt% H3PO4 at 45 °C for 45 min.
The solution for laser-induced deposition was prepared by dissolving of 5 mg of SMC in 1 ml of dichloroethane of analytical grade purity. To remove the undissolved components, the solution was centrifuged at 10 000 rpm for 5 min Then the aliquot of solution was placed into a microcuvette, and then Al2O3 membrane was immersed into the SMC solution. An unfocused beam (ca. 2 mm in diameter) of He–Cd laser (CW, λ = 325 nm, P = 1 mW cm−2) was directed to the substrate/solution interface from the side of solution (figure 1(a)). The degree of defocusing defines the sample size and power density. Irradiation time was varied from 10 to 70 min. As a result of laser irradiation NPs were formed in the laser-affected area of substrate. After the deposition procedure the membranes were washed in a flow of acetone.
Subsequently, the samples were coated with an 80 nm Au contact layer with a Torr CRC 622 Sputter Coater. The metal layer was then reinforced by Ni galvanic plating in a diluted Watts electrolyte (0.285 M NiSO4 · 6H2O, 0.0475 M NiCl2 · 6H2O, 0.5 M H3BO3) at −2.2 V for 120 min.
2.3. Characterization
Scanning electron microscopy was performed either on a FE-SEM Zeiss Merlin equipped with energy-dispersive x-ray spectrometer (EDX) under 10 kV for imaging and 15 kV used for EDX, or on a Jeol JSM 6400 PC with an EDX detector from SAMx. The absorption spectra of the deposited NPs were measured with a Precision Spectrophotometer Lambda 1050 UV/VIS/NIR with integrating Ulbricht sphere in a spectral range 350–600 nm. For the measurements of absorption spectra the NPs were deposited by the laser-induced technique onto the surface of cover slips (Menzel glass). The substrate with NPs was placed in the sphere center.
2.4. Electrochemical studies
For the electrochemical studies the membranes were laser-cut with a GCC LaserPro into circular pieces and glued onto small cupper plates with a conductive silver adhesive. In order to define the electrode area accurately, a mask was used made from polyamide (Kapton®) tape with a circular opening of 1.0–4.5 mm. The samples were then placed into three-electrode electrochemical cells with a Pt counter-electrode. As a reference, an Ag/AgCl (3 M KCl) with a standard redox potential of +0.21 V versus NHE was used. All potentials given in the paper are stated with respect to the Ag/AgCl reference. The electrochemical studies were performed in a solution of 5 mM glucose in 0.1 M NaOH and (as a control experiment) in pure 0.1 M NaOH, respectively. The pH of both electrolytes was adjusted to 9.5(±0.5).
All electrochemical measurements were recorded using a Gamry Interface 1000 potentiostat. Cyclic voltammetry was carried out starting at the open-circuit potential (near +0.20 V) between –0.90 and +0.60 V with a scan rate of 50 mV s−1. The second CV cycle is presented. Electrochemical impedance spectroscopy (EIS) was performed with a 10 mV amplitude from 100 kHz to 1.0 Hz at +0.50 V.
3. Results and discussion
3.1. Laser-induced decoration
Two fundamental requirements towards applications of the laser deposition technique in catalysis and electrocatalysis are its applicability to morphologically complex three-dimensional substrates and the experimental control over the amount of material deposited. Figure 2 presents the microscopic appearance of anodic alumina substrates featuring pores of ca. 150 nm diameter coated by laser-induced deposition for various illumination durations. One can observe that the deposition time allows for a controllable increase of the amount of material deposited. The NPs display sizes and separations on the order of ca. 10–20 nm and 20–50 nm, respectively (based on SEM observations), and they are dispersed on the sample surface as well as inside the pores without clogging them, at least up to a certain deposition duration (about 60–70 min in our experimental conditions). For the NPs deposited for over 70 min, their aggregation results in an uncontrollable size increase, which should be avoided. The deposition takes place not only on the membrane surface and near the top extremity of the pores, but also inside the pores on their whole length, as substantiated by figures 3(a) and 4. The high deposition homogeneity on such complex 3D surfaces and in pores of high aspect ratio is ensured by light propagation along the pores and multiple light reflections.

Figure 2. Control of the amount of Au–Ag@C nanoparticles deposited. Scanning electron micrographs of anodic alumina membranes treated with laser-induced deposition for (a) 0 min, (b) 10 min, (c) 30 min, (d) 60 min. A red arrow is used to highlight one nanoparticle exemplarily.
Download figure:
Standard image High-resolution image
Figure 3. (a) Scanning electron micrograph of a nanoporous alumina template (presented in cross-section) after laser deposition of Au–Ag@C. (b) Energy-dispersive x-ray spectrum of NPs deposited onto the membrane surface (some peaks are highlighted: green, C; blue, Au; red, Ag). (c) SEM image of NPs deposited onto a planar ITO film as the substrate. (d) UV–visible absorption spectrum of NPs on a planar ITO film.
Download figure:
Standard image High-resolution image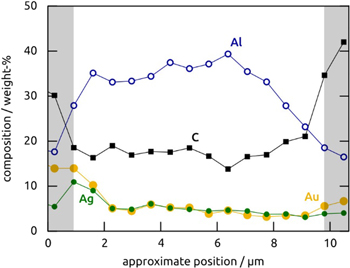
Figure 4. EDX element analysis of an anodic alumina sample laser-coated with Au–Ag@C for 60 min in a depth profile recorded from one extremity of the pores to the other extremity. The element O is not shown and accounts for the difference to 100%. The sections of the graph with gray background represent data collected outside of the thickness of the sample, where the absolute signal intensities are very low and the percentages arbitrary. The abscissa (position) is only approximate due to electrostatic charging of the sample over the course of the measurements.
Download figure:
Standard image High-resolution imageThe chemical identity of the deposited NPs is provided by EDX analysis, which evidences the presence of the elements carbon, gold and silver (figures 3(b) and 4), in addition to the signals of Al and O originating from the template. The laser-deposited material accounts for 30% of the sample in mass approximately (20% C, 5% Ag, 5% Au) after 60 min of deposition. Given the uncertainty of EDX quantification (±0.5%), the EDX microanalysis is consistent with the 13:12 Au-to-Ag ratio in the SMC used as the precursor. The UV–visible absorption spectrum of the deposit measured for NPs deposited onto ITO-covered microscope slip (figure 3(c)) reveals a single absorption peak in the region of 450 nm related to the surface plasmon resonance of the metallic NPs (figure 3(d)). The position of the absorption band is typical of Au−Ag alloy particles and is indicative of a single, homogeneous crystalline metal phase. It is clearly distinct of the plasmon absorption spectrum of mechanical mixture of Ag and Au NPs, which give rise to two separate peaks near 400 and 520 nm [40]. Taken together, these results establish the morphology of our laser-induced deposit as consisting of Au–Ag alloy particles incorporated in a carbon matrix, which coats the alumina pore walls homogeneously. They are consistent with previous transmission electron microscopy evidence collected on planar laser-coated samples [34].
3.2. Electrocatalysis
The silver/gold system is known to catalyze glucose oxidation in strongly alkaline aqueous medium [17]. Our anodic alumina samples are not stable at pH 14 (figures 5(c), (d)): prolonged exposure to pH 14 conditions cause a complete removal of the Al2O3 template. On figure 5(d), pores have disappeared, leaving aggregated amorphous material on top of the Au/Ni contact segments. At pH 9.5, however, the samples are sufficiently stable to allow for electrochemical characterization, as evidenced in figures 5(a), (b).

Figure 5. Stability of nanostructured Au–Ag@C/alumina samples in basic electrolytes. Scanning electron micrographs (a) and (b) compare a sample as prepared and after approximately 3 h of electrochemical measurements in pH 9.5 electrolyte: no changes are observed. Micrographs (c) and (d) present a similar comparison in pH 14, which causes dissolution of the matrix.
Download figure:
Standard image High-resolution imageA nanoporous anodic alumina sample conferred with an Au/Ni electrical contact at one extremity of the pores displays very limited electrochemical activity in alkaline glucose solution (gray trace in figure 6). On the oxidative side of the voltammogram, the current is in the μA cm−2 range. As soon as Au–Ag@C material is deposited, a well-defined couple of sharp peaks appears between 0.0 and +0.2 V for the surface oxidation of metallic Ag and the corresponding reduction [17, 41]. The main peak between +0.4 and +0.6 V is due to the electrocatalytic glucose oxidation [17, 42], as substantiated by the comparison with a control voltammogram recorded in the absence of glucose substrate (figure 7(a)). In a separate control experiment, Au–Ag@C deposited onto a planar sample consisting of transparent indium tin oxide on a glass slide gives rise to a very low current (figure 7(a)). This proves that the bulk of the porous sample is electrochemically active, not only its surface. The peak current reaches several mA cm−2 and increases with increasing Au–Ag@C deposition time (that is, with increasing amount of Au–Ag@C, figure 2). Beyond 70 min of deposition, however, we observe that the pores are clogged and that the samples only exhibit a more or less planar surface. The electrocatalytic activity drops correspondingly. Samples treated with a deposition on the order of 60–70 min long yield the most intense glucose oxidation peak and the cleanest voltammograms overall, whereas samples featuring lesser amounts of active Au–Ag@C display capacitive and pseudo-capacitive behavior on the cathodic side.

Figure 6. Cyclic voltammetry of nanoporous electrodes prepared from an anodic alumina template with pores of 150 nm diameter and 25 μm length and submitted to laser deposition of Au–Ag@C NPs for various durations.
Download figure:
Standard image High-resolution image
Figure 7. (a) Control experiments: the cyclic voltammograms of a nanoporous sample coated with Au–Ag@C for 60 min recorded in alkaline glucose solution (light blue trace) is compared to voltammograms recorded with the same sample in the absence of glucose (black line), and with a planar sample (Au–Ag@C on indium tin oxide/glass) in glucose solution (dashed gray). The comparison substantiates the attribution of the observed waves to glucose turnover inside the porous sample. (b) Electrochemical impedance spectroscopy of three distinct nanoporous Ag–Au@C samples at +0.5 V in alkaline glucose solution.
Download figure:
Standard image High-resolution image
The electrocatalytic performance of the nanoporous electrodes is quantified at +0.5 V (a potential at which the electrocatalytic glucose oxidation current is dominant) by EIS (figure 7(b)). The best samples all show similar behavior in the Nyquist plot, with an almost straight, steep line. This behavior is characteristic of systems in which transport plays a predominant role [28]. The smallest impedances are obtained for the samples generated with 60 and 70 min of laser deposition.
4. Conclusions
A novel method is now available for the preparation of electrode surfaces consisting of catalytically active metallic NPs on an electrically conductive carbon support and with a well-defined geometry of parallel, cylindrical pores. The method bases on the laser-induced formation of the metal/carbon material in one step from a solution of a SMC precursor. The electrocatalytic activity of the samples is optimized when the amount of NP@C deposited is sufficient to provide a continuous electrically conducting path along the full length of the pores but not excessive in order to guarantee access of the electrolyte to the full pore length, as well. In our experimental conditions, the optimal laser deposition duration is found at 60–70 min.
This novel preparative approach presents several appealing characteristics. (1) It is experimentally simple, as it occurs in aerobic, room-temperature conditions and generates both components (C and metal) simultaneously. (2) It allows for the control of the amount of material deposited and is applicable not only to planar substrates but also to highly porous or otherwise three-dimensional ones. (3) The use of anodic alumina as the inert template generates a nanoscale geometry that can be tailored accurately and varied systematically (in terms of pore length and diameter). This geometry provides the perfect model system for studies of electrochemical reactions for which either transport of dissolved species or turnover at the surface can be kinetically limiting. (4) The method can be generalized to other metals (either pure or alloyed), either by the use of different molecular precursors of the laser-induced deposition, or by subsequent transformations of the surface. Thus, it is applicable beyond the confines of DGFCs.
Future research in our laboratories will be performed along those lines. At this point, we have already been able to demonstrate a promising current density variation for the DGFC anode by more than an order of magnitude solely by varying the amount of Au–Ag@C hybrid material.
Acknowledgments
We acknowledge L Assaud for providing initial experimental support to the project, I Koshevoy for the SMC synthesis, and A V Povolotskiy for help in figures preparation. This research was financed by the German Ministry of Education and Research (BMBF) in the project 'TubulAir±' (number 03SF0436G) and by the Ministry of education and science of Russia within project 14.604.21.0078 (registration number RFMEFI60414X0078). Raman, FTIR and UV/VIS absorption spectra were measured at the Center for Optical and Laser Materials Research, SEM analysis (figure 2) was carried out at the Interdisciplinary Resource Center for Nanotechnology, Research park of St Petersburg State University. Travel was funded by the German–Russian Interdisciplinary Science Center (grant C-2014b-4).