

Abstract
The development of low cost supercapacitor cells with unique capacitive properties is essential for many domestic and industrial purposes. Here we report the first ever application of SnS2-reduced graphene oxide (SnS2/RGO) layered nanocomposite as a superior electrode material for symmetric aqueous hybrid supercapacitors. We synthesized SnS2/RGO nanocomposite comprised of nanosheets of SnS2 and graphene oxide via a one-pot hydrothermal approach. in situ as-synthesized SnS2/RGO is devised for the first time to give high specific capacitance 500 Fg−1, energy density 16.67 Wh kg−1 and power density 488 W kg−1. The cell retains 95% charge/discharge cycle stability up to 1000 cycles. In-short, the SnS2/RGO nanosheet composite presented is a novel and advanced material for application in high stability moderate value hybrid supercapacitors. All the currently available surveys in literature state the potential applicability of SnS2 as the anode material for reversible lithium/sodium ion batteries (LIBs/NIBs) but there is a lack of equivalent studies on electrochemical capacitors. We filled up this knowledge gap by the use of the same material in a cost-effective, highly active hybrid supercapacitor application by utilizing its pseudocapacitance property combined with the layered capacitance property of graphene sheets.
Export citation and abstract BibTeX RIS
1. Introduction
Among the IV–VI chalcogenide semiconductors, tin disulfide (SnS2) is one of the important, attracting enormous attention in recent years both as bulk and nanostructured material. SnS2, a naturally abundant material, exists in a CdI2 type structure composed of a layer of Sn atoms sandwiched between two layers of hexagonally close packed S atoms (space group P3m1), the neighboring sulfur layers being linked by weak van-der-Waals forces [1]. Control over the morphology of nanostructured materials with novel shapes and uniform size remains an important goal of modern synthetic nanochemistry, because shape- and size-controlled nanomaterials are promising candidates as active components in a wide range of technological applications and as model systems for basic research. Keeping this in mind, researchers have developed SnS2 in various morphologies such as nanosheets [2], nanoplatelets [3], nanorods [4], etc, following several bottom-up synthesis methods and demonstrated the potential applicability of the material. The material is famous as potential optical semiconductor catalyst in various photocatalytic reactions [5], as an interesting photovoltaic material [6], and most importantly SnS2 [3] has been studied as anodic material for reversible lithium ion batteries (LIBs) or sodium ion batteries (NIBs) with great efficiency at low redox potential [7]. A very large interlayer spacing (c = 5.89 Å) in this layered structure makes the insertion and extraction of guest species (Li+ and Na+) in LIBs and NIBs easy. Moreover, this interlayer spacing easily accommodates the theoretical 420% volume expansion during the sodiation process in NIBs while forming Na14Sn4 alloy. This has been confirmed in the lithiation process too, where SnS2 is used as the anodic material in the case of LIBs [3, 8].
As all the literature surveys say the potential applicability of SnS2 as the anode material for LIBs/NIBs, a question arises whether this could be an inherent candidate as electrode material in supercapacitor? Because in supercapacitor reactions, where charge–discharge is much faster than LIBs/NIBs, it is likely that the electrolyte ions (Na+, K+, H+, etc) could be used to store charge/energy via Faradic redox reaction involving a change in oxidation state of Sn in SnS2 [9]. The current demand for electrical energy storage systems for many domestic and industrial purposes has been centered on rechargeable LIBs and NIBs; however, the demand for power beyond the capacity of these rechargeable batteries is concentrated on novel electrochemical capacitors, i.e. supercapacitors, which are superior to batteries in many aspects. Supercapacitor research steals interest due to its unique capacitive properties, such as fast energy delivery, attractive specific power, reasonably short charging period, long durability and eco-friendly features [10, 11]. According to charge storage mechanism, supercapacitors are classified in two main categories—namely, electric double layer capacitors (EDLC), where charge is stored electrostatically [12, 13] and pseudo capacitors, where kinetically facile Faradaic reactions occur at the electrode surface and electrons are transferred to or from the valence bands of the redox reagent [11, 14]. Therefore, we aim at the development of a hybrid supercapacitor (HSC) with the idea of utilizing SnS2 as a novel supercapacitor material stacked in graphene sheets, where the electrode stores charge electrostatically as well as Faradaically. Hybrid supercapacitors represent relatively higher energy density with respect to EDLCs along with high power capability, long cycle lifetime and fast charge–discharge rates. Recently graphene is considered as an attractive material for electrochemical energy storage applications due to its attractive properties, such as large surface area, good electrical properties, good cycle stability, large double layer capacitance, good chemical stability, and high mechanical strength [15]. Thus the combination of SnS2 and graphene sheet might be expected to support novel hybrid supercapacitor behavior due to the synergetic properties of the constituents. Electrode materials for supercapacitors are classified into three categories [11]: (i) carbon based compounds [16, 17], (ii) transition metal oxide/sulfide based materials (RuO2 [18]; NiO2, V2O5 [19]; MnO2 [20]; Fe3O4 [21]; FeOOH [22]; Co3O4 [23]; MoS2 [24]; WS2 [25]; CoS2 [26]; CuS [27]; VS2 [28]; etc) and (iii) conducting polymers [29, 30] (polyaniline, polypyrrole, polythiophene). As per the authors' information, there is no report available in literature about the usability of nanostructured SnS2 or its composite with graphene sheet in supercapacitor applications, excepting only two reports where Mo-doped SnS2 [31] and SnS2/MoS2 [32] heterostructure is studied for the purpose. Our group alone has shown recently the charge storage characteristics of tin chalcogenide nanorods (SnS), but with low specific capacitance value [33] and the formation of SnS2 nanodisc/RGO composite [34]. From the above discussions, it was predicted that nanostructured SnS2 with graphene could offer high supercapacitance, where the alkali metal ions of electrolyte can easily access Sn atom of SnS2 structure due to the layered structure of the former and the resulting volume change could be controlled with the formation of MxSny and Na2S.
In this report we introduced two dimensional (2D) hexagonal nanosheets of SnS2 and its composite with reduced graphene oxide (SnS2/RGO) as promising symmetric electrode material for HSC in 2 M Na2SO4 aqueous electrolyte. We synthesized 2D hexagonal nanosheets of SnS2 using surfactant dioctyl sulfosuccinate sodium salt (AOT) via hydrothermal approach and further SnS2/RGO nanocomposite was synthesized in situ by addition of graphene oxide sheets during the SnS2 synthesis process. The supercapacitive performance of as-synthesized electrode materials was evaluated by using a conventional two electrode system (coin type) in various controlled conditions (e.g. types of electrolytes, concentrations), however aqueous 2 M Na2SO4 was best suited as neutral electrolyte as aqueous electrolytes are more environmentally benign and have higher ionic conductivity. Very high specific capacitance value along with power and energy density were observed for cells using SnS2/RGO without adding any conductive filler. The specific capacitance was observed to be stable up to a minimum of 1000 cycles in the conditions studied. Further we have carried out detailed characterization of the materials after galvanostatic charge–discharge studies to elucidate the Faradaic mechanism.
2. Experimental section
2.1. Materials used
Graphite powder (99%), tin(IV)bis(acetylacetonate) dichloride (99%), Dioctyl sulfosuccinate sodium salt (AOT, 96% from Sigma–Aldrich, USA), ortho-phosphoric acid (o-H3PO4, 98%), hydrochloric acid (HCl, 80% from Thomas Baker, India), sulphuric acid (H2SO4, 98%), potassium permanganate, (KMnO4, 98.5%), sodium sulfide (Na2S, 98.5% from Merk, India), hydrogen peroxide (H2O2, 59% from Fischer Scientific, India), and sodium borohydride (NaBH4, 98% from Alfa Aesar, India) were used without any further purification.
2.2. Synthesis of SnS2 nanosheets
In a typical synthesis process, 1 mmol tin(IV)bis(acetylacetonate) dichloride, dissolved in a minimum amount of distilled water (1–2 ml) was added to 5 mmol of AOT, dissolved in 10 ml of water and stirred for 30 min. Thereafter 3 mmol Na2S (dissolved in 1 ml distilled water) was added slowly to the above mixture and stirred for another 30 min. This reaction mixture was then transferred to an autoclave that was sealed and maintained at 180 °C for 10 h. After completing the reaction, the product was rinsed three times with absolute ethanol and distilled water, and dispersed in 1 ml of ethanol for further characterization and capacitor studies.
2.3. Synthesis of GO and RGO
Graphene oxide sheets were synthesized by modified Hummer's method and the reduction of as-obtained GO sheets was done chemically by adding 1 M NaBH4 solution drop-wise in well sonicated GO sheets (dispersed in ethanol) till the effervescence of carbon dioxide disappears.
2.4. in situ synthesis of reduced graphene oxide and SnS2 nanocomposite (SnS2/RGO)
Graphene hybrid of SnS2 nanosheets were synthesized in a similar manner to that mentioned above, except a solution of 5 mg (or 10 mg) of as-synthesized graphene oxide (GO) powder in 10 ml of water (well dispersed by sonication) was added first to tin (IV) precursor solution before adding sulfur precursor solution to the reaction mixture. The stoichiometric molar ratio of SnS2:GO during the synthesis was SnS2/RGO either 1: 5.6 or 1:11.2, using 5 mg or 10 mg of GO respectively. The percentage loading of SnS2 in SnS2/RGO nanocomposites was calculated by comparing the weight with similarly synthesized RGO without SnS2 and was found to be ~50 wt%.
2.5. Instrument details
Powder x-ray diffraction (XRD) patterns of the as-synthesized products were collected at room temperature using a Bruker D8 Advance diffractometer system employing monochromatized Cu Kα radiation (λ = 1.54056 Å) source. Optical absorption measurements were carried out using a Perkin Elmer Lambda 35 UV–visible spectrophotometer. Transmission electron microscopy (TEM), phase-contrast high resolution TEM (HRTEM), selected area electron diffraction (SAED) and electron diffraction for x-ray analysis (EDAX) measurements were performed with a FEI Technai G2-20 transmission electron microscope operating at an accelerating voltage of 200 kV. Scanning electron microscopy (SEM) and EDAX measurements were performed with a JEOL JSM 6610 at 20 kV, width distance 10 mm and spot size 30 nm. EDAX was performed at a resolution of 135.2 eV. FT-IR spectra were recorded by KBr method in a Perkin Elmer FT-IR 2000 spectrophotometer. Raman spectra were recorded from a Renishaw Raman RM 1000 spectrometer (Renishaw plc, Gloucestershire, UK), equipped with a Leica research microscope. All measurements were performed at excited wavelength of 514.5 nm using an argon ion laser source (maximal output 20 mW).
2.6. Electrochemical analysis
Electrodes for supercapacitors were prepared by spin coating. A dilute and well sonicated dispersion of GO, RGO, SnS2 or SnS2/RGO nanoparticles in ethanol was spin coated over graphite sheets (250 μm thick) and dried in an oven at ~50 °C overnight. The weight of the electrode material (1 mg cm−2) deposited on the graphite sheet (cell assembly was 1 cm2), was determined by weighing the graphite sheet before and after the spin coating of the electrode material. 2 M Na2SO4 aqueous solution was used as an electrolyte for the device without any binder or additional carbon filler and two electrode geometry was chosen for the characterization of the capacitor cells. The electrochemical characterization of the capacitor cells was performed using cyclic voltammetry (CV), galvanostatic charge–discharge tests and electrochemical impedance spectroscopy (EIS). The CV and EIS responses were recorded with an electrochemical analyzer (660E, CH Instruments, USA) and the charge–discharge tests were performed at constant current using a charge–discharge unit (BT-2000, Arbin Instruments, USA).
In order to construct a symmetrical configuration of supercapacitor, polyprolene separator was used to soak liquid electrolyte and sandwiched between two symmetric electrodes. The cell configurations are as follows:
Cell#1: SnS2//SnS2; Cell#2: GO//GO; Cell#3: RGO//RGO; Cell#4: SnS2/RGO//SnS2/RGO
In the case of Cell#4, the molar ratio of SnS2:RGO was 1:5.6. Another Cell#4* was made by using the 1:11.2 molar ratio of SnS2:RGO, as mentioned in the synthesis subsection, to optimize the essential SnS2:RGO ratio for efficient electrochemical performance.
3. Results and discussion
3.1. Structure and morphology
The powder XRD patterns of as-synthesized SnS2 nanosheets and SnS2/RGO nanocomposites are compared with bulk pristine SnS2 in figure 1(a). All characteristic diffraction peaks in as-synthesized SnS2 and SnS2/RGO are well indexed to hexagonal structure of SnS2 (JCPDS # 23-0677, space group P3m1). The first hand important information obtained from XRD patterns is the intensity of the (100) plane, which is found to be higher than its intensity in bulk pattern as compared to (001) and (101) planes, revealing the growth of SnS2 nanoparticles along the 〈100〉 direction and hence possible formation of 2D hexagonal morphology of as-synthesized SnS2 nanoparticles. Raman spectra of as-synthesised SnS2, GO, RGO and SnS2/RGO are compared in figure 1(b), showing the characteristic modes of SnS2 and SnS2/RGO. The A1g mode of SnS2 is located at 314 cm−1, whereas the Raman spectrum of SnS2/RGO shows all three modes, A1g band, D band (1360 cm−1, ring-breathing mode from sp2 carbon rings, A1g mode) and G band (1585 cm−1, planar configuration sp2 bonded carbon with bond-stretching motion, E2g mode) [35]. Ratios of D peak intensity to G peak intensity (ID/IG) are 0.97 and 0.92 for GO and SnS2/RGO respectively. The larger value of ID/IG for GO is attributed to the abundant oxygen-based functional groups at the surface, accompanied by the decoration with hetero atoms (oxygen atoms), thus producing amorphous carbon. A reduced ID/IG ratio for nanocomposite is observed because of the decrease in defects and disorder in the hexagonal graphitic layer. Moreover, the oxygen functionalities at the surface of GO were diminished, resulting in a lower level of oxidation state, hence leading to the decreased value of ID/IG [36]. In figure 1(c), FT-IR spectra of as-synthesised GO, SnS2 and SnS2/RGO are compared. In case of GO intense broad peak of surface –OH groups at 3383 cm−1, vibration mode of water located at 1617 cm−1 and O-C stretching 1144 cm−1 were observed that were weakened in the FT-IR pattern of SnS2/RGO on the reduction of GO to RGO sheets and absent in SnS2 FT-IR spectrum. (see figure S1 in SI for comparison of XRD patterns, optical absorption, Raman and FT-IR spectra of as-synthesized GO and RGO [37].)
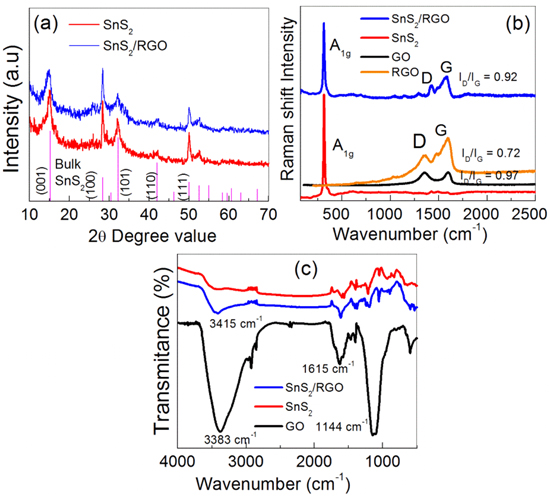
Figure 1. Characterizations of as-synthesised SnS2, SnS2/RGO, GO, and RGO. (a) XRD patterns of as-synthesised products. (b) Raman spectra of all four as-synthesized samples and (c) FT-IR spectra.
Download figure:
Standard image High-resolution imageMorphology, topography and crystal structure of as-synthesized SnS2 and SnS2/RGO are summarized in figure 2. Regular hexagons like morphology of as-synthesized SnS2 particles are obtained from hydrothermal approach (figure 2(a)), which could be termed as either nanoplatelet or nanosheet. Particle size distribution plot from TEM analysis shows the 120 nm average particle diameter of as-synthesized SnS2 nanoparticles (inset: figure 2(a)) and thickness is found to be ~30–40 nm as calculated from a few vertically aligned particles. Figure 2(b) is HRTEM image of the SnS2 flakes, which shows an extremely fine lattice fridges correspond to the reticular planes of hexagonal SnS2 lying flat on hexagonal facet  The 2D fast Fourier transform (2DFFT) calculated from panel '2b' is shown as inset, which further confirms the presence of (100) and (101) planes of hexagonal SnS2.
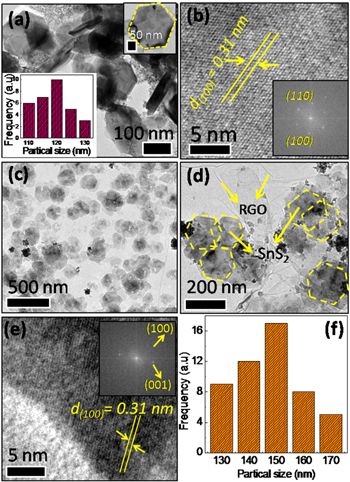
Figure 2. (a) Low resolution TEM image (inset: particle size distribution) and (b) HRTEM image (inset: calculated 2D-FFT) of as-synthesised SnS2 particles. (c), (d) low resolution TEM images of as-synthesised SnS2/RGO. (e) HRTEM image of SnS2 in SnS2/RGO (inset: corresponding 2D-FFT) and (f) particle size distribution plot of SnS2 nanoparticles embedded on RGO sheet.
Download figure:
Standard image High-resolution imageFigures 2(c), (d) are low resolution TEM images at different magnifications showing regular hexagon SnS2 nanoparticles embedded on RGO sheets. The flexible carbon skeleton of reduced graphene oxide helps in supporting the mesoporous SnS2 flakes. Since the thickness of the inorganic particles is very small and they are transparent, we term the SnS2 particles as nanosheets in our further discussions. More TEM images of as-synthesized GO, SnS2 and SnS2/RGO are shown in figure S2. Figure 2(e) (inset) shows the reciprocal space image obtained by Fourier transform of corresponding HRTEM image in figure 2(e), which further demonstrates the distinct hexagonal crystal structure of SnS2, showing the presence of (100) and (001) reticular planes with corresponding d values of 0.31 and 0.58 nm respectively. Wide range particle size 145–155 nm was obtained in SnS2/RGO sample (figure 2(f)). SEM images depict nanosheet-like clear topography of SnS2 and SnS2/RGO particles as summarised in figure 3. Very thin membrane-like morphology of graphene sheets in SnS2/RGO was easily visualized in the bottom image of SnS2 nanosheets as compared to their respective TEM images. EDAX analysis gives a 1:2 stochiometric ratio of Sn and S, whereas carbon and minute amounts of oxygen are also observed in the SnS2/RGO system as shown in figures 3(b), (d).

Figure 3. SEM analysis of as-synthesised SnS2 NSs and SnS2/RGO nanocomposite. (a), (b) SEM images and EDAX pattern of SnS2 NSs whereas (c), (d) are those of SnS2/RGO nanocomposite.
Download figure:
Standard image High-resolution image3.2. Optimized synthesis
Furthermore, to find out the best synthesis condition we have performed a number of controlled reactions at various conditions and the results are depicted in figure S3 (see SI). The synthesis using either SnCl2 or tin (IV) acetate as tin precursor with AOT as surfactant produced impure phase (figures S3(A), (B)). Hydrothermal synthesis with tin(IV) acetate and SDS at 180 °C for 10 h produced pure phase SnS2, but we obtained smaller particle size (figure S3(C)). Later on we replaced other tin precursors with tin(IV)bis(acetylacetonate) dichloride and kept AOT as the surfactant and carried out the synthesis at 180 °C for 6 h to produce SnS2 but with a minor amount of orthorhombic SnS as impurity phase (see figure S3(G) for all XRD patterns of corresponding control reaction conditions). The reaction time was increased to 8 h keeping the other parameters constant, resulting in the elimination of impurity phase and growth of particle size (figures S3(D)–(F)). The reaction time was further increased to 10 h, which is the optimized synthesis condition to get bigger nanosheets of SnS2 and well crystalline XRD pattern and was used for all charge storage studies.
3.3. Electrochemical studies of electrolyte
3.3.1. Conductivity, electrochemical stability window of electrolyte
In general, various liquid electrolytes, e.g. KOH, NaOH, H2SO4, etc, are considered as electrolytes in supercapacitors studies. But acidic and basic electrolytes are known to deform or corrode the electrodes depending on the materials used; hence, the cyclic performance of the devices is deteriorated. Therefore, in the present study Na2SO4 has been chosen as suitable electrolyte due to its neutral nature, which shows good cyclic performance in comparison to acidic and basic electrolytes. At first, the ionic conductivity of Na2SO4 electrolyte has been measured at room temperature (∼25 °C) by complex impedance spectroscopy using a stainless steel electrode and the results are shown in figure 4(a). From the lower portions of impedance plots, the values of Rb (tabulated for different concentrations in table S1) have been determined and the conductivity was calculated using the expression:

where t/A is cell constant of conductivity cell (∼0.4 cm−1) and Rb is the bulk resistance of electrolyte. The variation of conductivity values for different molar concentrations is shown in figure 4(b). Initially the ionic conductivity of Na2SO4 solution increases linearly with increasing concentration and it becomes saturated at 2.0 M electrolyte concentration due to ion pairing and/or crystallization. Thus, for the device application in electrochemical storage, 2.0 M Na2SO4 has been chosen as it has best ionic conductivity.
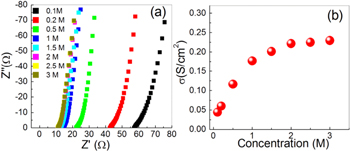
Figure 4. (a) Nyquistic plot and (b) conductivity versus concentration plot of Na2SO4 electrolyte at different concentrations.
Download figure:
Standard image High-resolution image3.3.2. Electrochemical characterization of capacitors
The comparative impedance spectra (Nyquist plots) of the supercapacitor cells with 2.0 M Na2SO4 electrolyte are measured for the frequency range 10 mHz–100 KHz and shown in figure 5. The imaginary part of impedance (Z'') raises by steep at low frequency region in all the electrodes, which indicates the capacitive nature of all the cells (figure 5(a)). The ideal impedance behavior of a pure capacitor is a straight line parallel to the imaginary axis Z'', whereas in practical capacitors, the steep rising capacitive impedance response is observed in the low frequency region, accompanied at high frequency by semicircular features, owing to the bulk and interfacial properties of the capacitor cell. Such impedance responses enable the evaluation of various parameters associated with bulk properties of electrolytes and electrode–electrolyte interfaces such as charge-transfer resistances, potential-dependent faradaic resistances, and low frequency capacitance values, etc. The expanded part of the impedance responses in the high frequency region (figure 5(b)) shows the semicircular arcs, which give the bulk resistance and electrode–electrolyte charge-transfer resistance and bulk properties of the cells. The values of bulk resistance Rb and interfacial charge-transfer resistance Rct of the different capacitor cells can easily be evaluated from the intercepts on the real axis of the impedance responses as shown in figure 5(b). The values of Rb, Rct, and overall cell resistance (R) of the cells are listed in table 1. It is noticeable that the RGO electrodes offer low values of resistive components compared with GO electrodes, which is due to the presence of fewer functional groups in and higher conductivity of RGO electrodes [38]. When the GO has stacked over SnS2 in the hydrothermal process, GO has been reduced to RGO and formed SnS2/RGO nanocomposite. Such electrodes also show lower values of resistive component in Cell#4 as compared to Cell#1.
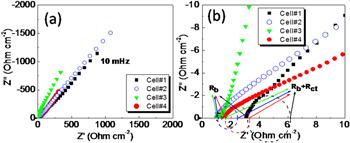
Figure 5. (a) EIS plots of different EDLC cells recorded at room temperature in the frequency range from 100 kHz to 10 mHz; (b) Expanded representations of the impedance plots in the high frequency region.
Download figure:
Standard image High-resolution imageThe rate capability is an important aspect of consideration in designing a high power supercapacitor for pulse power application, which is evaluated from the EIS studies [39, 40] in terms of response time (τo); τo has been determined according to Miller's approach [40], being the reciprocal of a response frequency (fo) evaluated from Bode plots. Figure S4 depicts the Bode plots (i.e. Z' and Z' versus frequency) for all the supercapacitor cells. The response frequencies (fo) (hence, response times τo), estimated at the frequency where Z' and Z'' are equal, are listed in table 1. A lower value (∼0.062 s) of the response time (τo) has been observed for the RGO-based cell (Cell#3) as compared to that for the GO-based cell, Cell#2 (∼0.198 s). This indicates that the electrolyte ions have faster switching behavior across the electrode/electrolyte interface formed by RGO electrodes as compared to the GO electrodes. This confirms the higher power delivering ability of Cell#3 (RGO-based cell) over the Cell#2 (GO-based cell). A comparison of the rate performance of Cell#1 (with SnS2 electrodes) and Cell#4 (with SnS2/RGO electrodes) indicates the lower response time, τo (table 1) and hence higher rate performance of SnS2/RGO-based cell. In addition to this, Rb and Rct values were again measured using equivalent circuit diagram (Z-view software). Interestingly, in both cases the values are almost equal (table 1). The fitted equivalent circuit diagram for Cell#4 is given in SI (figure S5).
Table 1. Various electrical parameters of supercapacitor cells from the impedance analysis.
| Response at ϕ ≈ 45° | Z- view measurement | ||||||
|---|---|---|---|---|---|---|---|
| Cells | Rb (Ωcm2) | Rct (Ω cm2) | R (Ω cm2) | Frequency (Hz) | Time (sec) | Rb (Ωcm2) | Rct (Ω cm2) |
| Cell#1 | 3.07 | 3.11 | 880 | 4.27 | 0.234 | 2.97 | 3.02 |
| Cell#2 | 1.03 | 1.45 | 1079 | 5.15 | 0.198 | 0.94 | 1.32 |
| Cell#3 | 0.97 | 0.38 | 338 | 10.07 | 0.062 | 0.88 | 0.35 |
| Cell#4 | 1.53 | 1.81 | 307 | 10.75 | 0.093 | 1.66 | 1.17 |
Supercapacitor cells were characterized by cyclic voltammetry to identify the possible redox reaction(s) at electrode/electrolyte interfaces as shown in figure 6. The CV studies were performed at different scan rates in the potential range from 0 V to 1.0 V. It could be noted that redox peaks i.e. oxidation and reduction hump peaks in CV pattern of Cell#1 are clearly visible at low scan rates (figure 6(a)). It is also noticeable that the separation between oxidation and reduction peaks increases with increasing scan rate. Such redox peaks almost disappear in the SnS2 based cell (Cell#1) when the CV pattern is recorded at high scan rates (figure 6(b)). Graphene is a highly porous and electrically conducting carbon material, reported in literature as EDLC electrodes [39, 41]. Generally, rectangular cyclic voltammograms are observed for such EDLCs [12, 42]. In the present studies, almost rectangular CV patterns are observed at low and high scan rates (figure 6(c)) for Cell#2. Better rectangular and large CV area is observed for Cell#3 (figure 6(d)) when highly conducting RGO electrodes are used. When nanocomposite SnS2/RGO is applied as electrodes in Cell#4, rectangular CV pattern is observed at low scan rates, and slightly deviated at high scan rates (figures 6(e), (f)). The voltammetry current significantly increases when SnS2/RGO nanocomposite is employed in supercapacitor electrodes.

Figure 6. Cyclic voltammograms of the capacitor cells at different scan rates using Na2SO4 (2.0 M) electrolyte. (a) CV curves of Cell#1 at 0.5, 1.0 and 5 mVs−1 and (b) at higher scan rate of 50, 100 mVs−1 respectively. (c)–(d) CV curves for Cell#2 (GO) and Cell#3 (RGO) at 10, 50, 100 mVs−1. (e)–(f) are CV curves for Cell#4 (SnS2/RGO) at scan rates of 5, 10 and 20, 50, 100 mVs−1 respectively.
Download figure:
Standard image High-resolution imageFor further charge storage characterization of each cell, the galvanostatic charge–discharge measurements of all cells have been carried out at a constant current of ∼0.5 Ag−1 at room temperature (figure 7(a)). The discharge characteristics of the cells are observed with capacitive nature as characterized by almost linear discharge patterns of the cells. The Cell#1 has been charged up to 0.8 V as shown in figure 7(a); after that a large plateau region is observed which reduces the columbic efficiency of the cell. We have recorded the charge–discharge measurements for Cell#4 in different potential windows. An almost linear pattern was observed for the charging voltage up to 1.0 V and after that reduced columbic efficiency of the cell was observed (see figure S6). The values of internal resistance (or ESR) has been evaluated by the initial sudden drop in the discharge profile and a more than twofold decrease in ESR found when SnS2/RGO (Cell#4) electrodes are employed to fabricate supercapacitor cells, with respect to the values for Cell#1 (table 2). The discharge specific capacitance (Csp) values have been estimated from the discharge characteristic regions using the expressions:


where i is the constant discharge current, Δt is the discharge time interval for a voltage range ΔV, and m is the mass of a single electrode without current collector. The values of Csp have been listed in table 2. GO and RGO electrodes offer lower values of specific capacitance and hence lower specific energy. Relatively higher values of specific capacitance have been obtained for Cell#1 with SnS2 electrodes, as compared to Cell#2 and Cell#3. About 14 to 30 times enhancement with respect to GO/RGO electrodes and about 5 times increase with respect to pure SnS2 electrodes have been observed in specific capacitance of SnS2/RGO electrodes based cell (Cell#4). This indicates the synergetic effect of electric double layer formation due to large surface area RGO and pseudo-capacitive (Faradic) nature of SnS2 at the electrode–electrolyte interface. Such a configuration of symmetric hybrid supercapacitor composed of SnS2/RGO has been reported by us for the first time and shows high values of specific capacitance. The pseudo-capacitive nature of SnS2 and double layer formation by GO/RGO have been confirmed by CV patterns of Cell#1, Cell#2 and Cell#3, as discussed earlier. The SnS2 based cell (Cell#1) shows pseudo-capacitive behavior as redox peaks appear in its CV pattern (figure 6(a)), while GO and RGO-based cells (Cell#2 and Cell#3) show no such effect (figures 6(c), (d)).

Figure 7. (a) Comparative galvanostatic charge–discharge profile of different capacitor cells at 0.5 Ag−1 at room temperature. Specific capacitance (Csp) of Cell#1 (b) and Cell#4 (c) as a function of charge–discharge cycles. Inset: charge–discharge profile at 2.0 Ag−1, (d) Cyclic voltammograms of Cell#4 at 20 mVs−1 for 1000 cycles to show the cell's stability, with negligible degradation. (e) Charge–discharge curves of the SnS2/RGO two electrode cell at different current densities (0.5, 0.8, 1.0, 1.5, 2.0, 2.5 and 3.0 Ag−1). (f) Ragone plot of the SnS2/RGO hybrid supercapacitor. The energy density and power density were calculated from the charge−discharge curves at various current densities.
Download figure:
Standard image High-resolution imageTable 2. Various parameters evaluated from charge–discharge curves at a current density 0.5 Ag−1 at 25 °C.
| Cells | ESR (Ω cm2) | Csp (Fg-1) | Specific Energy (Wh kg-1) | Specific Power (W Kg-1) |
|---|---|---|---|---|
| Cell#1 | 634 | 93.8 | 3.22 | 197 |
| Cell#2 | 95 | 16.2 | 0.56 | 1304 |
| Cell#3 | 68 | 34.9 | 1.18 | 1838 |
| Cell#4 | 256 | 500 | 16.67 | 488 |
Figures 7(b), (c) show the capacitance variation as a function of charge–discharge cycles for Cell#1 and Cell#4 at constant current 2.0 Ag−1 (see figure S7 for charge–discharge cycles of Cell#2 and Cell#3). 20% fading in initial charge–discharge cycles has been observed up to ∼100 cycles for Cell#1 (with SnS2 electrodes), thereafter it shows stable performance. This initial fading in specific capacitance was substantially reduced to ∼5% (i.e. 95% retention) when SnS2/RGO-based (Cell#4) was used for 1000 cycles (figure 7(c)) in the two electrode measurement. The reason for fading could be explained as follows. Generally, more cycles are reported for the EDLC cells rather than few thousand cycles (1000–2000) for pseudocapacitor materials like WS2 [25], CoS2 [26], Co3O4 [9] and NiS [43]. Since our system is a hybrid supercapacitor model with prevailing synergetic effect of pseudocapacitance in the RGO/SnS2 electrode as well as EDLC, there will be redox reactions at the interface of electrode and electrolyte instead of only insertion and extraction of ions. The van-der-Waals gap between the two layers of hexagonal sulphur coordinated tin is 0.59 nm. The ionic radii of Na+ ions is 0.116 nm, so Na+ ions of electrolyte can be easily inserted/extracted between SnS2 layers. Since the transition metal sulphides are less stable in comparison to transition metal oxides, the possibility of complex formation [44] i.e. Na15Sn4 (explored in the mechanism section) with aqueous Na2SO4 after a few thousand GCD cycles is more likely, blocking the intercalation space between the two layer of SnS2; this may also occur due to evaporation of the aqueous matrix. These processes lead to decrease in efficiency or reduction in specific capacitance value after long cycles. However, we chose not to prefer organic or ionic liquid electrolytes as these electrolytes suffer from high cost, limited ionic conductivity and high toxicity, which limit their wider application [45]. In the case of SnS2/RGO composite electrodes, the insulating Na15Sn4 is formed but gets distributed on large surface areas of RGO, whereby RGO acquires a connecting pathway for charge-transfer. The cyclic performance of Cell#4 has also been examined by cyclic voltammetry, recorded CV up to 1000 cycles at a scan rates of 10 mV s−1 (figure 7(d)). No noticeable deviation in CV pattern has been observed from its rectangular pattern even up to the 1000th cycleu, demonstrating the stability of the cell.
The other important parameters—namely, specific energy (E) and specific power (P) have also been evaluated using the following expressions [23]:


where Ccell is the capacitance of the cell (in Fcm−2), V is the voltage excluding the equivalent series resistance (ESR) occurring at the beginning of the discharge profile of the cell, and m is total mass loading of active electrode material. The values of specific energy and specific power of all the cells, evaluated respectively from equations (4) and (5), are listed in table 2. A substantial (∼5 times) enhancement in the specific energy and more than 2 times in specific power have been observed when SnS2-electrodes are replaced by nanocomposite SnS2/RGO. The charge–discharge profile of Cell#4 at different current density is shown in figure 7(e). Furthermore, we have calculated the gravimetric capacitances as a function of specific current from figure 7(e) and shown in figure S8. The Ragone plot (i.e. E versus P) for Cell#4 is depicted in figure 7(f), which shows a typical behaviour of a power source like supercapacitor [46]. The observed specific capacitance, energy and stability of the present configuration of the Cell#4 is sufficiently high as compared to that of existing Sn-based or S-based supercapacitors [25–28, 31–33, 47–49] demonstrating its potential usefulness.
Further, to ensure the sufficient stoichiometric ratio of SnS2:GO in SnS2/RGO, another capacitor cell (Cell#4*) has been fabricated as narrated in the experimental section. This cell shows the lower value of specific capacitance (Csp ∼ 175 F g−1) in galvanostatic charge–discharge (figure S9) as compared to Cell#4 (Csp 500 F g−1). This indicates the SnS2/RGO composite is appropriate and sufficient to obtain the high value of specific capacitance and hence specific energy.
3.3.3. Investigation for the charge storage mechanism
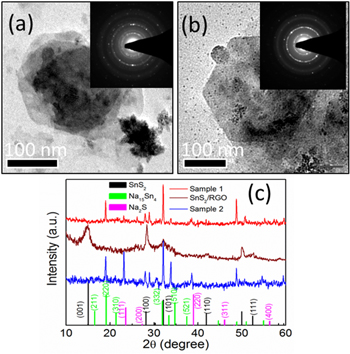
The hybrid supercapacitor Cell#4 shows high capacitance value due to RGO along with SnS2 NSs forming a porous structure, making the diffusion of Na+ in the electrolyte easier. Furthermore, Na+ can easily be inserted/extracted between interlayer gaps of SnS2 layers and easy intercalation could occur between the (100) SnS2/RGO layers, finally ending up with impressive hybrid supercapacitance values and stability up to 1000 cycles. To check the redox reactions and the product formed after the end of the charge–discharge cycles, we have carried out extensive characterization (XRD, TEM, SAED and EDAX) on the electrode materials scratched from graphite substrates. To ensure our study, we have considered two cells of SnS2/RGO after 500 cycles (Sample 1, 2) and their XRD patterns, TEM images and corresponding SAED patterns are given in figure 8. Figures 8(a), (b) show the retention of hexagonal morphology of SnS2 NSs at 500 charge–discharge cycles and corresponding SAED patterns (inset) give distinctive rings of SnS2, Na2S and of Na15Sn4 in both the cells. XRD patterns (figure 8(c)) shows weakening in peaks (100, 101, 110 and 111) of original SnS2 due to the decay of SnS2 along with the formation of alloy Na15Sn4 (211, 220, 310, 332, 510 and 521) and Na2S (111, 200, 220, 311, and 400) phases. Thus from this experimental evidence we propose the following reaction occurred at the electrodes:

The overall reactions taking place between electrode and electrolyte are as follows:


The Faradaic reactions and products occurring in the present case are similar to reactions and products obtained in the theoretical calculations [35, 50] in LIBs/NIBs during charging and discharging processes when SnS2/RGO was used as anode material and Na+ as electrolyte cation. However, we do not observe any intermediate such as Na2S2, due to the very fast charging-discharging process in hybrid supercapacitor Faradaic redox reactions.
Figure 8. (a), (b) TEM images of two set of cells (sample 1 and sample 2) as obtained from electrode material of Cell#4 after 500 charge–discharge cycles showing retainment of hexagonal morphology of SnS2 nanoparticles, inset: SAED pattern of sample 1 and sample 2 respectively. (c) XRD patterns of sample 1 (red) and sample 2 (blue) compared with as-synthesized SnS2/RGO and bulk XRD patterns of SnS2, Na15Sn4 and Na2S.
Download figure:
Standard image High-resolution image
4. Conclusions
In summary, a nanocomposite of 2D hexagonal nanosheets of SnS2 with reduced graphene oxide was synthesized and investigated for the first time as a superior hybrid supercapacitor material. Here eco-friendly and low cost nanocomposites were synthesized in situ under hydrothermal conditions. It is emphasized that as-synthesized SnS2/RGO nanosheets exhibited hybrid capacitor behavior with specific capacitance value of 500 F g−1, energy density of ~16.67 Wh kg−1 and power density of ~488 W kg−1. A high retention in charge–discharge cycles (measured up to 1000 cycles) was observed on graphene nanocomposite formation as compared to bare SnS2 nanosheets. The layered structure, specific 2D morphology and enhanced electron mobility of stacked graphene sheets with SnS2 nanosheets led to excellent supercapacitor behavior of the electrode material. Nanocomposite (SnS2/RGO) electrodes are believed to demonstrate a synergistic effect drawing contributions from both EDLC and pseudocapacitance charge storage mechanisms. All these attractive features of simply synthesized SnS2/RGO nanosheets make this a promising electrode material for symmetric hybrid supercapacitors.
Acknowledgments
H C and M K thanks UGC-India for providing Senior Research Fellowship. S D gratefully acknowledges the financial support received from CSIR-India (01(2773)/14/EMR-II) and Dr R Nagarajan for providing XRD facility. Authors thank USIC-DU and AIIMS EM facility for characterization.