
Abstract
Nitric oxide (NO) is often used for the passivation of SiC/SiO2 metal oxide semiconductor (MOS) devices. Although it is established experimentally, using XPS, EELS, and SIMS measurements, that the 4H-SiC/SiO2 interface is extensively nitridated, the mechanisms of NO incorporation and diffusion in amorphous (a)-SiO2 films are still poorly understood. We used density functional theory (DFT) to simulate the incorporation and diffusion of NO through a-SiO2 and correlate local steric environment in amorphous network to interstitial NO (NOi) incorporation energy and migration barriers. Shapes and volumes of structural cages in amorphous structures are characterised using a methodology based on the Voronoi S-network. Using an efficient sampling technique we identify the energy minima and transition states for neutral and negatively charged NOi molecules. Neutral NOi interacts with the amorphous network only weakly with the smallest incorporation energies in bigger cages. On the other hand  binds at the network sites with wide O–Si–O bond angles, which also serve as the intrinsic precursor sites for electron trapping.
Export citation and abstract BibTeX RIS

Original content from this work may be used under the terms of the Creative Commons Attribution 4.0 licence. Any further distribution of this work must maintain attribution to the author(s) and the title of the work, journal citation and DOI.
1. Introduction
Silicon Carbide (SiC) is a wide band gap semiconductor with great potential for high power and frequency applications in MOSFET devices. [1] Amorphous (a)-SiO2 is the native oxide of SiC and is often used as a gate oxide in such devices. Applications of SiC based MOSFETs are hampered by a high concentration of interface defects [1]. High temperature anneal in NO gas is often used to passivate defects in SiC/a-SiO2 devices. This has been shown to reduce the density of interface defects by around 99% [2, 3]. The NO molecule is thought to passivate defects (e.g. O vacancies, C dangling bonds and C–C clusters which result from the oxidation process [4, 5]) in the near interface region through nitridation and does not penetrate deep into the SiC [6]. The specific mechanism of passivisation is unknown but it is thought that the NO makes bonds [7] with defects and shifts or removes harmful defect levels in the a-SiO2 band gap [2]. However, the diffusion mechanism by which the NO molecule negotiates the oxide network to reach the near interface region remains unknown.
How small molecules interact with an amorphous silica network and migrate through the network can be addressed at an atomistic level using computer simulations. However, modelling amorphous materials requires extensive statistics as they contain a vast number of local environments compared to their crystalline counterparts. A widely accepted approach to model amorphous SiO2 relies on using periodic super-cells and molecular dynamics (MD) to simulate a melt and quench procedure (see e.g. references [8, 9]). This procedure creates a disordered continuum random network and has been used to great success in the identification of the structural and defect properties of a-SiO2 [9, 10]. However, probing statistically meaningful number of molecular configurations in amorphous structure requires either using a large number of small structures or very big (million atom) cells. The latter is possible only using classical inter-atomic potentials (IPs).
Migration of small molecules through an amorphous network has been considered in several previous studies. An extensive study of the migration of O2 in the amorphous silica network has been carried out using IPs fitted to model the interaction between SiO2 and O2 [11]. A number of minima were found using first principle calculations and energy barriers between them calculated using the IPs. The distributions of the minima, highest and lowest barriers and the saddle points associated with them were determined. The saddle points have energies between 0 and 5 eV with the modal peak just above 1 eV. This study provides some useful clues as to how small nitrogen containing molecules can behave in a-SiO2 in the neutral charge state. In addition, the NO molecule can become negatively charged close to the SiC/SiO2 interface via electron transfer from SiC, by analogy with the Mott–Cabrera mechanism of silicon oxidation [12].
The incorporation and diffusion of NH, N, NO, N2 in α-quartz has been modelled in reference [13] using DFT. For NO the literature shows that in the neutral and positive charge states there is no electrostatic interaction with the lattice. However, in the negative charge state the NO interacts with two nearest silicon atoms electrostatically, without charge transfer between the N and the Si.
Simulations of the incorporation and diffusivity of nitridating species in the amorphous phase used 72 atom cells of a-SiO2 [14]. Bakos et al [14] have shown that NO is mobile in both the neutral and negative charge states and suggested that diffusion may slow down if the NO were to become negative, due to the increased electrostatic interaction with the lattice. However, no correlation of the steric environment of the amorphous oxide and the incorporation energy was found.
Here we build upon the previous experimental and theoretical work to analyse the incorporation and diffusion of NO in a-SiO2 using DFT simulations. We aim to elucidate how the incorporation energies and migration barriers of neutral and negatively charged NO molecules correlate with the structural characteristics of local environment such as cage and ring sizes.
2. Methodology
An ensemble of 30 a-SiO2 structures was produced by performing classical molecular dynamics (MD) melt-quench simulations on 216-atom periodic cells of bulk SiO2 using the method outlined by Patel et al [15]. Briefly, the MD melt-quench was performed with the ReaxFF force field implemented in the LAMMPS code [16, 17], using an NPT ensemble and a cooling rate of 6 Kps−1. The ion positions and lattice vectors of the MD structures were then relaxed using the DFT as implemented in CP2K using the PBE0-TC-LRC functional [18–21] with a 2 Å truncation radius and 25% Hartree–Fock exchange. The DZVP-MOLOPT basis set and a converged plane wave cut-off of 550 Ry were used. The efficient calculation of exchange integrals was facilitated by application of the ADMM approximation [22]. The models generated by this procedure have densities ranging between 2.100 g cm−3 and 2.286 g cm−3.
A single 216-atom periodic cell with a density approximately equal to the mean density of the parent population (2.2 g cm−3) was selected for further studies. All sites present in this structure were then sampled using the scheme shown in figure 1. A sampling grid of initial positions of NO was created by taking the centre point between 3 out of the 4 oxygen atoms forming all faces of each 72 SiO4 tetrahedra. NO molecule is then placed along the vector between the mid-point of the face and the Si-atom at the distance equal or greater than 1.5 Å away from the network atoms and the Si atom (see red arrow in figure 1). Placing the molecule with N or O towards the Si atom does not change the results. Placing the molecule at distances <1.5 Å leads to unphysical network relaxation and if the NO is placed further away, the adjacent grid points become too close to one another hence reducing sampling.
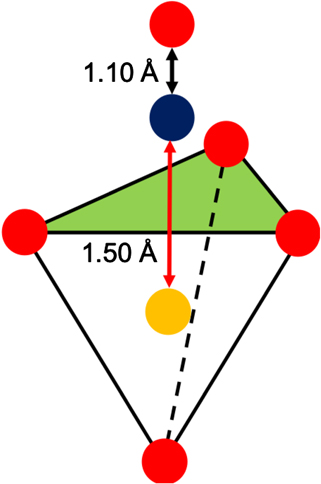
Figure 1. A schematic representation of the sampling scheme. The green triangle represents the face of the SiO4 tetrahedra being sampled, the red arrow represents the vector between the Si and the N and the black arrow represents the vector between the N and the O which is 1.1 Å away from the N atom. Colour coding: Si in yellow, N in blue and O in red.
Download figure:
Standard image High-resolution imageThis procedure results in 187 initial configurations. The atomic positions of these structures are relaxed in the neutral and negative charge states using the DFT setup described above. The calculations of  were carried out in the triplet state. This is shown to be the ground state and is in agreement with the previous work [13, 14]. The NO incorporation energy into amorphous network is then calculated using the standard formalism by Northrup and Zhang [23],

where Eds is the energy of the system with incorporated NO, Ebulk is the energy of the perfect system, μs is the chemical potential of NO, Ev is the energy of the valence band maximum, μe is the Fermi level position and q is the defect charge. We apply the Lany–Zunger charge correction to the calculations done in the negative charge state [24]. As the chemical potential we use the total energy of NO molecule in the gas phase at 0 K.
The relaxed configurations of the NO interstitial (NOi ) then give initial and final states for diffusion trajectories calculated using a climbing image nudged elastic band (CI-NEB) method implemented in the CP2K code [25]. These trajectories were then classified by analysing the steric crowding at the transition state usually situated at the centre of a ring. The usual definition of a ring in a-SiO2 network is denoted by the number of Si–O units [26–28]. As we show below, the minima for the geometry optimisation of NOi are a set of cages such as the one shown in figure 5. These cages are made up of rings and so to move between them the molecule has to traverse these rings. The 6-member ring is the most prevalent [29], so 4 trajectories were selected representing the range of possible 6-member ring geometries, then 2 of both 5- and 7-member rings were probed using the same logic but in this case bracketing the most and least strained variants. The distributions for cage volumes, ring size, O-Si–O bond angles and Si–O bond lengths are given in the supplementary information (https://stacks.iop.org/MSMS/29/035008/mmedia) (figures S1–S4 respectively).
Ring sizes smaller than 4 are not considered as they cause non-physical breakage of the network on geometry optimisation and paths through them are not seen by the linear interpolation algorithm within CP2K. It should be noted that closed Si–O paths greater than 7 members cannot be called bottlenecks within the system as they generally span the diameter of a cage. By choosing a relaxed structure at either side of a ring, the minima are then connected in the NEB calculations and the barrier calculated using the CI-NEB method. It should be noted that this limited sampling is aimed to probe the structural motifs the NO molecule might encounter on its journey to the interface.
In order to identify the above mentioned cages, we have used a methodology based on the Voronoi S-network, which is a generalization of the Voronoi–Delaunay tessellation for multicomponent systems [30–33]. This approach has been used in the past to identify regions of empty space in semiconducting alloys [34], to study density fluctuations in supercooled liquids [35–37] and even to investigate proton diffusion in water [38]. The relevant methodological details can be found in references [30, 35]; for the purposes of this discussion it is important to note that the size distribution of the cages—and indeed, broadly speaking, the identification of empty space within disordered systems such as amorphous solids—is not unique. The methodology we have used relies chiefly on two parameters, RP and RB (see reference [35]), which determine the minimum size of the cage and the minimum contact area between two cages to be considered as one, respectively. Thus, we have verified that different choices in terms of either RP or RB do not impact any the qualitative trends reported in section 3.1. Importantly, our methodology provides direct access to the volume of the cages and it allows to unequivocally assign a given cage to an interstitial NO molecule.
3. Results
3.1. Interstitial NO configurations
In the neutral charge state, the geometry relaxation of NO in a-SiO2 demonstrates that the NO molecules are accommodated in cage like structures. The extensively sampled silica periodic cell gave a range of incorporation energies from −0.05–3.1 eV (see figure 2). The negative incorporation energy comes from a small attractive dipole interaction between the partially negative N and a partially positive network Si. We note that previous calculations in α-quartz have shown that there is an energetic cost of around 3.5 eV for the incorporation of O2 [11]. This has been attributed to the smaller cage volumes (33  ) in the material. [11] This has been used to understand why interstitial O2 has not been observed in α-quartz. In a-SiO2, however, the distribution of cage volumes ranges from approximately 25
  to 250
  , with an average of around 65
  [11, 39]. In the amorphous phase the incorporation energy of O2 drops to almost 0 eV in the largest of these cages [11]. Since NO and O2 are similar in many ways, one can expect similar results. The distribution of NO incorporation energies in the neutral charge state is shown in blue in figure 2. The three peaks in this distribution can be qualitatively linked to the size of the cage in which
  resides. It shows that the larger the cage the lower the relative energy of the
  , similar to the conclusions drawn for O2.

Figure 2. The formation energy distribution of the neutral and negative interstitial. Both show a range of around 3 eV. Neutral charge state in blue and negative charge state in orange. All formation energies are referenced to the valence band edge of the cell of a-SiO2 used in the sampling and are stated at this Fermi level position.
Download figure:
Standard image High-resolution imageFigure 3 shows the lowest and highest energy minima that were captured by the Voronoi–Delaunay analysis. The method finds that there is an inverse correlation in the incorporation energy of the NO with respect to the volume of the cage. The shape of a cage in which NO is situated and the orientation of the molecule are important factors when determining the incorporation energy. When the long axis of the NO molecule is aligned with the long axis of the cage (figures 4(a) and (c) ) the incorporation energy is lower than when these axes are perpendicular to one another (figures 4(b) and (d)). This clearly means that the free space in the network is not spherical as this would result in no orientation dependence.

Figure 3. The highest (squares) and lowest (triangles) incorporation energies for interstitials that are found in the cages as determined by the Voronoi–Delaunay tessellation analysis. This energy dependence is based on the orientation of the molecule with respect to the cage.
Download figure:
Standard image High-resolution image
Figure 4. Two examples of the cage structures that form the minima in the exhaustive sample and the lowest [(a) and (c)] and highest [(b) and (d)] energy NO interstitials for both cages. The asphericity delta value for each of these cages is 0.22 [(a) and (b)] and 0.01 [(c) and (d)]. The difference in incorporation energy for each of the cages is 0.19 eV [(a) and (b)] and 0.06 eV [(c) and (d)]. Colour coding Si yellow, N blue and O red.
Download figure:
Standard image High-resolution imageThe asphericity delta is a value that describes how spherical a cage is. Figure 4 shows two of the cages found in the analysis. The cages in figures 4(a) and (b) have delta values of 0.22 and are less spherical than the cages in figures 4(c) and (d) (delta = 0.01). The incorporation energy difference between the highest and lowest energy interstitial in the more spherical cages is 0.06 eV and the less spherical cages is 0.19 eV. The higher energy interstitials have a misalignment of the long axes of the molecules (parallel to the N–O bond) with cage axes, but for more spherical cages the energy penalties are lower.
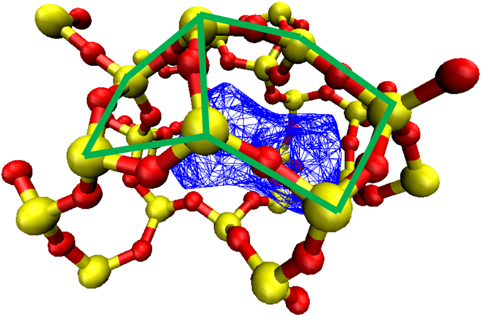
Figure 5. An example of the cage structures that form the minima in the exhaustive sample. The blue surface is found using the cage analysis software detailed above. The green line signifies 2 interlinking rings that make up the cage and so the NO has to move through to progress from cage to cage. Colour coding Si yellow and O red.
Download figure:
Standard image High-resolution image3.2. NO− incorporation
The 0/-1 charge transition level of the NO interstitial is located at an average of 4.35 eV above the valence band of a-SiO2. The Fermi level of the SiC/a-SiO2 device is in the centre of the a-SiO2 band gap (≈4.5 eV above the valence band of a-SiO2) which means that NOi
may become negatively charged as soon as there is an electron available. For example, at distances below ≈2 nm from the SiC/a-SiO2 interface electrons can tunnel from the SiC valence band or conduction band to the NO at reasonable rates. Therefore, one can expect the presence of  near the interface.
In the negative charge state, the incorporation energies of  range between 2.05 and 5.75 eV (figure 2 orange) when calculated at the valance band. This is due to the electrostatic interaction between the
  and the network. In the majority of cases the nitrogen of the
  is located around 2
  from a network silicon (figure 6). This is similar to the Si–N distance found in the literature [13]. The electrostatic interaction is accommodated by the flattening of the face of an SiO4 tetrahedra (figure 6). This occurs by the oxygen atoms moving into the plane of the Si. The
  molecules in these minima have a closer Si–N distance than in the neutral charge state, due to the extra electrostatic interaction with the network.

Figure 6. The majority interaction of the NO−. The N interacts with the SiO4 tetrahedron, akin to the negative NO in the literature, flattening a face of the tetrahedron. Color coding is the same as figure 5.
Download figure:
Standard image High-resolution imageYet another configuration is formed when  comes across a wide O–Si–O bond angle site (see figure 7). It has been shown in reference [40] that sites with an O–Si–O bond angle greater than 132° can trap electrons in strongly localized states located deep in the band gap. The fully optimised a-SiO2 structures considered here are denser and have a more narrow O–Si–O angle distribution than those studied in reference [40]. The spontaneous electron trapping in these structures takes place at precursor sites with O–Si–O angles exceeding 119°. Such sites represent the tail of the bond angle distribution for a-SiO2.
  ions strongly interact with the Si of the wide bond angle site, with a Si–N distance of 1.5 Å. Figure 7 shows that the spin density in this configuration is mostly localized on the
  , with is a small amount on the network atoms.
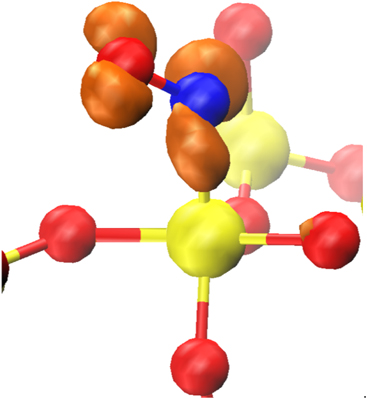
Figure 7. The geometry and spin density of the interaction between NO and sites with O–Si–O bond angles of greater than 119°. Color coding same as figure 5.
Download figure:
Standard image High-resolution image3.3. NO diffusion
Continuum random network a-SiO2 structures are often characterized by so called ring statistics (see e.g. [29]). These are defined as closed paths of some number of Si–O bonds (or Si atoms) for which it is also true that there is no other path between any pair of atoms in the ring which has fewer bonds than the shorter path between them along the ring. Such closed structures with 5, 6 and 7 Si–O units (example highlighted in blue in figure 8(c)) have been shown to be the three most prevalent ring sizes in a-SiO2.

Figure 8. The changes in bond length between a 5 and 6 membered ring transition. The blue line in (a) and (c) illustrates the definition of ring used in this work. Reproduced with permission from [41]. [© 2019 by Trans Tech Publications Ltd.].
Download figure:
Standard image High-resolution imageFigure 5 shows that the cages found by the analysis method described above can be viewed as made up of interlinked rings. We hypothesized [41] that the NO molecule must traverse these rings in order to diffuse through the network to the interface. Therefore we calculate the barriers to pass through the rings to find the path of the NO through the a-SiO2 network. The stable NO positions described in the previous section are used as the start and end points of the NEB calculations. These positions in cage structures are between 3 and 5 Å apart with a ring near the middle of the migration path.
The barrier height for migration depends on the size of the ring. The energetic barrier for migration through a ring increases with decreasing ring size as shown in figure 9, but there are large variations between barriers through rings of the same size caused by differences in the steric environment of each ring. This is discussed in more detail in reference [41].

Figure 9. Barrier heights of 5, 6 and 7 membered rings in a-SiO2 in the neutral (triangles) and negative (squares). The average increase in barrier height from neutral to negative is 0.2 eV.
Download figure:
Standard image High-resolution image
We observe large variations in the migration barriers. There is less space for migration through 5 and 6 member rings and a large energetic difference between these ring sizes. Figures 8(a) and (b) show the initial and transition states for migration through the 6 member ring. The ring distortion in the transition state can be characterized by a breathing motion, where the largest change in Si–O bond length is from 1.62 Å to 1.64 Å. For the transfer through the 5 member ring (figures 8(c) and (d)) there is still a breathing mode but the distortion is even more drastic, with the largest change in bond length being from 1.64 Å to 1.71 Å. This is caused by the further decreased free space and reduced diameter of the ring and results in the increased barrier for migration [42].
For  , there is a greater increase in the barrier height through the 5 and 6 member rings (figure 9). Again, one can link this to the distance between the
  and the network atoms. There is a decrease in the distance between the
  molecule and the network and so the interaction is stronger causing a more drastic increase in the barrier for migration with respect to the NOi
.
molecule and the network and so the interaction is stronger causing a more drastic increase in the barrier for migration with respect to the NOi
.
Migrations through 7 member rings have the lowest barriers and show little variation between charge states. This scenario has the lowest barrier as there is the largest amount of free space along the migration path. In the neutral charge state this means that the NO has a smaller number of network atoms to repel. In the negative charge state, the abundance of free space means that  is further away from the network ions and so has weaker electrostatic interactions with the network.
4. Conclusions
We used DFT simulations to study the interaction and diffusion of NOi
molecules in the neutral and negatively charged states in a-SiO2. In both cases the molecule resides in cages of the amorphous network. The cages have different shapes characterised by the asphericity delta value. The more spherical the cage the less the energy dependence on the molecular orientation within the cage. The  interacts stronger with the wide O–Si–O bond angle (>119°) sites characteristic to strained environments of the smaller cages and their surrounding areas in the oxide. We observe the correlation between NO migration barriers and size of the rings connecting the network cages. There is an increase in migration barrier as the number of Si–O units in the ring decreases. In other words, the NO will prefer diffusion paths with the largest amount of free space as these give rise to the lowest barriers. The same can be said for the negative charge state. We note that the amount of free space approaching the interface, with the mass density of the oxide increasing from 2.2 g cm−3 in the bulk to 2.4 g cm−3 in the interface region, decreases [42]. This, coupled with the extra electrostatic interactions, suggests that NO migration rate can decrease significantly in the near interface region.
Acknowledgments
MVM was funded by the Engineering and Physical Sciences Research Council, Grant No. EP/G036675/1 under their Centres for Doctoral Training scheme and Infineon Technologies AG. Via our membership of the UK's HEC Materials Chemistry Consortium, which is funded by EPSRC (EP/L000202, EP/R029431), this work used the ARCHER UK National Supercomputing Service (http://www.archer.ac.uk). The authors acknowledge the use of the UCL Grace High Performance Computing Facility (Grace@UCL), and associated support services, in the completion of this work. We thank Judith Berens and Ivan Scivetti for helpful discussions.