

Abstract
Near-infrared (NIR) spectroscopy is a promising candidate for low-cost, nondestructive, and high-throughput mass quantification of microplastics in environmental samples. Widespread application of the technique is currently hampered mainly by the low sensitivity of NIR spectroscopy compared to thermoanalytical approaches commonly used for this type of analysis. This study shows how the application of NIR spectroscopy for mass quantification of microplastics can be extended to smaller analyte levels by combining it with a simple and rapid microplastic enrichment protocol. For this purpose, the widely used flotation of microplastics in a NaCl solution, accelerated by centrifugation, was chosen which allowed to remove up to 99% of the matrix at recovery rates of 83%–104%. The spectroscopic measurements took place directly on the stainless-steel filters used to collect the extracted particles to reduce sample handling to a minimum. Partial least squares regression models were used to identify and quantify the extracted microplastics in the mass range of 1–10 mg. The simple and fast extraction procedure was systematically optimized to meet the requirements for the quantification of microplastics from common polyethylene-, polypropylene-, and polystyrene-based packaging materials with a particle size <1 mm found in compost or soils with high natural organic matter content (>10% determined by loss on ignition). Microplastics could be detected in model samples at a mass fraction of 1 mg g−1. The detectable microplastic mass fraction is about an order of magnitude lower compared to previous studies using NIR spectroscopy without additional enrichment. To emphasize the cost-effectiveness of the method, it was implemented using some of the cheapest and most compact NIR spectrometers available.
Export citation and abstract BibTeX RIS

Original content from this work may be used under the terms of the Creative Commons Attribution 4.0 license. Any further distribution of this work must maintain attribution to the author(s) and the title of the work, journal citation and DOI.
1. Introduction
Small plastic particles found in the environment have sparked significant interest across the scientific community in recent years and are now widely known as microplastics. The size of these particles is typically defined as 1–1000 µm with an upper size limit of 5 mm for large microplastics [1]. However, other definitions especially concerning the lower size limit can also be found in the literature [2, 3]. One of the challenges on the way to a thorough understanding of the origin, the global distribution and fate of microplastics is to reliably identify and quantify the particles in samples obtained in the environment [4]. To accomplish this challenging task, a large number of analytical methods have been tested [5, 6]. They often entail the analysis of individual particles extracted from a sample. In other cases, the nature and mass of the microplastics is determined as an average by the simultaneous analysis of many particles, including matrix components [7].
Individual particle analysis often relies on spectroscopy to identify microplastics. FTIR spectroscopy is a well-suited and frequently applied analytical technique for this purpose [8]. Spectra of visible particles can be obtained very easily using ATR-accessories [9, 10]. For particles too small for handling with tweezers, IR-microspectroscopy with FTIR or quantum cascade laser systems is used [10–12]. Besides mid-infrared spectroscopy, near-infrared (NIR) hyperspectral imaging and Raman microspectroscopy have also been successfully applied to study microplastics [13, 14]. When analyzing individual microplastic particles, valuable information such as the morphology, color and the size of the particles can be obtained in addition to the chemical identity.
As an alternative to individual particle analysis, methods for the integral quantification of the mass fraction of microplastics in environmental samples have been developed [7]. Mainly thermoanalytical methods such as pyrolysis-gas chromatography-mass spectrometry (Py-GC/MS) or thermal extraction desorption gas chromatography mass spectrometry, relying on the pyrolysis of the sample or its solvent extracts have been used [7, 15–17]. A thorough discussion of the most commonly used approaches for the chemical analysis of microplastics including their advantages and disadvantages can be found in the literature [7].
The resources required to quantify microplastics in environmental samples can be significant due to the labor-intensive sample preparation and expensive analytical instruments required [16, 18]. As a result, there is a high motivation to explore cost-effective and fast alternative methods. One promising candidate to complement thermoanalytical methods for mass determination is NIR spectroscopy. This nondestructive spectroscopic technique has been used to analyze polymers and plastics for a long time and the available instruments are cheap, robust, and easy to handle [19, 20]. Instrument cost has been further reduced by the development of miniaturized NIR spectrometers [21]. One possibility to miniaturize NIR spectrometers is to use micro-electromechanical systems technology. For example, Michelson interferometer type wavelength selectors have been implemented on a chip and can now be found in compact NIR spectrometers [22, 23]. Compact instruments have been used to provide chemical sensing capabilities in many different application areas, including the identification of plastics and microplastics [21, 24–26].
One of the main limitations of NIR spectroscopy compared to thermoanalytical methods, is its low sensitivity and high limit of detection (LOD) with respect to microplastics [16, 27]. Recent studies suggest roughly 1% of microplastic in untreated soil samples as LOD [28, 29]. To be able to quantify microplastics at a lower level calls for an enrichment of the analytes prior to the analysis, as pointed out in the literature [29]. The low fraction of microplastics compared to the other particulate components is a common problem for microplastic quantification [30, 31]. Therefore, a rich body of literature is available applying different physical principles to reduce the interfering matrix as much as possible and to enrich microplastics prior to the analysis [18, 31–36]. To comply with the advantages of NIR spectroscopy such as low cost and fast measurements, a tailored microplastics extraction protocol should fulfil the following two criteria:
- (a)High Speed: Maximum 48 h for sample preparation and the possibility of parallel processing of many samples. As little sample handling as possible because it is labor intensive and error prone.
- (b)Low-tech: Simple and readily available equipment excluding toxic or harmful chemicals and procedures.
By performing an enrichment step prior to NIR analysis, this study aimed to quantify microplastics at a mass fraction of 1 mg g−1, which is about an order of magnitude lower compared to previous studies using NIR spectroscopy [28, 29]. Sample preparation was also expected to expand the scope of the method to soil samples with a relatively high organic matter content. Organic matter can otherwise interfere with the quantification of microplastics. Compost and compost amended soils were therefore chosen as matrix material to develop the method. The number of target analytes was restricted to polyethylene (PE), polystyrene (PS) and polypropylene (PP) because these common packaging materials are known to make up a significant fraction of microplastics found in compost and fermented biowaste [37, 38].
2. Materials and methods
2.1. Model microplastics
In this study, PE, PS and PP microplastic powders <1 mm prepared by cryogenic milling of additive free polymer pellets from an earlier study were used [28]. Part of the powders was further split into <500 µm and 500–1000 µm size fractions by sieving and used to study the effect of microplastic particle size.
2.2. Matrix specimens
For method development, eight batches of compost, a professional growing substrate, and peat for gardening, were obtained at >20 l each. They originated from professional large-scale composting facilities, commercially available bags and private households as summarized in table 1. It is assumed that the samples are microplastic-free. While no conclusive level of microplastics contamination could be determined with the available analytical methods, low levels of microplastics are considered ubiquitous in many parts of the environment and thus likely also present in the collected compost samples [39]. A basic characterization of the raw material was performed according to established protocols [40]. This includes water content (105 °C, 24 h), pH (1:10 extract in 0.01 mol l−1 CaCl2), and loss on ignition (LOI) (550 °C, until constant weight) measurements. The raw matrix was then dried at 60 °C for 24 h at a high air exchange rate as shown in figure S1 (available online at stacks.iop.org/MST/33/075801/mmedia). In the subsequent sieving only the particle size fraction <1 mm was retained. Again, LOI was determined for this size fraction.
Table 1. Basic characterization of matrix specimens (A–J) used for the development of a microplastic extraction protocol. The origin is indicated as follows: private household composts (p) commercial large scale composting facilities (c) and commercial bags (c*).
| Origin | Water 105 °C/% | pH | LOI/% | LOI < 1 mm/% | |
|---|---|---|---|---|---|
| A | p | 28.1 | 6.99 | 11.6 | 14.3 |
| B | p | 34.4 | 7.66 | 12.1 | 12.8 |
| C | p | 51.6 | 7.19 | 30.1 | 30.0 |
| D | c* | 39.1 | 8.19 | 17.9 | 24.9 |
| E | c | 15.2 | 7.27 | 30.7 | 11.7 |
| F | c | 48.1 | 7.62 | 27.0 | 12.9 |
| G | c | 43.1 | 6.43 | 32.8 | 13.3 |
| H | c* | 50.4 | 6.95 | 33.4 | 18.3 |
| I | c* | 56.1 | 4.57 | 45.6 | 63.0 |
| J | c* | 60.3 | 3.01 | 96.2 | 89.3 |
2.3. Development of the microplastics extraction protocol
2.3.1. General design.
Microplastics were extracted from the matrix <1 mm using the following general procedure mainly relying on the separation by density differences [41, 42]:
The dried matrix, an aqueous saturated NaCl solution and 10 M NaOH solution were added to a standard centrifugation tube (50 ml) as shown in figure 1. The mixture was agitated to allow the particles to absorb the liquid. Centrifugation was used to speed up the settlement of particles with high density [43, 44]. Low density particles were collected from the surface of the liquid and the wall of the tube by vacuum suction. Stainless-steel filters with a pore size of 6 µm were used inline to collect the particles as shown in figure S2. The filter and the residue were dried at 60 °C for 12 h.

Figure 1. Microplastics PE, PS and PP were collected from the NaCl flotation medium by vacuum filtration after the exposure to NaCl brine at elevated pH followed by centrifugation. Stainless-steel filters were used inline to collect the particles and were directly used in NIR analysis after drying.
Download figure:
Standard image High-resolution image2.3.2. Parameter screening and optimization of the extraction protocol.
The aim of the extraction procedure was to reduce the amount of matrix residue while recovering all the microplastics. It was studied which of the eight parameters in table 2 have the most significant impact on these two performance figures.
Table 2. Process parameters investigated with a two-level fractional factorial design.
| Parameter | Low | High |
|---|---|---|
| Fraction of organic matter based on LOI <1 mm | Matrix E | Matrix C |
| Mass of solid to liquid ratio in the centrifugation tube | 1 g/40 ml | 5 g/35 ml |
| Particle size of microplastics (PS) | <500 µm | 500 µm−1 mm |
| Microplastic (PS) mass fraction of the total solid | 0.5% | 5.0% |
| Time of mixing | 24 h | 1 h |
| pH of the suspension | ca. 7 | 13 |
| Time of centrifugation at 4000g | 1 min | 15 min |
| Number of centrifugation and filtration cycles | 1 | 3 |
The experiments were performed according to a fractional factorial design plan with two levels and a total of 16 samples according to table S2 and figure S3 using PS as model microplastics. Results were evaluated with Design Expert 12 (Stat-Ease Inc., USA).
Recovery rates of PS were determined by 1H-NMR spectroscopy. The filters holding the particles and a gravimetrically (XP2 U/M ultra-microbalance, Mettler Toledo) determined amount of dimethyl sulfone (DMS, synthesis grade, >99% (GC), Merck) as an internal standard were placed in small petri dishes and ca. 2 ml of CDCl3 (Deutero GmbH, 99.8%) were added. The petri dishes were covered with a lid. PS and DMS were dissolved by gently swirling the suspension for 10 min. About 600 µl of the remaining suspension were filtered through a small cotton ball placed in a Pasteur pipette to remove the particles prior to the NMR measurements. 1H-NMR spectroscopy was performed at a resonance frequency of 500 MHz (OneNMR probe, Varian, USA) in standard 5 mm NMR tubes. Per sample, 16 scans were accumulated at a constant temperature of 28 °C using a relaxation delay of 20 s and acquisition time of 5 s. The pulse angle was set to 30° and the receiver gain was automatically chosen. Analysis of the spectra was performed with MestReNova (Mestrelab Research S.L., version 14.2.1). Prior to the integration of the spectral ranges for PS and DMS indicated in figure S4, a manual phase- and baseline correction was performed. The mass of matrix residue was determined gravimetrically after drying the filters, subtracting the PS-content found by NMR spectroscopy.
In an optimization scheme presented in figure S5, the impact of the time of mixing and pH on the amount of recovered matrix C without added PS was studied in more detail. Centrifugation for 15 min at 4000 g and one centrifugation/filtration cycle was used during the optimization and all subsequent experiments.
2.3.3. Optimized protocol.
The optimized extraction protocol is summarized in figure 1. Together with 5 g of matrix, 35 ml of an aqueous saturated NaCl solution, and 1.45 ml of 10 M NaOH solution were added to the centrifugation tubes (50 ml). After thorough manual shaking of the tubes for 30 s, they were rotated with an overhead shaker at 5 rpm for 24 h. After centrifugation for 15 min at 4000 g the floating particles were carefully collected from the surface of the liquid and the wall of the centrifugation tube by vacuum suction. Stainless-steel filters (dutch weave ODW6, GKD—Gebr. Kufferath AG, Düren, Germany) with a pore size of 6 µm and a diameter of 25 mm were used to retain the particles. The filters holding the particles were dried for 12 h at 60 °C prior to NIR measurements.
Centrifugation tubes made from PP with PE lids were used in the initial optimization phase and for samples prepared for the calibration of partial least squares regression (PLSR) models. For additional test samples they were replaced by 50 ml tubes made of fluorinated ethylene propylene with ethylene tetrafluoroethylene screw caps (NalgeneTM Oak-Ridge).
2.4. Application of the extraction protocol
2.4.1. Recovery of microplastics.
The recovery of microplastics with the optimized extraction protocol was tested with matrix C. Six mixtures were prepared by adding 5 mg of one of the three (PE, PP or PS) powders to the dry matrix in the centrifugation tube. Additionally, a sample without added microplastics was prepared. For each of the powders an individual sample was prepared in the size range <500 µm and 500–1000 µm. Using duplicates, a total of 14 samples were obtained.
The dried matrix residue containing microplastics was collected from the stainless-steel filter and was transferred to 600 µl alumina crucibles for thermogravimetric analysis (TGA) using a TGA/DSC 3+ (Mettler-Toledo, USA) instrument. The samples were heated up to 600 °C at a rate of 10 °C min−1 under nitrogen atmosphere, followed by heating to 900 °C at 10 °C min−1 with air. The microplastic content was determined as the average mass loss in the 380 °C–600 °C range, subtracting the average relative mass loss of matrix residue with no added microplastics.
2.4.2. Type of mixing.
For matrix C with no added polymers, the effect of the mixing on the amount of recovered matrix residue was evaluated by replacing overhead shaking by:
- (a)The centrifugation tube was not moved for 24 h after initial manual shaking for 30 s.
- (b)Matrix C, NaCl solution, and NaOH solution were mixed in a glass beaker (125 ml) by magnetic stirring at 600 rpm for 24 h. Particles were then carefully rinsed into a centrifugation tube.
2.4.3. Variation of the matrix.
The optimized extraction method was applied to all 10 available matrix specimens (A–J).
2.4.4. Calibration of PLSR models based on NIR spectra.
For PLSR, 87 samples with the compositions shown in figure S6 and a systematic variation of the matrix (B and C), microplastic particle size (<500 µm and 500–1000 µm), and polymer type (PS, PP and PE) including mixtures of polymers, were prepared. Of these, 57 samples were used for model calibration. Twenty-seven samples which are duplicates of selected calibration samples were used for the validation of the models. The final models were further evaluated with three additional test samples. The three test samples contained identical microplastics compositions and were prepared from matrix G, not used in the calibration of the model. To obtain a known amount of microplastics, the dried microplastic-free matrix residue on the stainless-steel filters was spiked with a gravimetrically determined amount of microplastics. Microplastics and matrix were very carefully mixed with a spatula. Further, five negative control samples were prepared using microplastic-free calcined sand as matrix to check for contamination during the extraction procedure.
2.4.5. Estimation of uncertainty.
Three batches of a 1:1 mixture of matrix B and C (<1 mm) with a total mass of 40 g each were prepared as model laboratory samples six months after the calibration of PLSR-models. Two of the mixtures were spiked with 13.3 mg of PS, PP and PE, of the sizes <500 µm and 500–1000 µm respectively (80 mg total microplastics mass). The mixtures were homogenized, and each was split into eight analytical samples with a simple sectorial sample splitter using an adapted design form the literature [45]. Seven spiked samples per batch and six samples without spiked microplastics were then processed with the optimized extraction routine.
2.5. NIR spectroscopy and data analysis
A simple reflectance setup in figure 2 was used to record the spectra of the entire filter area covered by particles. Two 20 W tungsten halogen light sources (Osram, Germany) illuminated the samples at an angle of 45°. The reflected light was collected with a SMA-terminated low hydroxide multimode optical fiber with a numerical aperture of 0.22 and a core diameter of 600 µm. The fiber was placed 90° relative to the sample surface at a distance of about 5 cm. The cone of accepted light was adjusted to ca. 18 mm in diameter at the sample surface, slightly larger than the circular region of deposited particles on the filter.
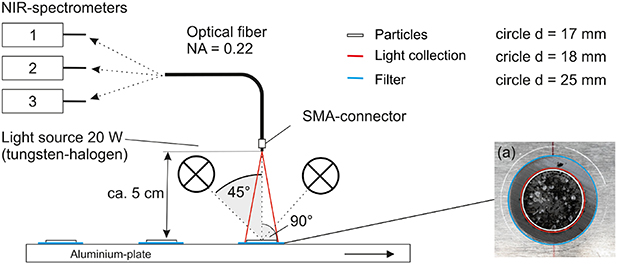
Figure 2. Schematics of the setup used for NIR reflectance measurements. The filter holding the extracted particles (a) was illuminated by two halogen light sources. The reflected light was collected with an optical fiber and analyzed by a NIR spectrometer.
Download figure:
Standard image High-resolution imageNIR reflectance spectra were recorded with three different NIR spectrometers: Matrix-F Duplex (Bruker Optik GmbH, Germany), NIRONE S2.0 (Spectral Engines Oy, Finland) and NeoSpectra (Si-Ware Systems, Egypt). All spectra were measured with Spectralon® as a white reference using the specifications given in table 3. Ten measurements were taken per filter manually rotating it by about 30° between measurements.
Table 3. General characteristics and acquisition parameters of the three NIR spectrometers as well as parameters used to mathematically prepare the spectra for PLS-regression using normalized Savitzky-Golay (SG) smoothed derivatives of the spectra.
| Spectrometer characteristics, price, and settings | Matrix-F | NIRONE S2.0 | NeoSpectra | |
| Interferometer principle | Michelson (RockSolidTM) | Fabry-Pérot | Michelson | |
| Spectrometer type | Benchtop | Compact | Compact | |
| Spectral range | 4000–12 000 cm−1 | 5128–6452 cm−1 | 3919–7690 cm−1 | |
| Price*/EUR (year of acquisition) | 50 000 (2009) | 2000 (2018) | 3300 (2018) | |
| Measurement parameters | ||||
| Accumulation, software setting | 32 scans | 32 scans | 30 s | |
| Resolution, software setting | 8 cm−1 | 4 nm | 8 nm | |
| Zero filling factor | 2 | — | 2 | |
| Apodization | Blackman-Harris-3-Term | — | Tukey 0.25 | |
| Analysis of spectra | Mathematical treatment of spectra | |||
| Utilized spectral range | 5508–9161 cm−1 | 5537–6305 cm−1 | 4191–6310 cm−1 | |
| SG: polynomial order | 2 | 2 | 2 | |
| SG: number of datapoints | 41 | 7 | 17 | |
| SG: derivative | 1 | 1 | 1 | |
| Normalization | Unit length | Unit length | Unit length | |
| PLSR | ||||
| Number of factors | 5 | 4 | 3 | |
The recorded NIR spectra were mathematically prepared by calculating the first derivative combined with Savitzky-Golay smoothing in the spectral ranges specified in table 3, followed by normalization of the spectra to unit length. All PLSR-models were developed with Python and Scikit-learn [46].
3. Results and discussion
While developing a strategy to extract microplastics from compost or soil samples the amount of material which must be processed was identified as a critical factor. It determines the size and type of setup which can be used. Thereby the sample mass entering the extraction step is determined by:
- (a)Requirements of NIR analysis: The amount of extracted microplastics must be large enough to give a sufficient signal to noise ratio.
- (b)Statistical requirements: Subsampling from a larger laboratory sample, the number of particles entering the extraction will vary due to statistical reasons. The acceptable mass variation of microplastics between subsamples was set to 10% relative standard deviation.
Condition (b) was found to be the limiting factor, given a mass fraction of 1 mg g−1 microplastics is targeted here. To estimate the minimum amount of compost necessary, the fundamental sampling error (FSE) concept as described by the theory of sampling and shown in figure S7 was applied [47]. The FSE suggests 5 g as the minimum amount of material which needs to be processed.
The minimum sample mass is crucially determined by the targeted microplastics content. This means the extraction process with 5 g sample mass should only be used for mass fractions of microplastics ⩾1 mg g−1. This is also the reason why generally large setups and large amounts of solids [48] are used to obtain representative results if microplastics content in a sample is low. With decreasing detection limits through recent advances in the quantification of microplastics by Py-GC/MS methods [16, 27], it becomes increasingly challenging to deal with the large sample volumes which need to be processed. This typically means the sample needs to be ground to reduce particle size, which is not yet necessary in our case.
3.1. Development of an extraction procedure
Extraction of intact microplastic particles was chosen over solvent based extraction [49], applying the frequently used flotation method using a saturated salt solution. The flotation method was chosen because it has been successfully used in many studies and requires only simple equipment [41, 42]. For the targeted plastics PE, PP and PS, flotation can be achieved with saturated NaCl solution at low cost and low toxicological risk. Initially, the dry particles floated and showed hydrophobic behavior, so continuous overhead shaking was applied to ensure mixture and saturation of the matrix with brine. Overhead shaking also allowed to process 20 samples in parallel. Separation of the particles from the flotation medium is a known challenge [31]. A vacuum suction approach using a stainless-steel inline filter with a mesh size of 6 µm was chosen to collect most particles in the relevant size range (1–1000 µm). Assuming that most laboratories are equipped with a simple vacuum pump, the setup can be realized at very little cost.
Due to the small mesh size, the filters are prone to very quick clogging. Centrifugation which has been used to separate microplastics in other studies eliminated this problem and speeds up the separation process significantly [43, 44]. The small amount of only 5 g of matrix allowed mixing of brine and matrix directly in a centrifugation tube avoiding unnecessary handling. It is well known that oxidation, enzymatic treatment, or pH variation can aid the extraction of microplastics by decomposing the matrix [31]. This is the reason why additionally low cost NaOH was applied during the incubation of the salt solution. Even though little impact of basic pH is expected on the target polymers, the pH was restricted to <13 to avoid polymer degradation [32]. To avoid further sample handling, the NIR reflectance measurements were directly performed on the dried filters. The filter diameter was chosen to match the amount of recovered residue after the extraction procedure to approximately form a monolayer of particles.
3.2. Method optimization
3.2.1. Selection of matrix for method development.
Ten different batches of matrix material for method development were chosen with the aim to cover a large variation of type and amount of organic matter content. Residue of organic material interferes with microplastics determination by NIR spectroscopy due to overlapping absorption bands of the polymers and the organic matter. During preliminary tests it was observed that peat containing specimens I and J behave much differently than the remaining matrix samples and were therefore discarded. Specimen C and E with the highest and lowest LOI in the particle size range <1 mm were instead selected for method development.
3.2.2. Screening for important parameters with a fractional factorial design.
The proposed extraction procedure is a multi-step process, and many parameters have an influence on its performance. To identify the critical parameters several promising candidates in table 2 were studied with the aim to later maximize the recovery of microplastics while minimizing the amount of recovered matrix residue. PS was used as model microplastics for recovery because it can be easily dissolved in CDCl3 and quantified by NMR spectroscopy [50]. From these initial screening experiments, none of the parameters was found to significantly affect the amount of recovered PS. However, a negative correlation of the time of mixing and the pH of the solution with the amount of recovered matrix was found in figure S3.
The impact of pH and the time of mixing on the total amount of dried residue obtained after filtration was therefore studied in more detail in figure 3(a) for matrix C without added microplastics. While an increase in both parameters individually reduced the mass of recovered solids, the combined increase of both parameters caused the residue mass to drop even more. Moving from only 60 min of mixing with no addition of NaOH, to 24 h of mixing with the addition of 1.45 g of 10 M NaOH reduced the amount of residue from more than 7% to 0.27% of the starting mass. This minimum of residue was chosen as extraction optimum, and many more samples were independently prepared under these conditions throughout the study. They mainly served as matrix material during the development of PLSR-models for NIR spectroscopy. Using a total of 25 available samples in figure 3(b), matrix residue of 0.4 ± 0.1% was found. This shows that the method works reproducibly.

Figure 3. (a) Optimization of sample preparation routine for matrix C by variation of pH and time of mixing to minimize the matrix residue after filtration. (b) At the optimum extraction conditions, a box plot shows the distribution of the obtained residue for 25 samples. Into this plot, the amount of residue obtained from two samples prepared by no mixing and magnetic stirring as opposed to the standard overhead shaking is projected for comparison. (c) The procedure optimized for matrix C was applied to the entire set of matrix materials available. (d) The recovery of microplastics using PS, PP and PE with two particle size ranges was tested for matrix C by TGA at optimized extraction conditions.
Download figure:
Standard image High-resolution imageBesides the parameters mentioned above, the type of sample agitation used is suspected to be an important parameter. To estimate the impact of mixing on the extraction method, two samples were subject to either no mixing or magnetic stirring as opposed to the overhead shaking normally used. While magnetic stirring was able to reduce the amount of residue to about 0.1% of the starting mass, no mixing at all caused about 1% of the matrix to remain after sample preparation as shown in figure 3(b). While high energy input such as ultrasound [51] can break microplastics, this is likely also possible due to friction occurring during magnetic stirring. Therefore, it is not a preferred option if particle shape or sizes matter, but of lesser concern for the determination of mass fractions. This indicates that in the future the extraction method could be further improved by changing the type of mixing.
Optimization experiments were conducted with matrix C with the highest LOI value. To test for the transferability of the approach, all other available matrix batches in figure 3(c) were tested accordingly. Among the eight matrix samples with no peat content (E–H), no significant correlation between LOI and the performance of the sample preparation was found. From our observations other criteria may be more important. For instance, matrix E with the largest amount of residue contains much inorganic material (sand) which causes a low LOI value. However, the organic material it contains is mainly made up of large fragments of little degraded plant residue which show low removal rates by the presented extraction method.
For a successful enrichment of microplastics from a sample, the second important factor besides reducing the unwanted material, is to maximize the amount of retained microplastics. Therefore, the recovery of PS, PP and PE was tested. While prior recovery experiments for PS had been performed with NMR spectroscopy, TGA shown in figure S8 was used here [52]. It was found to be more practical because the matrix residue containing polymer particles could be analyzed directly without solvent extraction and the addition of an internal standard. High recovery rates above 80% were obtained for all three polymer types and polymer particle sizes <500 µm as well as 500–1000 µm. Recovery rates are comparable to reported values in the literature [42].
3.3. NIR spectroscopy
Each step involving sample handling poses a risk of particle loss. This was the primary motivation to conduct the NIR measurements directly on the filters used to collect extracted particles. The setup was designed to collect the reflected light of the entire filter area covered by particles. This allows to maximize speed because in principle only a single measurement is required per filter. However, a rotational variation in signal intensity most likely due to anisotropic lighting of the sample was found in the setup and therefore ten consecutive measurements were collected rotating the filter in between.
3.4. Quantification of microplastics with PLSR
A change in intensity of the reflected light depending on the amount of microplastics present in the sample is a prerequisite for a quantitative analysis. Some spectral regions such as the one attributed to first overtones of C–H stretching vibrations (ca. 5500–6500 cm−1) are particularly suitable for this purpose and have been used to quantify microplastics in soil before [28]. Compact NIR spectrometers as used in this study, typically do not cover the entire NIR spectral range. For this reason, the instruments used were specifically chosen to cover the 5500–6500 cm−1 region.
The raw spectra collected with all three NIR spectrometers in figures 4(a)–(c) showed a clear discrimination among the three investigated polymer-types PS, PP and PE. This can be clearly seen in the first overtone range of the spectra between ca. 5500 and 6500 cm−1. The characteristic first overtone absorption band in PS at 5918 cm−1 arises from stretching of aromatic C–H groups [53]. The PP absorption pattern in this region shows bands at 5882, 5794 and 5495 cm−1 which are due to asymmetric and symmetric methyl C–H stretching as well as asymmetric methylene C–H stretching [53]. PE shows two predominant bands from CH2 stretching at 5787 and 5669 cm−1 [54]. In addition to the signal of the polymers, the matrix residue on the filters possesses absorption features in the same spectral range. The collected polymer spectra are thus a combination of the spectrum of the polymers and the spectrum of the residue on the filter.
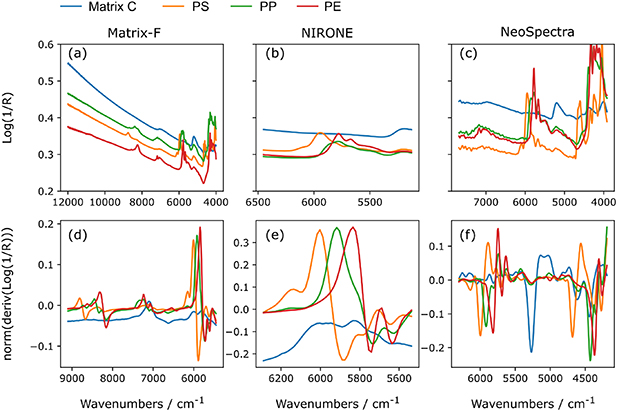
Figure 4. NIR reflectance spectra were recorded with three different spectrometers (a)–(c). The raw spectra, presented as the mean of ten individual measurements, show different characteristic absorption bands for PS, PP and PE (10 mg polymer on the filter). These characteristic absorption features are mixed with the pattern of the underlying matrix residue. For PLSR-modeling, the normalized 1st derivatives of the spectra were used (d)–(f). The evaluated spectral range was restricted to minimize variation such as baseline offsets which are not relevant for the quantification of microplastics.
Download figure:
Standard image High-resolution imageFor a robust quantification of microplastics with PLSR models it is favorable to reduce the variation between different sample spectra not related to the polymer type and quantity. This was achieved by applying a smoothed first derivative of the raw data followed by normalization, shown in figures 4(d)–(f). In addition, the spectral range used for the regression was further restricted which also improved the performance of the models summarized in figures 5 and 6. Other effects changing the appearance of the spectra which cannot be easily removed by mathematical pretreatment should be considered when compiling the calibration data set. Here, the particle size of the microplastics and the composition of the matrix were included as additional effects.
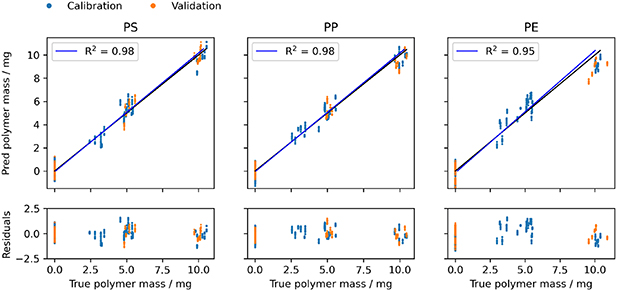
Figure 5. PLSR calibration with three factors for PS, PP and PE calculated from spectra obtained with the Matrix-F spectrometer. Residuals as deviation from the regression line are given at the bottom.
Download figure:
Standard image High-resolution image
Figure 6. RMSE values were used as an important figure of merit to evaluate the PLSR-models. This includes the calibration (RMSECV) and validation on duplicate samples (RMSEP) as well as the test of the model with additional samples (RMSEP_t).
Download figure:
Standard image High-resolution imageThe widely used root means square error of leave one sample out cross validation (RMSECV) was used to evaluate the performance of the model shown in figure 6. RMSECV values were similar for all three spectrometers and polymer types and ranged between 0.60 and 0.91 mg. In combination with R2 values of the regression lines of >0.95 for the Matrix-F data in figure 5 this means the models describe the quantitative relationship sufficiently. While even lower RMSECV values can be obtained depending on the model complexity, PLSR models were restricted to three to five factors. This results in models which generalize well to samples not used for the calibration. Predicting the polymer content of the left-out validation samples, the obtained RMSEP values were in most cases smaller than the RMSECV of the calibration. This shows that the models suitably describe the data. It also indicates that the selected validation samples do not resemble the entire space of calibration samples and give an overly optimistic impression on the model performance. The models were therefore tested further with three additional samples of identical composition. Those samples were prepared from matrix G, not used in the model calibration, and possessed a polymer composition of PS, PE and PP not used during calibration. Except for the PE content determined with the NeoSpectra instrument, RMSEP_t values obtained for these test sample were below 0.77 mg and thus close to the RMSECV values obtained from the model calibration. These values underline a proper performance of the PLSR models.
Contamination of samples with ubiquitous microplastics in the lab is an often-discussed problem [55]. Five negative control samples were run throughout the study and did not show any levels of contamination relevant to the quantification by NIR spectroscopy. The critical contamination level for NIR spectroscopy as used here is several order of magnitude higher compared to contamination levels relevant to studies using micro-spectroscopy to study individual particles [56].
3.5. Estimation of uncertainty
For the calibration of PLSR-models, matrix residue was spiked with polymers on the filter after the extraction procedure as indicated in figure 7. The RMSE values which describe the deviation in microplastic mass predicted by the PLSR-models and the true microplastic content therefore only cover the deviation introduced during the NIR measurement and data evaluation stage of the analysis. All previous steps such as sample splitting in the lab and the extraction procedure were neglected. Additional tests were conducted which included these steps by spiking a simulated laboratory sample. This provides a more reliable uncertainty estimate of the predicted microplastic mass. To limit the number of samples, only one composition resembling the center of the calibration space covered by the PLSR models was prepared as duplicate in addition to the unspiked matrix which served as control sample. The results obtained with the Matrix-F and NIRONE spectrometer are shown in figure 7.

Figure 7. (a) The uncertainty of the method with regard to the determined microplastic mass was estimated starting from simulated laboratory samples of 40 g. Unlike the model development, uncertainty estimates include sample splitting, the extraction of microplastics, the NIR measurement, and the evaluation of the spectra by PLSR models. (b) Three simulated laboratory samples were used, two with microplastics added and one without microplastics added. The composition of the spiked analytical samples corresponds to the center point of compositions used for calibration. The deviation of the determined microplastic masses from the target values is shown at the bottom right as RMSE values.
Download figure:
Standard image High-resolution image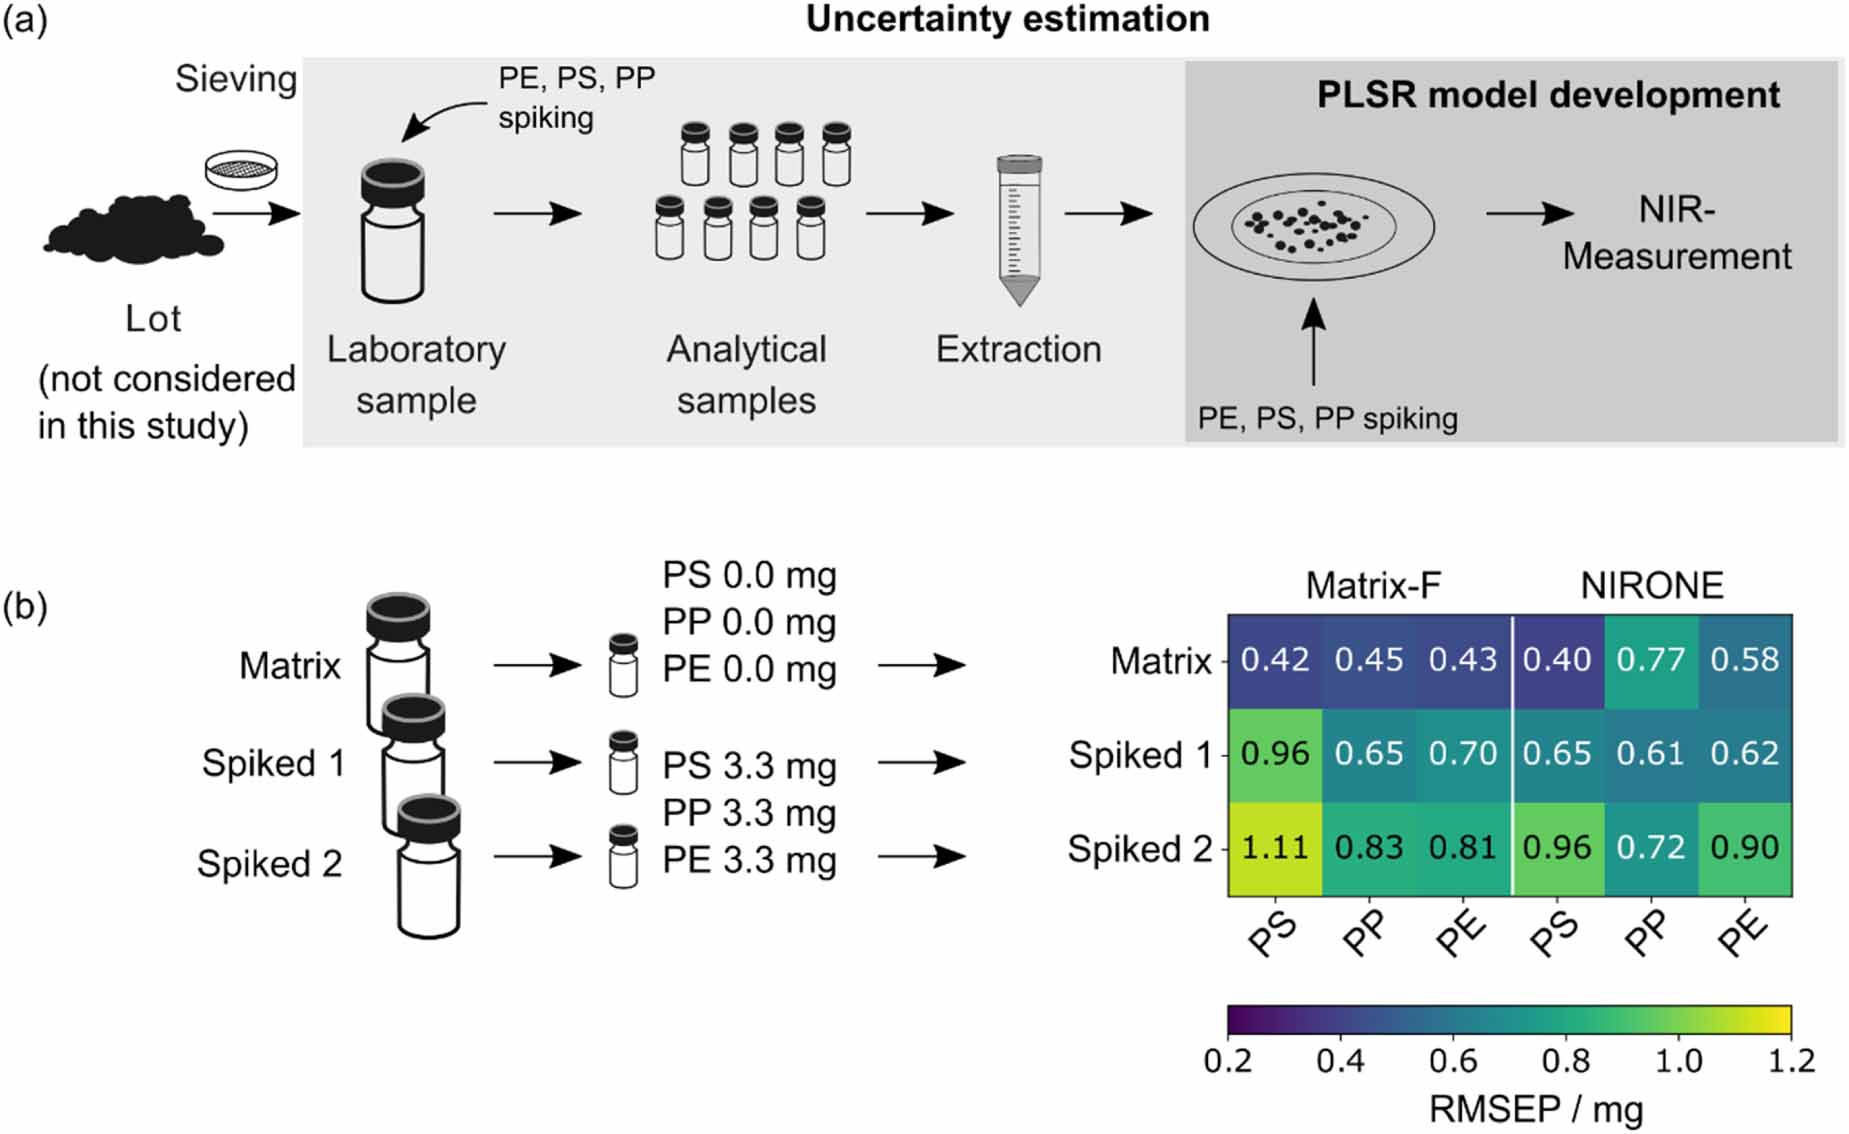
Apart from PP when quantified with the NIRONE spectrometer, the RMSEP values obtained from the unspiked laboratory sample are lower than the ones obtained from spiked samples. Among the spiked samples the maximum RMSEP value of 1.11 mg was observed for PS when spectra were collected with the Matrix-F spectrometer. The similar RMSEP values obtained for both spectrometers show that the compact spectrometer performs comparably to the benchtop instrument in this application.
RMSEP values are also close to or slightly higher than RMSECV obtained during calibration. This shows that the additional homogenization, splitting and extraction steps did not cause a strong increase in RMSEP. It was therefore concluded that the NIR measurement on the filter itself is likely one of the largest contributors to the overall uncertainty in the microplastics quantification.
In the spiked model laboratory samples, the total microplastic mass fraction was 2 mg g−1, with each polymer at a level of 0.67 mg g−1. Even at this low level, a significant difference between the unspiked matrix and the spiked samples was found for all three polymers and both spectrometers. Despite the very limited test case, this is an indication that with the presented method microplastics can be detected at a mass fraction of 1 mg g−1 or lower, which was one of the goals of this study. This level is about an order of magnitude below the results achieved without the extraction procedure [28]. In the future, further experiments should be conducted covering a larger variability of sample composition to further confirm these results.
The main advantages and limitations of the NIR-method can be summarized as follows:
- Disadvantages of the NIR method: For calibration and validation purposes, the presented NIR-method requires many samples of known microplastic content. In this study, 87 samples were gravimetrically prepared for this purpose. The NIR method has so far been optimized only for soil and compost samples and is currently restricted to three polymer types (PS, PP, PE). Microplastics could be detected at a minimum level of 1 mg g−1 which is much higher compared to detection limits of 0.3 and 2.2 µg g−1 which have recently been suggested for a method based on Py-GC/MS for the quantification of PS, PP and PE in soil samples [57]. Also, the NIR method has a rather limited range of about 1–10 mg compared to other approaches which cover an analyte content of more than order of magnitude [17, 27].
- Advantages of the NIR method: The method allows for high sample throughput which offers potential for further increases. During method development, 20 samples per day were typically processed by one operator. Sample preparation is the time-limiting factor, but more samples could be processed in parallel if required. NIR-measurement and data analysis only take ca. 10 min per sample (1 min per spectrum) and there is no need for cleaning or other breaks between samples. The acquisition, maintenance, and operating costs of a compact NIR spectrometer are extremely low compared to instruments required for thermoanalytical analysis. Also, operating the devices is very simple and does not require expert knowledge.
4. Conclusion
Cheap and compact NIR spectrometers were successfully used to detect and quantify microplastics in model compost and soil samples at levels >1 mg g−1. In this study it was shown that using microplastic extraction to enrich the analyte is a key step to increase the competitiveness of NIR spectroscopy compared to more established methods such as Py-GC/MS to integrally quantify microplastic masses in a sample. The enrichment increased the relative amount of the analyte by a factor of 10–100, allowing it to be detected by NIR spectroscopy. At the same time, it reduced the proportion of natural organic material, which overlays the characteristic absorption bands of the synthetic polymers and thereby strongly impairs quantification. The extraction protocol was specifically designed to preserve the low-cost and low-tech advantage of NIR spectroscopy applying only readily available laboratory equipment. To maximize the performance of this simple protocol, a systematic approach utilizing statistical experimental designs was applied. It allowed to identify and optimize the mixing time and pH as important experimental parameters. The development of the method for the quantification of a limited number of analytes (PS, PP, PE) at a given mass level permitted an additional tailoring of the extraction procedure. This suggests that one of the possible use cases for NIR spectroscopy to quantify microplastics lies in a routine analysis scenario. In this case the large number of similar samples which are analyzed justifies additional calibration effort for models which are necessary to retrieve the quantitative information from NIR spectra. In the described scenario, to meet the strengths of NIR spectroscopy, the number of different analytes should preferably be small, their mass fraction high, and the variations in analyte content between samples small.
Acknowledgments
This work was supported by the German Federal Ministry of Education and Research; Project Repräsentative Untersuchungsstrategien für ein integratives Systemverständnis von spezifischen Einträgen von Kunststoffen in die Umwelt (RUSEKU), BMBF Grant No. 02WPL1442A. We thank Gebr. Kufferath AG for providing the stainless-steel filters and appreciate the great support by Yi You, Kornelia Gawlitza, Karin Weimann, Axel Müller and Andreas Sauer (Bundesanstalt für Materialforschung und -prüfung) supplying equipment and advice conducting this work. We thank Korianna Altmann for assistance with the TGA measurements and Hoang Le Nguyen (TU Berlin) for performing preliminary microplastic extraction tests.
Data availability statement
The data that support the findings of this study are openly available at the following URL/DOI: 10.5281/zenodo.5528912 [58].
Conflict of interest
The authors declare that there is no conflict of interest.