


Abstract
This work presents a pneumatically operated piston released rapid compression machine (PRRCM) designed at the University of Sheffield that introduces a new set of pneumatic systems to lock/release the piston from its initial position. It is pneumatically operated to compress gas mixture to an adiabatically thermodynamic state and stopped hydraulically. The range of compression ratios of the facility is between 4.4 and 20. The end of compressed gas temperature, Tc and pressure, Pc obtained within the facility is approximately 1000 K and 22 bar respectively. The performance of the Sheffield piston released rapid compression machine (SHEF-PRRCM) facility has been characterised to ensure a high level of fidelity of experimental data over a range of test conditions. The performance test was conducted for a nonreactive test using nitrogen and argon, the result demonstrated a repeatable pressure trace. Repeatability test for the reactive mixtures was also demonstrated. Further study on ignition characteristics of aviation fuel (Jet A-1) and Banner NP1014 known as Bannersol in SHEF-PRRCM was conducted over Tc of 723 K ⩽ Tc ⩽ 884 K, Pc = 6 and 10 bar at ϕ = 0.75 and 1.0. The influence of pressure, temperature and equivalence ratio was seen on the oxidation of Jet A-1 and Bannersol. The results showed that Bannersol displayed a negative temperature coefficient behaviour and has higher reactivity than Jet A-1. Besides, a comparative analysis of the current facility with other facilities in literature was carried out, the result showed a fair deviation of the current data from literature and these could be attributed to the inherent non-ideality of heat transfer effects in different rapid compression machine and fairly slight differences in the condition tested. This work has demonstrated the competence of the current facility to carry out further studies on combustion and validation of the chemical kinetics of hydrocarbon fuels.
Export citation and abstract BibTeX RIS
1. Introduction
Demand for low temperature lean premixing combustor has increased with progressively strict emission regulations [1, 2]. This new combustion system was proposed to reduce NOx and improve efficiency for both ground and air-based gas turbine engines. Longer residence times [3, 4] and combustion instability [5] are one of the problems of lean premixed prevaporised combustors. This posed a major challenge to fuel compatibility, particularly concerning technical requirements such as flash point, freezing point, energy density, instability and autoignition [3]. Fuel combustion properties are very sensitive to fuel composition, equivalence ratio, temperature and pressure. Combustion and autoignition are complex phenomena which involve the interactions between different fields including fluid dynamics, thermodynamics, chemical kinetics, heat and mass transfer and turbulence. With the evolution of new alternative fuels from various feedstocks and the need to integrate these fuels into existing or new engine technology. A more detailed analysis is needed to understand the chemical pathway responsible for fuel combustion to increase engine efficiency and minimise greenhouse gas emissions. To accomplish this study of chemical pathways of hydrocarbon fuel, a facility is required that can capture the chemical properties of fuel associated with the advanced combustion engine. In literature, several facilities are used to obtained ignition delay data, such as flow reactor (FR) [4], well-stirred reactor (WSR) [5], static reactor [6–8], the shock tubes (STs) [9] and rapid compression machine (RCM) [10–14].
The WSR may operate at an elevated temperature and pressure [5] but may have a challenging problem where the characteristic reaction time is relatively close to the mixing time at elevated temperature. For ST, there is no inherent complex fluid dynamics during operation, nevertheless, high pressure and temperature ignition data could be measured and the experimental condition typically does not exceed 10 ms [15]. Although, a recent study has shown that the experiment can proceed with a longer ignition delay up to 50 ms with the modification of the ST driver section [16, 17]. Nevertheless, the issues of imperfect reactant mixing associated with gas sampling techniques, radial temperature and concentration gradients persist in an FR. But the facility offers the advantage of measuring temperature up to 1200 K and species concentration with a limited operating pressure of 20 bar [4, 18]. Despite these deficiencies in the above mention facilities, a more efficient test rig, RCM mitigates some of these defects. It has an advantage over other facilities thus maintaining a prolong experimental post compression time of up to 150 ms. In addition, it explores combustion phenomena at low to intermediate temperatures, such as two-stage ignition and the negative temperature coefficient (NTC). These phenomena have significances for a practical combustion engine, in particular the homogeneous charged compression ignition engine, reactivity controlled compression ignition engine, low temperature combustion engine etc. A combustion strategy aimed at achieving a lower carbon footprint and are strictly controlled by the chemical kinetics of the fuel. However, the optimum desire of an experimental combustion test facility like the RCM is to study relatively long term combustion phenomena in addition to temperature and pressure, simplify fluid dynamics associated with the facility, accessible to measurements and have sufficient test period to investigate the phenomena of interest. RCM is a single stroke device which simulate the single event of an internal combustion engine (ICE). It is designed to aid in the understanding of low to intermediate autoignition chemistry under idealised engine like conditions. It compresses test gas mixtures isentropically to a higher temperature and pressure at the end of the stroke thus maintaining a constant volume. One of the key requirements in the design of the RCM is fast compression, although most of them used compressed gas-driven piston assemblies designed by Affleck and Thomas [12], pneumatically driven [10, 12, 19, 20] that allowed rapid compression (sim20 ms) and higher compression ratio studies. However, the orientation may vary from design to design. Some may have adjustable stroke and why some may have their chamber volume trajectory operated by different cams with specific profiles [14, 21, 22].
Due to the high inertia of the reactor piston, a more appropriate mechanism is required to stop the piston and lock it in its final position during chemical kinetics study. In early RCM designs, the use of an air-cushion system such as powerful springs, plastic metal deformation or piston energy is absorbed by transferring piston momentum to an auxiliary floating mass. Though, these methods are cumbersome and offer poor reliability as a great deal of mechanical operation exist between RCM experiment. A more useful hydraulic cylinder (stopping mechanism) was proposed by Rogowski [23] which had an edge over the previous design. Since then, the use of the hydraulic stopping mechanism has been the preferred means of decelerating the reactor piston and bringing it to a complete halt at the end of the stroke [10, 13, 19]. The hydraulic cylinder performs two major functions: (a) the oil pressure in the hydraulic cylinder keeps the reactor piston in the reaction chamber at its bottom dead centre (BDC) until it is ready to fire. (b) It is used to decelerate the assembly as the reactor piston approaches its top dead centre (TDC).
The multidimensional effects such as roll up vortex [24] and heat loss can cause inhomogeneity of the gas mixtures in the core section of the reaction chamber. This could result in discrepancy in different RCM data. The effects are controlled by designing a piston with a crevice volume which would contains the multidimensional effects. Lee and Hochgreb [25] developed a piston crevice design numerically, which suppresses the vortex generation thus maintaining a well defined temperature field and minimise post compression heat loss in the reaction chamber. If the roll up vortex is suppressed, then the Tc could be estimated using the adiabatic core hypothesis from the associated primary data measured from the RCM. Previous works have attempted to characterise the temperature field of RCM by applying different approaches like using laser diagnostic techniques [26–28], Rayleigh scattering techniques [26], acetone laser induced fluorescence [27, 28] (LIF), laser absorption technique [29] etc results revealed that acetone-LIF was more efficient to characterise the variations of temperature in the RCM than the Rayleigh scattering [28].
Varieties of RCMs have been reported in the literature used for the investigation of single [30] and two-stage ignition delay of fuels [31, 32] and validation of kinetic models at low to intermediate temperature regime [32–35]. These can be categorised into four main forms; first, the free piston RCMs [36, 37] which uses compressed gas to drive a piston inside the cylinder. The piston does not have a mechanical link but can move freely within the chamber. A typical example is one used by the University of Michigan [37]. This type uses a unique free sabot that is designed to stop the piston in the right place (at the end of stroke) without the need for complicated stopping mechanisms. The scale of the test rig is one drawback of this particular design and is likely to have a longer compression time. Second, linked piston, for this type, the driven piston has a mechanical link that drives the reactor piston and can result in more controlled and repeatable compression. Although the driver section and reactor piston are separated but interlinked by shafts. The advantage is that adequately large thrust can still be achieved by using a driving piston of larger diameter in comparison to that of the reactor piston with a smaller diameter [10, 11, 13, 38, 39]. Third, double piston RCMs is air-driven piston connected via a cam, to a second piston that compresses the test gas mixtures into the main reaction chamber [40]. The cam design controls the stroke of the reactor piston and prevents it from rebounds when it reaches the end of its stroke [41]. The piston moves in directly opposite direction [12] with a shorter compression time and quite stable in operation. One of the main characteristics is that significant shorter compression time could be achieved in the event of a twin piston design. The primary problem with this particular type of RCM is how to keep the pistons synchronised to ensure a high level of mechanical balance of the facility. Fourth, the RCM design that have a combination of the hydraulic cylinder and the reaction chamber directly coupled together and firmly secured by means of bolts or standalone [42], we will refer to this arrangement as conflated reaction chamber (CRC). A typical example of CRC is shown in figure 1.

Figure 1. Shows the University of Illinois at Urbana-Champaign RCM, reprinted from [42] (© 2019, with permission from Elsevier) which is classified under the non-CRC systems.
Download figure:
Standard image High-resolution imageThe demerit in this type of system is that there is a possibility of oil creeping into the reaction chamber. The non-conflated reaction chamber has its reaction chamber completely separated from its hydraulic cylinder but linked by a form of cam profile [14] or RCMs designed without a hydraulic unit but the damping is controlled by means of a brake arm [43]. Figure 2 shows non-CRC systems; a typical example is the Shanghai Jiao Tong University RCM.
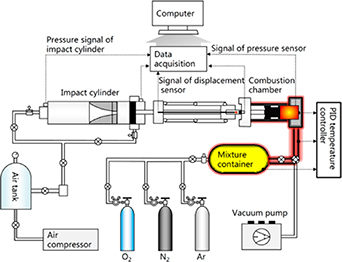
Figure 2. Shows the Shanghai Jiao Tong University rapid compression machine adapted from [43] (© 2014, American Chemical Society) which is classified under the non-CRC systems.
Download figure:
Standard image High-resolution imageIn a conventional RCM design, the orientation involves a direct coupling of the hydraulic cylinder to the reaction chamber with interlinking shaft or rods connected from the pneumatic cylinder to the reactor piston. The hydraulic system is characterised with high pressure oil which keeps the reactor piston in position and controlled by the solenoid valve. Once a run is activated by releasing the solenoid valve, the hydraulic fluid flow into the oil reservoir then a higher pressure in the pneumatic cylinder propel the reactor piston as it compresses the test gas mixtures ahead of it [11, 12, 19, 44]. This type of design as earlier discussed may be prone to oil leakage or seepage because of its direct conflated nature. In practice, the hydraulic seal is subjected to dynamic force from fast-moving shaft rods. There is, however, a distribution of the contact pressure around the sealing contact and this contact pressure depends on the geometry of the sealing edge [45]. During operation, hydraulic seals experience continuous wears, subjected to dynamic stresses by the shaft which not only reduces service life, but the sealing edge geometry also changes gradually overtime of operation, the variation in sealing edge geometry eventually leads to room for small oil leaks to enter the reaction chamber, thus hindering the fidelity of experimental data. With this defect, the zero leakage nature of the seal cannot be guaranteed. Although, no research has been conducted on the nature of seals in the hydraulic braking system of RCM, but in future, a critical study needs to be initiated. Therefore, this work presents the design and characterisation of RCM, which introduces a specially designed pneumatic system to lock/releases the initial position of the reactor piston. The performance of the current facility is demonstrated over a wide range of experimental conditions.
2. Facility design
2.1. Experimental facility
The Sheffield piston released rapid compression machine (SHEF-PRRCM) can be described as a simple piston cylindrical system that uses an external force of compressed gas to propel the reactor piston rapidly within the cylinder. The reactor piston compresses the test gas mixture in the cylinder, similar to the compression stroke of an ICE resulting in a very rapid spike in pressure and temperature. Figures 3 (a) and (b), shows the pictorial and sectional view of the current SHEF-PRRCM. It consists of a pneumatic cylinder, the hydraulic cylinder, piston release mechanism (PRM), the reaction chamber and an optimised piston crevice head produced based on Mittal's [19, 46] design. Other supplementary components, such as the linear variable differential transformer (LVDT), pressure sensors, and temperature sensor were also installed in the test facility. The machine is mounted on a horizontal steel frame support of approximately 2.1 m in length.

Figure 3. Shows the SHEF-PRRCM test facility (a) pictorial view and (b) sectional view.
Download figure:
Standard image High-resolution image2.2. The pneumatic driver cylinder
The driver section (pneumatic cylinder) of the unit is a single-acting actuator 890 mm long. It consists of a cylinder with a diameter of 100 mm, connected to a piston rod with a diameter of 25 mm. The steel bar is 728 mm long and the pneumatic driving cylinder has a maximum stroke length of 600 mm. The profile barrel is made of anodised aluminium with the end cap made of die cast aluminium. The piston rod is made of stainless steel (martensitic). At the end of the piston rod, an internal M24 × 1.5 thread, 40 mm long was machined on the rod, which is connected to the M24 × 1.5 external thread of the hydraulic damping rod. The initial cushion volume of 242 cm3 and the theoretical thrust of 6 bar outstroke is 4710 N. The air consumption at 6 bar outstroke is 0.55 l cm−1. The test facility has two air preparation kits which are operated up to a pressure of 11 bar. The air preparation kits consist of a pressure gauge equipped with a double air filters. One unit controls the compressed air flow into the pneumatic driver cylinder while the other serves the PRM unit. A polyethylene plastic tube of 8 mm outer diameter (OD) and inner diameter (ID) of 5.5 mm were used for all the pipe network of the facility. The polyethylene plastic tube from the high pressure reservoir is connected to the inlet port of the pneumatic driver cylinder utilising Tees, the air preparation unit and valve arrangement.
2.3. The hydraulic cylinder
The hydraulic device consists of a ring, groove and a shaft rod couplings bounded in a cylinder filled with hydraulic oil. The profile barrel is made of anodised aluminium with an end cap made of pressure die cast aluminium. The hydraulic chamber is 400 mm long and 100 mm in diameter. The hydraulic piston ring is made of stainless steel and the groove is made of anodised aluminium. The hydraulic groove has a diameter of 25 mm and is designed to form two solid ring sections and a groove between these solid sections. The trapped oil in the hydraulic groove is displaced through a small clearance and the reactor piston is damped until it finally locks at the end of the stroke.
The large solid ring section has an OD of 97.9 mm and an ID of 63 mm with a thickness of 15 mm. The second solid ring section has an OD of 43 mm and an ID of 25 mm and a height of 10.10 mm. However, the area in which the fluid is trapped is approximately 20 mm. The hydraulic groove is permanently fixed to the end of its cylinder [10].
The hydraulic ring is mounted on a shaft rod as shown in figure 4. It is made up of two solid sections. The large solid section is 15 mm thick and has an internal M24 × 1.5 thread made at the centre of the ring with an OD of 97.04 mm and ID of 80 mm. The small solid ring section has an OD of 63 mm and ID of 43 mm. Four holes of M5 × 0.5 internal threads were drilled at 90° to each other on the surface of the small solid ring. These holes accommodate the screws that are used to fasten the small solid ring to the large solid ring section which firmly holds it. This design make way for replacement of the small ring section in the event of subsequent damage.
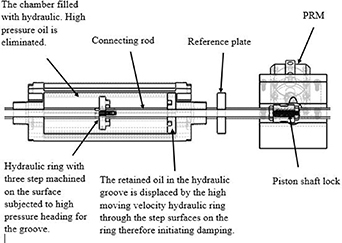
Figure 4. Shows the sectional view diagram of the hydraulic cylinder and PRM with the linked connecting shaft.
Download figure:
Standard image High-resolution imageThe hydraulic cylinder rod is interlinked with the pneumatic cylinder rod machined with an external M24 × 1.5 thread and has a threaded section of 40 mm long. This section carries the hydraulic ring which is screwed onto the pneumatic cylinder rod. An interconnecting link between the pneumatic cylinder and the hydraulic chamber unit are made through this process. The entire length of the hydraulic rod is 322 mm and, at the opposite end, a 40 mm length of M16 × 1.5 internal thread was made to fit the final link with the shaft rod carrying the reactor piston, the shaft lock and reference steel plate. The function of the hydraulic cylinder is to stop the inertia created by the reactor piston and gradually bring it to a complete halt at the end of the stroke. This is achieved by the venting of trapped oil through the clearances/annulus on the surface of the ring. The clearance or gaps created provide a braking force that would eventually slow down the hydraulic piston as it finally locks into the groove. To reduce the drag on the hydraulic piston and increase its speed, the hydraulic piston has four holes of 2 mm diameter drilled at an angle of 45° on its surface. The best damping was achieved by making a three step on the hydraulic ring surface [10]. Figure 4 shows the schematic of the hydraulic cylinder and PRM with connecting shaft.
2.4. The reactor piston
The reactor piston is made of 6082-T6 aluminium alloy with a diameter of 40 mm, a length of 50 mm and a weighs approximately 122 g. Adequate clearance of 0.2 mm during design was considered for the piston and wall expansion. The piston is made hollowed to minimise its weight and to ensure evenly distributed stress throughout the piston body. The rod carrying the reactor piston and other parts (reference plate and piston shaft lock) is 520 mm long and has a diameter of 24 mm. Both ends of the rod were machined with an M16 × 1.5 external thread approximately 35 mm long. At the centre of the reactor piston rod, an external M24 × 1.5 thread was produced with a length of 100 mm. This threaded section accommodates the piston shaft lock that can slide within its section. The threaded section is the clearance limit for the adjustment of the stroke length of the facility, which has a significant effect on the adjustment in the compression ratios. One end of the rod is coupled to the reference steel pate, which has a centre bore with an internal M16 × 1.5 thread. This section of thread is connected to the end of the hydraulic shaft rod with the internal M16 × 1.5 thread. While the opposite end of the reactor piston rod is fitted to the M16 bolt and screwed to the reactor piston to maintain a perfect grip.
When designing the reactor piston, consideration was taken to reduce the backpressure motion due to overpressure of the reactor piston. Although, the ratio between the driven and drive piston diameter was 1:2.5. This is because a small force on the large piston of the driver will only produce a large pressure in the reaction chamber. The direction of piston Viton seals has been observed to play a significant role in the speed of the reactor piston. Several RCMs may have their Viton seals set in opposite direction [11, 19, 20]. Although others would prefer seals in the same direction as the ones used in the current design. As a result of our study, seals placed in the same direction guaranteed an airtight chamber. The physical properties of the seal should be considered during installation, especially when the reaction chamber is heated up to 130 °C. It has been observed that the seal expands more at higher temperatures then the frictional force between the seal and the reaction chamber walls is slightly higher, thus affecting the speed of the reactor piston, which increases the compression time slightly by about 2%. To overcome this defect higher pressure of about 3–5 bar is used behind the pneumatic cylinder to drive the piston. Two seals were recommended for the current SHEF-PRRCM; for light hydrocarbon fuel experiments, polyurethane U seals and the Viton U seals for heavier hydrocarbon fuel requiring high temperature heating. Figure 5 shows the sectional views of the crevice piston configuration. Previous work on the piston crevice using computational fluid mechanics analysis of piston geometry which had been documented by the authors [47, 48] and an optimum crevice volume of 283 mm3 was found to adequately suppress the roll up vortex from the reaction chamber walls [10, 49, 50].
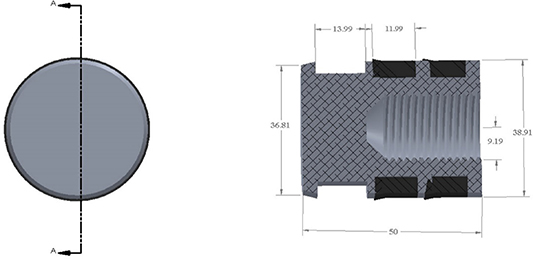
Figure 5. Shows section A-A view of the crevice piston design, dimensions in (mm). Reproduced with permission from [10].
Download figure:
Standard image High-resolution image2.5. The reaction chamber
Figure 6(a) presents a schematic view of the reaction chamber. The reaction chamber consists of two units; a cylindrical tube of 190 mm with an ID of 40 mm and an OD of 54.9 mm, respectively. The end of the reaction chamber is made of a solid block of steel. It is hexagonal in shape with a height of 110 mm and a width of 100 mm. The front of the block adjacent to the main cylinder tube is OD 54.98 mm and ID 43 mm. At a depth of 6 mm, an additional recess of 6.6 mm was machined to form an integral part of the reaction chamber. A carbonised copper gasket is placed between the surface of the recessed block and the cylindrical tube. The essence of the gasket is to guarantee an air tightening system when the units are coupled together to form an assembly of the reaction chamber. The reaction chamber has been designed to hold up to 100 bar. The end of the reaction chamber is designed to accommodate four ports as shown in figure 6(b). The first port 4 mm and a depth of 10.01 mm is mounted with a piezoelectric pressure transducer which measures the dynamic pressure. The second port is 3.09 mm by 17.86 mm created for admitting fuel into the reaction chamber. The third port has a hole of 7.3 mm and a depth of 37.5 mm and this accommodated the 316 needle valve. This is used to admit compressed air into the chamber for the retraction and positioning of the reactor piston and also for the evacuation of exhaust gas after each experiments. The fourth port with the dimension of 11.94 mm by 21.84 mm is fitted with thermocouple located at the side within the recess section of the chamber block. The thermocouple measures the initial temperature of the chamber.

Figure 6. Shows (a) the schematic view of the reaction chamber and (b) the end view of the reaction chamber showing ports for instruments fitting.
Download figure:
Standard image High-resolution imageThe estimation of the reaction chamber volume was challenging due to the geometrical complications of the dead volume that needed to be accounted for effective representation in the numerical simulation. The volume was estimated using the dry method that was found to be appropriate and a more convenient approach from previous literature study [51–53]. The use of oil to estimate the volume was not an ideal approach, as the oil could stick to the walls and cavities (dead volumes) resulting in a defective estimated volume. In this study, the dry techniques were adopted using nitrogen gas to approximate the volume by applying the ideal gas law to estimate the volume of the chamber. The chamber volume was estimated to be 171 ml and the leakage to 0.33 ml was estimated to be about 0.19% of the chamber volume leakage. This was considered to be negligible without having any effect on the experimental result.
2.6. Novel PRM
PRM is one of the key components of the current SHEF-PRRCM. It is located between the hydraulic cylinder and the reaction chamber. The conceptualisation was to overcome any form of oil leakage that could find its way from the linking rods/shafts into the reaction chamber due to dynamic seal wears during operation. The system is pneumatically operated and controlled by a solenoid valve. It functions like the break that holds and releases the reactor piston from its position when fully engaged or not. The operating pressure range of the PRM is between 2 and 11 bar and this can be regulated depending on the required speed for the reactor piston. Figure 7 depicts (a) the isometric view and (b) the sectional view of the PRM coupled to rectangular block housing.
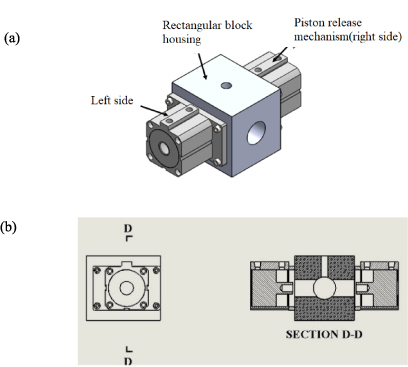
Figure 7. Shows PRM coupled to the rectangular block housing (a) the pictorial view and (b) the sectional view D-D.
Download figure:
Standard image High-resolution imageThe PRM consists of two double acting cylinders mounted on opposite sides of a rectangular block of 160 mm× 160 mm with a bore diameter of 50 mm drilled at the centre of the rectangular block. This hole provide easy access for the piston rod assembly to move in a linear manner. The 40 mm diameter hole is drilled on opposite sides of the rectangular block to accommodate the double acting cylinder known as the PRM, which extends and retracts its piston and controlled by the solenoid valve. An additional hole is made at the top of the rectangular block to allow the operator to view the contact points of the double acting cylindrical piston at the piston shaft lock. The piston shaft lock is cylindrical and tapered at its centre with M24 × 1.5 internal thread. The shafts are linearly connected from the pneumatic driving cylinder to the hydraulic cylinder and then to the reactor piston which passes through the 40 mm centre hole of the rectangular block. The shafts are properly aligned so that it does not sag onto the rectangular block housing during operation. Figure 8 shows the simulated circuit diagram of the operation of PRM using FLuidSIM software.

Figure 8. Shows the simulated circuit diagram of the PRM (a) extending the double acting cylinder piston when the solenoid valve contact switch is not established and (b) retracting the double acting cylinder piston when the solenoid valve is switch on while the contact is established.
Download figure:
Standard image High-resolution imageThe PRM is controlled by a solenoid (5 way 2 positions) valve. The solenoid valve has an inlet port, two-cylinder ports, and two exhaust ports which is classified as a 5 way 2 position valve as shown in figure 8. Compressed air flows from the reservoir at 7 bar into the air preparation unit (consisting of a pressure gauge and air filter unit) through port 1 of the solenoid valve. The polyethylene plastic tube was used to tap the compressed air flow from port 2 and port 4 of the solenoid valve into the outlet and inlet portion of the double acting cylinder. The maximum pressure used to drive the reactor piston is in the between 2 bar and 5 bar. A higher force than the force of the pneumatic cylinder is required to keep the reactor piston in position. The pressure gauge for the PRM is set to 3 bar, and the pressure on both sides of the double acting cylinder exerts a total of 6 bar on the piston shaft lock. This force is sufficient to maintain the reactor piston in position. In figure 8, the thick blue lines indicate the fluid flow pattern of compressed air flowing from the air reservoir through polyethylene plastic tube into the inlet or outlet of the double acting cylinder. Figure 8(a) shows the schematic simulated circuit diagram extending the double acting cylinder piston when the solenoid valve switch is turned off and contact is not established. This operates when the PRM pressure regulator is set to 3 bar compressed air flows into the inlet port of the double acting cylinders, it pushes or extends the piston outwards, grips on the piston shaft lock and keeps it in position as shown in figure 8(a). Air flows from the inlet port of the double acting cylinder flows through the polyethylene plastic tube through port 4 of the solenoid valve to exhaust.
Figure 8(b) shows the schematic simulated circuit diagram retracting the double acting cylinder piston when the solenoid valve is switched on while the contact is established. When the solenoid valve is switched, contact is made and the coils in the solenoid valve are energised as current flows into the circuit. This shift or move the position of the port of the solenoid valve. Port 4 of the solenoid valve opens, while port 2 closes, compressed air flows into the outlet port of the double acting cylinder, retracting the piston inward. When the switch is turned off, the solenoid valve is de-energised and the spring at the end of the valve pushes the ports back to their initial position, thus closing port 4 and opening port 2 for compressed air flow to the inlet of the double acting cylinder.
2.7. Piston displacement measurement
The piston stroke/displacement profile was measured using the LVDT model DCTH 4000C. The LVDT is positioned in front of the hydraulic chamber coupled to the reference steel plate via 'Y' steel handle. The steel plate is 8 mm in diameter and 6 mm in thickness. The top is screwed to the surface of the reference steel plate while the bottom of the 'Y' steel handle was fastened to the core of the LVDT with a nut. This was done to allow the LVDT to record any movement of the reactor piston with the corresponding displacement. The optical sensor was mounted at a distance of 4 mm and aligned to the edge reference plate. As the reflective surface moves away from the optical sensor a 5 V signal drop is received via the LabVIEW programme. The computed compression time for the reactor piston is the time the optical sensor witnesses a 5 V drop or rise to the point of maximum displacement at TDC. Figure 9(a) shows the stroke of the reactor piston up to 130 mm. The workable stroke for the current facility is 141 mm, but the facility could measure up to a maximum of 152 mm stroke and a compression ratio of up to 20 mm by adjusting the shaft lock and chamber volume clearances. The stroke could be changed in two ways. First, by turning the piston shaft lock clockwise or anticlockwise within a limit of 27 mm. Second, by moving the reaction chamber 5 mm within its screw slot giving a total allowable clearance of 32 mm. Figure 9(b) shows the compression ratios and their corresponding volumes at TDC.

Figure 9. Shows (a) the LVDT measurement of the piston stroke with respect to time. (b) Attainable maximum compression ratio for the present facility.
Download figure:
Standard image High-resolution imageFigure 10 depicts the pressure profile for a reactive and nonreactive test conducted at Pc = 10.8 bar, Tc = 388 K and ϕ = 1.0. The stroke length is 140 mm and a compression ratio of 8.0. Time t = 0 represents the end of compression (EOC) when the piston has reached its TDC. The post compression duration of 100 ms. The compression time for the experiment shown in figure 10 is approximately 28 ms, with the final 50% of the pressure rise occurring in 2–4 ms. The compression time of the current facility can be varied by using different driving pressures in the range of 2–6 bar. The current operational characteristics of SHEF-PRRCM are shown in table 1.

Figure 10. Shows the reactive and nonreactive experiment of Jet A-1 at a compression ratio of 8.0 and a compression time at t50 27.9 ms.
Download figure:
Standard image High-resolution imageTable 1. Shows the operating characteristic of the present facility.
| Stroke length | 120–152 mm |
| Compression ratio | 4–20 |
| Volume at TDC | 100.6–502 cm3 |
| Compression time | 23–52 ms |
3. Experimental procedure
The facility operates essentially in a closed loop and has seven valves operating at different intervals to keep compressed air flowing through the system. Figure 11 shows the schematic piping network for the current SHEF-PRRCM. There are possibly two units of the air preparation kits. One serves the pneumatic cylinder while the other controls compressed air into the PRM unit via the solenoid valve. The operating pressure of the pneumatic cylinder is between 2 bar and 6 bar while the operating pressure of the PRM is an average value of the pneumatic driving pressure. For example, if we had a driver pressure of 6 bar behind the pneumatic cylinder, an average pressure of 3 bar is good enough to hold the piston shaft lock in position. The solenoid valve control switch is switched on. The letter V denotes the ball valve and the number attached is the arbitrary position of the valves in figure 11. Compressed air flows from the air reservoir into the facility at a pressure of 7 bar, while V1, V2, V3, V4, V5, V6 and V7 remain closed at this point.
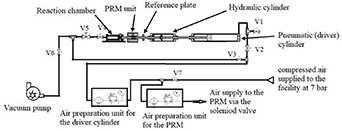
Figure 11. Shows the schematic piping network of the current SHEF-PRRCM.
Download figure:
Standard image High-resolution imageWhen V7, V1 and V2 are open and then pressure gauges regulated to the desired pressures. Compressed air flow in through the air kit to the inlets of the PRM and the pneumatic cylinder where both devices are fully charged with compressed air. The compressed air in the PRM pushes the double acting cylinder to extend its piston outwards, creating a compressive force on the surface of the piston shaft lock. This effect holds the reactor piston in the BDC waiting to be triggered by the solenoid switch. Before the facility is run, a BOC Edward E2-M12 vacuum pump is used to vacuum the chamber while V4, V5 and V6 remain open for the vacuum process and V1, V2, V3 remain closed. A known volume of 179 ml of nitrogen gas corresponding to the volume of the chamber is injected and then vacuum for about 10–15 min to remove the air from the system. When the required vacuum pressure (10−3 Torr) is reached at a steady state, V1–V6 remains closed. The required volume of fuel/air mixtures is directly injected into the reaction chamber through the septum at the fuel inlet port. The molar ratio of 3.76:1 of N2:O2 was used to prepare the fuel and air mixture and the gases extracted by using a 60 ml syringe and for the fuel a syringe with a delivery volume of 50 µl (700 series). Table 3 shows the composition (percent volume) of the tested fuels. The temperature of the chamber wall is maintained by switching on the 420 W power output of FGH052-080L high temperature fibreglass tape that was rap around the reaction chamber. The tape has a length of 2.59 × 80 cm and a maximum exposure temperature of 420 °C. The temperature of the reaction chamber wall is monitored by the K-type thermocouple connected to the PID controller (Digital CB100L). The fuel/air mixture injected are left for a wait period of 1.5 h to homogenised before the facility is fired. This wait period occurred naturally without external pressure (high pressure injector up to 1500 bar). The fuel is currently being charged manually, but could be improved in the future by upgrade to the fuel injector (1000–2000 bar pressure range). This will subsequently improve the waiting time for evaporation and homogeneity of mixtures to approximately 90%–95% of the current waiting time.
Once the wait time has elapsed with V1–V6 closed, the solenoid switch is pressed to make contact and the PRM is retracted inwardly due to the differential pressure generated between the PRM and the driver section. The pressure behind the pneumatic cylinder drives the reactor piston compressing the fuel/air mixtures to a higher pressure and temperature at the end of the stroke. The data obtained from the experiment are the stroke profile, optical sensor data (timing of the piston travel) and pressure profile. The pressure data is captured by a piezoelectric sensor (Kistler 6009) coupled with a charge amplifier (Kistler 5007). The output voltage signals are sent to the NI-USB 9223 DAQ card reader logging at 100 kHz frequency.
The fired reactor piston is returned to its BDC position by keeping the fuel injection port closed and having V3, V4, and V5 open, while other valves remain closed. The pneumatic cylinder pressure gauge is set to about 1 bar, compressed air flows from behind into the reaction chamber pushes on the reactor piston with additional slight touch on the reference plate guides the reactor piston travel back to its initial position at BDC. At this point, the solenoid valve switch is activated while the PRM is retracted back allowing an easy transition of the reactor piston back to its sitting position at BDC. The same procedure is repeated and the system is ready for the next operation.
Following a succession of four or five runs, black deposit or soot is found on the wall of the reaction chamber, which is similar to that observed by other RCM [54] and ST facilities [55]. Research has shown that once the chamber is contaminated, the experiment is no longer reproducible. It is therefore appropriate that the reaction chamber and the reactor piston are decoupled and thoroughly cleaned with Isopropyl alcohol or acetone using a soft cloth and then re-coupled for the day experiments.
3.1. Autoignition definition and data measurement
Figures 12(a) and (b) shows the tests for both reactive and nonreactive experiments. One of the main elements measured in RCM experiment is the pressure history that is used to obtain the ignition delay time ( ) that is used to report the present data. Figure 12(a) shows a typical pressure history, P(t), and its derivative profile dp/dt, measured by the reactive experiment. The gas mixture is compressed to its first peak pressure, Pc, indicating the EOC at time = 0. The time from EOC is defined as the maximum of the pressure trace before the start of ignition. The
  is therefore defined as the time from the EOC to the peak in time derivative of the pressure where (dp/dt) is maximum. However, a subsequent pressure drop is observed due to the heat loss from the gas mixture to the walls of the reaction chamber. For reactive case, there is a sharp pressure rise after an induction time, indicating that ignition has occurred.
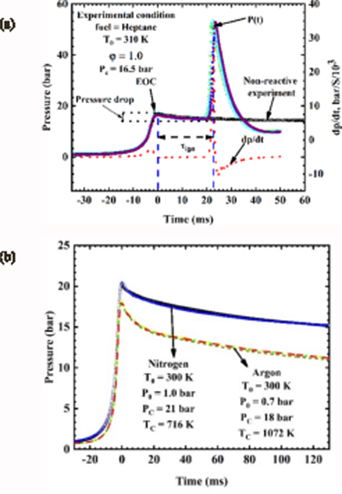
Figure 12. Experimental repeatability test of the current SHEF-PRRCM (a) reactive pressure trace (number of test = minimum of 3 runs). (b) Nonreactive pressure trace (number of test = minimum of 3 runs).
Download figure:
Standard image High-resolution imageIn figure 12(a) for the reactive experiment, the pressure trace during compression and post compression was seen to overlap each other demonstrating experimental repeatability at the tested condition. At the EOC, the pressure is seen to decrease due to heat loss from the gas mixtures to the wall of the reaction chamber. This effect of heat loss is estimated by conducting a nonreactive experiment corresponding to the reactive experiment as shown in figure 12(a). The nonreactive mixture was prepared by replacing O2 with N2 in the corresponding reactive mixture while keeping the same fuel concentration. This ensures that a similar specific heat ratio of the mixture is maintained and similar heat transfer conditions exist between the reactive case and the nonreactive counterpart.
In figure 12(b), a nonreactive test for nitrogen and argon gas was performed at two different Pc = 18 bar and 21 bar, which are shown as a function of time. The data obtained is raw pressure trace free of vibration or disturbance from the current device. A significant heat loss to the walls of the reaction chamber was shown for argon than nitrogen gas during the post compression period and due to the differences in their specific heat ratio [47]. In both experimental tests, at least three consecutive runs are performed at each condition and the value nearest to the mean of the measured data is reported as the representative value. The Tc at EOC is not measured directly because of the rapid heat loss from the compressed gas mixtures to the reaction chamber wall. However, Tc is estimated from the pressure history by applying the adiabatic core hypothesis and isentropic compression.
where  and
and  are the measured initial temperature and pressure of homogenising fuel/air mixtures, γ is the specific heat ratio of the gas mixture that is a function of temperature and
  is the experimentally measured pressure at EOC. The
  and
and  at EOC can be varied by changing the initial pressure, initial temperature and the geometrical compression ratio.
3.2. Fuels formulation and experimental condition
The molecular composition of two fuels, Aviation Jet A-1 labelled FST-265638 and Banner NP 1014 known as Bannersol, both extracted from gas chromatography (GC) data, is shown in figure 13. The chemical analysis of the fuels, piloted by in-house using a GC/MS system have shown to produce various compositions of Jet A-1 and Bannersol. The primary constituents of Aviation Jet A-1 labelled FST-265638, are cycloparaffin 37.65%, n-paraffin 19.35%, iso-paraffin 20.57%, Naphthenes 2.85%, Alkyl benzenes 15.55%, and Indans and Tetralin 3.81% by weight. The highest proportion of hydrocarbon is cycloparaffin while the least percentage value is aromatics which falls within the range of 18%–25% as normally recommended by the America Society for Testing and Materials (ASTM).
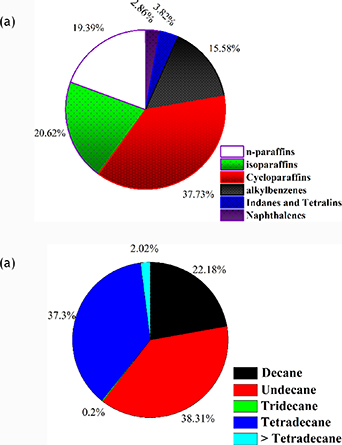
Figure 13. Shows the molecular class compositions as recognised by the GC analysis. (a) Aviation Jet A-1 fuel and (b) Bannersol.
Download figure:
Standard image High-resolution imageFigure 13(b) depicts the molecular composition of Banner NP 1014 known as Bannersol. It is consist of C10 to C14 hydrocarbons, which are considered to be a representative class of hydrocarbons found in Aviation Jet fuel. The relative proportion of binary fuel is 21.18% decane, 31.31% undecane, 0.2% Tridecane, 37.3% Tetradecane and about 2.02% greater than Tetradecane by weight.
Table 2 shows some of the selected properties for the test fuel for this study. The molecular weight (MW) for Jet A-1 and Bannersol is 165 g mol−1 and 167 g mol−1, while the derived cetane number (DCN) is 45 and 75 respectively. The H/C ratio is an important criterion for assessing the viability of these fuels. Bannersol typically has a higher H/C ratio that corresponds to have a higher energy content compared to conventional Jet A-1 fuel. The empirical formulas derived are C11.84H22.72 for Jet A-1 and C11.75 H25.49 for Bannersol. However, the corresponding equivalence ratio for both fuels was calculated basis on the formulation data obtained from the GC analysis.
Table 2. Selected fuel properties.
| Property | Jet A-1 (FST- 265638) | Banner NP 1014 |
|---|---|---|
| Density at 15 °C (kg m−3) | 805.3 | 755 |
| Distillation temp (°C) | ||
| Initial boiling point | 163.8 | 183 |
| Final boiling point | 259.1 | 250 |
| Kinematic viscosity at 20 °C (mm2 s−1) | 3.521 | 1.88 |
| Molecular formula | C11.84H22.72 | C11.75 H25.49 |
| MW(g mol−1) | 165 | 167 |
| Total C(g) | 142.3 | 141.1 |
| Total H(g) | 22.9 | 25.7 |
| Cx (mol) | 11.84 | 11.75 |
| Hy (mol) | 22.72 | 25.49 |
| %C | 86.1 | 84.5 |
| %H | 13.9 | 18.2 |
| HC ratio | 1.92 | 2.17 |
| DCN | 43.74 | 75 |
Table 3 shows the composition of the mixture for the test conditions studied. The fuels heptane, Jet A-1 and Bannersol were supplied by the Low Carbon Combustion Centre (LCCC) at the University of Sheffield. The gases used are of purity: O2: 99.993%, N2: 99.999%, Ar: 99.995%. For the entire study, a dry air mixture consisting of 21% O2, 79% N2 was used and diluted with argon gas to alter the EOC at TDC. Liquid fuel was transported from the fuel bank to sample glass bottles that had been properly labelled to prevent cross-contamination prior to the experiment. In addition to any experiment, the gases are transported from the cylinder to the Teflon gas bags properly labelled and the leftovers are discarded after each experiment to prevent the possible diffusion of the gas.
Table 3. Experimental test conditions.
| Molar composition (%) | Equivalence ratio | EOC pressure (bar) | |||||
|---|---|---|---|---|---|---|---|
| Jet A-1 (FST 265638) | Heptane | Banner NP 1014 | O2 | N2 | Ar | ϕ | Pc |
| 0.86 | 0.86 | 20.82 | 78.32 | 0.75 | 6,10 | ||
| 1.14 | 1.14 | 1.14 | 20.76 | 78.10 | 1.0 | 6,10,20 | |
| 0.86 | 0.86 | 20.82 | 58.74 | 19.58 | 0.75 | 6,10 | |
| 1.14 | 1.14 | 20.76 | 58.58 | 19.52 | 1.0 | 6,10 | |
4. Results and discussions
Ignition delays of the Aviation Jet A-1 and Bannersol were studied at compressed gas temperatures, Tc of 697 K ⩽ Tc ⩽ 884 K, Pc = 6 bar and 10 bar, and ϕ = 0.75 and 1.0. In addition, heptane data at Pc = 20 bar, ϕ = 1.0 and compressed temperature, Tc of (625 K ⩽ Tc ⩽ 688 K) was provided to complement the comparison of the current facility with literature.
4.1. Combustion of bannersol
4.1.1. Low to intermediate temperature ignition delay time measurement of Bannersol.
The ignition delay times of Bannersol/air mixture were measured in the preheated RCM at Tc = 718 K to 895 K, ϕ = 0.75 and 1.0 and Pc = 6 and 10 bar. Figures 14 and 15 depicts the ignition delay time plot as a function of 1/Tc at ϕ = 0.75, 1.0 and Pc = 6 bar, 10 bar with the corresponding error bars. The estimated uncertainty reported in this work was derived from the standard deviation of the minimum of three repeated tests for each condition used to evaluate ignition delay times. Based on this analysis, the error in Tc was estimated to be less than (±1%), the deduced compressed gas temperature of a given experiment, the error in Pc was estimated to be less than (±1.6%) and the overall uncertainty in the ignition delay is less than (±5.7%). The error bars are shown in figures 14 and 15, where most of the vertical bars (ignition delay time errors) are difficult to distinguish because they are smaller than the markers.
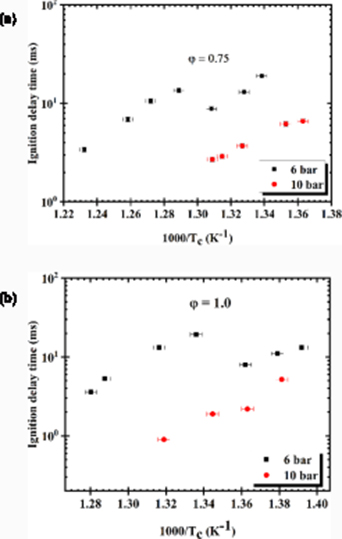
Figure 14. Shows the Arrhenius plots for Pc = 6 and 10 bar (a) lean and (b) stoichiometric condition. Experimental ignition delay time with uncertainty (±5.2%) y-error bar and (±0.2%) x-error bars. Filled black square symbol: 10 bar, filled red cycle: 6 bar.
Download figure:
Standard image High-resolution image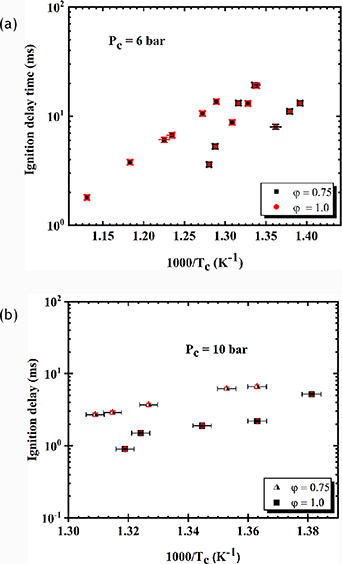
Figure 15. Influence of equivalence ratio on Bannersol ignition delay: conditions: ϕ = 0.75 and 1.0 (a) 6 bar and (b) 10 bar. Experimental ignition delay time with uncertainty (±5.2%) y-error bar and (±0.2%) x-error bars. Filled black square symbol: ϕ = 0.75, filled red cycle: ϕ = 1.0.
Download figure:
Standard image High-resolution imageFigure 14(a) shows the ignition delay time against the inverse of Tc at lean condition, ϕ = 0.75 and Tc = 747 K to 811 K, Pc = 6 and 10 bar. We have observed that the ignition delay decreases with an increase in Tc in the range from 747 K to 764 K. Above 764 K, NTC behaviour is set at a temperature range of 764 K–775 K where the ignition delay time increases with increasing Tc. These two points where the NTC exists are characterised as the upper limit temperature, Tupper and the lower limit temperature, Tlower. Further increase in Tc away from the Tupper causes a recurrence by decreasing the trend in the measured ignition delay as observed in the plot. It has been observed that the increase in Pc has a significant effect on the ignition delay time. At higher pressure, the concentration of the reactant increases thereby increasing the reaction rate thus reducing in the ignition delay.
Subsequently, figure 14(b) depicts the Arrhenius plot at stoichiometric condition, Pc = 6 bar and Tc in the range of 718 K–781 K. The ignition delay time decreases with increasing Tc in the range of 718 K–734 K displaying Arrhenius behaviour. Further increase of Tc away from 734 K, the ignition delay exhibited NTC behaviour in the region Tc = 734 K–748 K. Above the Tupper an increase in Tc consequently leads a decrease in the ignition delay time. Figure 14(b) shows the influence of Pc is seen on the ignition delay at lean and stoichiometric condition, ϕ = 0.75 &1.0. Similarly, increasing Pc means higher temperatures and pressures that accelerate the speed of molecules and number density of the molecules thus increasing the frequency of collision resulting in higher rate of chemical reactions that led to a reduction in the ignition delay. However, it is clear from figure 13 that, at lower pressure of 6 bar, the NTC behaviour is prominent at ϕ = 0.75 and 1.0 and at higher pressure the disappearance of NTC and exhibit a monotonically increasing trend of ignition delay with a decrease in temperature. It has noticeably being revealed that at NTC region, the reactivity of paraffin is controlled by the low temperature chain branching: R + O2 ↔ RO2 ↔ QOOH (+O2) ↔ OOQOOH → 2OH + product. The reaction pathway is governed by the R + O2 ↔ RO2 equilibrium and the rate of isomerisation RO2 ↔ QOOH [56]. Further away from the Tupper and Tlower of NTC an Arrhenius behaviour is significantly established.
The effect of the equivalence ratio on the ignition delay time of Bannersol is seen at both compressed gas pressures. The increase in the equivalence ratio leads to a higher reactivity resulting in a reduction in the ignition delay time.
4.2. Comparison of Jet A-1 and Bannersol
The comparison of the ignition delay provides insight into the understanding of the influence of the fuel structure on the ignition propensity and fuel chemistry. An Arrhenius plot comparing Jet A-1 and Bannersol as shown in figure 16 at lean and stoichiometric condition, ϕ = 0.75, 1.0 and Pc = 6,10 bar with the corresponding error bars. Bannersol exhibited a higher reactivity than the Jet A-1. The differences in reactivity perceived for both fuels are attributed to their classification groups (n-paraffins, iso-paraffins, and cyclo-paraffins), hydrogen-to-carbon ratio and the chemical structure of hydrocarbon [57, 58]. And these differences in reactivity can be explained by the relative significance of low temperature chain branching reactions over chain-propagating or chain-terminating reactions. However, the proportion of concentration the classification group determines the global rate of low temperature chain branching over the influence of different paraffnic bonding environments on the steadiness of RO2 and the rate of H-atom transfers in the RO2 ↔ QOOH isomerisation. Referring to the class composition data in figure 13, Jet A-1 has a higher percentage by weight of cycloparaffin and aromatic content compared to Bannersol, which are distinct from petroleum-derived fuels in that, the aromatic components are not present at a significant fraction. However, the justification having Jet A-1 less reactive than Bannersol is that Jet A-1 chemistry is driven by the cycloparaffin, while that of Bannersol is by the n-paraffins. At low temperatures, the oxidation of cyclo-components is much lower than that of an n-paraffn mainly due to the isomerisation pathways and olefin formation [59]. On the other hand aromatics in Jet A-1 fuel scavenge radicals, which eventually slow ignition chemistry. It is more predictable to scale the ignition propensity of Jet A-1 and Bannersol fuels on a cetane number which is shown in table 2. Bannersol has a higher cetane number of 77 than Jet A-1 which is 45. The comparative ignition delays of both fuels are found to be consistent with their cetane numbers where Bannersol has a higher cetane number, more reactive and therefore having a shorter ignition delay time [42]. This similar trend is consistent with other works reported by Kamal and Sung [60] where they investigated the ignition delay time of an alternative fuel S-8 and two petroleum fuels Jet A and JP-8 found out that S-8 had the highest reactivity than other fuels. Valco et al [61] reported a similar result from their work, where they studied the ignition delay of military aviation fuels, camelina-derived hydroprocessed renewable Jet fuel and isoparaffinic solvent in an ST and RCM.
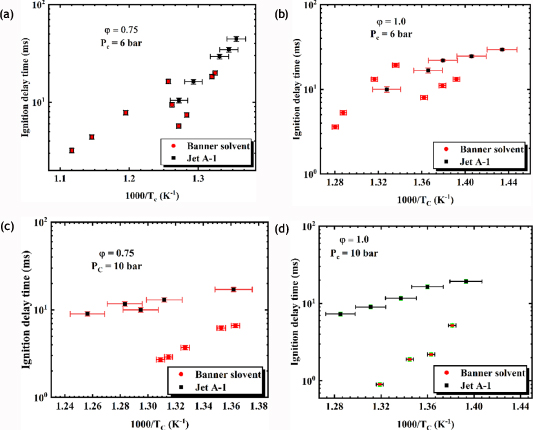
Figure 16. Comparison of Bannersol and Jet A-1 ignition delay at (a) and (b) Pc = 6 bar, ϕ = 0.75 and 1.0, and (c) and (d) Pc = 10 bar, ϕ = 0.75 and 1.0. Experimental ignition delay time with uncertainty y-error bar (±5.7%) and x-error bars less than (±1%). Filled black square symbol: Jet A-1. Filled red cycle: Bannersol.
Download figure:
Standard image High-resolution image4.3. Comparison of fuels with literature data
Because of the inherent non-ideality effects of the heat loss in RCM experiments, comparisons of ignition delay time between facilities have more limited values which can produce different results. Different machines have different magnitudes of deviation from ideal conditions, making the comparison of results between facilities difficult. In recent work, a more useful approach to comparing the performance of facilities is by matching the evolution of the experimental pressure trace effectively with the predictions of chemical kinetic models [62]. This may account for changes in pressure and temperature during the induction period that will have an influence on the ignition delay. Nonetheless, this is necessary when the kinetic models are well characterised, which is unlikely for the current tested fuels. Although this goes beyond the scope of the current study which mainly focuses on demonstrating the capacity of the present facility. Figure 17(a) shows the comparison of current heptane ignition delay time with other facilities in literature, such as shock data from Kuiwen et al [63] at Pc = 20 bar, Tc of (723 K ⩽ Tc ⩽ 1412 K), and ϕ = 1.0. RCM's data from Chung et al [64] at condition of 15 bar, ϕ = 1.0, Tc at (686 K ⩽ Tc ⩽ 1077.5 K), and Davis Anthony [65] at Pc = 15, 20 bar, Tc at (638 K ⩽ Tc⩽ 712 K) and ϕ = 1.0.

Figure 17. Comparison of current facility with ignition data with literature (a) heptane ignition delay with uncertainty y-error bar (±5.1%) and x-error bars less than (±1%). (b) Jet A-1 with uncertainty y-error bar (±5.7%) and x-error bars (±1%).
Download figure:
Standard image High-resolution image
As depicted in figure 17(a) the current data has a lower ignition delay compared to data in the literature. It was observed that within the condition study the current data did not exhibit any NTC behaviour while other facilities except Chung et al [64] exhibited the NTC behaviour at Tc = 804–896 K which is higher than the Tc of (625 K ⩽ Tc ⩽ 688 K) of the current data. In figure 17(a) we can variably conclude that despite the slight differences in compressed temperature and the facility non-ideal effect, the current data are consistent with Chung et al [64] and Davis Anthony [65] at the condition studied, but slightly deviated from Kuiwen et al [63] data.
Figure 17(b) illustrates the comparison of the current data on Jet A-1 with previous RCMs and ST experiment in literature. Especially, Jet-A/JP-8 ignition data reported by Kumar and Sung [60], and JP-8 ignition delay data reported by Casey et al [66]. These Jet fuels are conventional fuels obtained from different sources but are expected to show no high level of significant differences in their combustion behaviour. Despite the differences in Tc the RCM ignition delay described by Kumar and Sung [60] and Casey et al [66] was obtained under slightly similar conditions of Pc, equivalence ratio and molar composition, thereby exploiting the opportunity of a fair comparison. All the fuels recorded in literature exhibited a two-stage ignition delay and NTC compared to the current data. However, this discrepancy could be attributed to the range of Tc considered, where the current data captured ignition delay at compressed temperatures of 697 K ⩽ Tc ⩽ 753 K at ϕ = 1.0 and Pc = 6 bar, while the Casey et al [66] showed ignition data at compressed temperatures of 656 K ⩽ Tc ⩽ 766 K at ϕ = 1.0 and Pc = 7 bar. Kumar and Sung [60] study compressed temperature at 648 K ⩽ Tc ⩽ 894 K at ϕ = 1.12. As earlier discussed the possible discrepancy in the dataset could be attributed to (a) the heat loss effect in the reaction chamber. This is a major factor which is responsible for having scattered data from different RCM operating under similar conditions. (b) Differences in the concentration of test conditions.
5. Conclusions
The current SHEF-PRRCM introduces a new type of rapid release machine with a set of pneumatic systems to hold the reactor piston in its initial position. Five key components of the facility include the optimised piston gap, the reaction chamber, the hydraulic mechanism, the cylinders or actuators and the PRM. This facility has been designed to optimise RCM, thereby improving the data accuracy for optimal kinetic mechanism validation. The SHEF-PRRCM is pneumatically operated, triggered by the solenoid valve to activate the PRM system and stopped hydraulically. The reactor piston compresses fuel/air mixture in front of it between 23 ms and 52 ms in an almost adiabatic condition similar to the compression event of the IC engine. The compression ratio of the system is 4.4–20. The rig was characterised by conducting a nonreactive and reactive experiment, the results have shown that the current facility can achieve a compressed gas pressure of 22 bar and end gas temperature of ⩽1000 K. The test results of the nonreactive and reactive pressure profiles have shown a repeatable experiment that overlaps each other both at compression and post compression stages. Characterisation of fuels was carried out on Jet A-1 and Bannersol at Tc of (723 K ⩽ Tc ⩽ 884 K), Pc = 6 bar and 10 bar and equivalent ratio, ϕ = 0.75 and 1.0. The influence of temperature, pressure and equivalence ratio was seen on the ignition delay time of fuel tested. Under varying conditions, Bannersol showed NTC behaviour at Tc of (734 K ⩽ Tc ⩽ 795 K). Comparison of Bannersol with Jet A-1 showed that Banner has higher reactivity than Jet A-1 mainly attributed to the paraffinic content of Bannersol. Also, Jet A-1 data were compared in literature, the current experimental data was found to have slightly deviated from the data in literature. This discrepancy may have been attributed to the differences in the heat loss in the facility and the variance in the range of compressed temperatures and pressures investigated in the current facility. The estimated uncertainty in Tc is less than (±1%), uncertainty in Pc is less than (±1.6%) and the uncertainty in the ignition delay is less than (±5.7%). The results presented here provide a foundation for future work, where a more varied set of pressures, temperatures, and equivalence ratio will be tested for fuels in future.
Acknowledgments
I thank the Department of Mechanical Engineering at the University of Sheffield for funding this research. I extend a heartfelt appreciation to Mr Nettleship for his lengthy involvement and contribution to the design of the SHEF-PRRCM test facility. His work was remarkable and motivating, making sure any issues that arose from the test facility were resolved. Oliver Cooper provided his assistance and was always in the lab. I would like to thank the staff at LCCC for providing fuel for the experimental work.