

Abstract
Time-gated (TG) Raman spectroscopy (RS) has been shown to be an effective technical solution for the major problem whereby sample-induced fluorescence masks the Raman signal during spectral detection. Technical methods of fluorescence rejection have come a long way since the early implementations of large and expensive laboratory equipment, such as the optical Kerr gate. Today, more affordable small sized options are available. These improvements are largely due to advances in the production of spectroscopic and electronic components, leading to the reduction of device complexity and costs. An integral part of TG Raman spectroscopy is the temporally precise synchronization (picosecond range) between the pulsed laser excitation source and the sensitive and fast detector. The detector is able to collect the Raman signal during the short laser pulses, while fluorescence emission, which has a longer delay, is rejected during the detector dead-time. TG Raman is also resistant against ambient light as well as thermal emissions, due to its short measurement duty cycle.
In recent years, the focus in the study of ultra-sensitive and fast detectors has been on gated and intensified charge coupled devices (ICCDs), or on CMOS single-photon avalanche diode (SPAD) arrays, which are also suitable for performing TG RS. SPAD arrays have the advantage of being even more sensitive, with better temporal resolution compared to gated CCDs, and without the requirement for excessive detector cooling. This review aims to provide an overview of TG Raman from early to recent developments, its applications and extensions.
Export citation and abstract BibTeX RIS

Original content from this work may be used under the terms of the Creative Commons Attribution 4.0 license. Any further distribution of this work must maintain attribution to the author(s) and the title of the work, journal citation and DOI.
1. Introduction
The Achilles' heel of conventional Raman spectroscopy (RS) is sample-induced fluorescence emission. This is a competing phenomenon, occurring with relatively weak Raman scattering, and can obscure the whole Raman spectrum, making the identification or quantification of materials impossible. An effective solution to this problem is time-gating (TG), which is a general technique used in signal processing [1]. The purpose of TG spectroscopy is the measurement of signals during a specific portion of time, which enables the monitoring of transient processes [2]. TG found its way into RS as early as in the 1970s, as scientists sought out ways to remove fluorescence background signals during measurements, cf. chapter 1.3 [3]. However, TG Raman has only become commercially available in recent years. To extend the applicability of RS in general, it is important to overcome the fluorescence limitation.
RS is based on the inelastic scattering of photons shifted from the excitation wavelength, known as Stokes and Anti-Stokes shifts [4]. It is employed to provide information about excited molecules in a given sample. Similarly to infrared spectroscopy (IR), this information can be used to study the chemical or biological fingerprint of materials at different states of aggregation (solid, liquid, or gas) [5, 6]. However, band intensities and selection rules are important differences between the two vibrational spectroscopic techniques. In RS, the transition of polarizability of the molecules is shifted from the excitation wavelength, whereas IR relates to the transitional dipole moment [7]. Commonly a monochromatic excitation light source (laser) is used for RS, whereas for IR, a broader excitation source (LED or halogen lamp) can be used. The fundamental advantage of RS over IR is that it can be used to investigate liquid or moist samples without strong interference from water responses. The two techniques often complement one another, if the concentration of water in the sample is low. Overall, the applicability of any analytical technique is also dependent on the properties of the sample itself, as the optical scattering efficiencies vary in solid materials, particles in liquids, and droplets/bubbles in liquids, which can, for example, cause photons to be scattered multiple times, making quantitative and qualitative analyses challenging [8].
In general, both vibrational spectroscopic methods allow measurement results to be rapidly obtained, unlike many other analytical methods [8]. However, RS provides the full set of rotational and vibrational spectral information, which is otherwise only available by combining mid-infrared and far-infrared detection techniques [9]. Unfortunately, Raman scattering is weak: from about 107 laser excited photons, only one Raman photon is inelastically scattered [7]. Sufficient RS signal intensities can be achieved by increasing laser power to a moderate level, optimizing the detector integration time, and ensuring that laser and collection spots are properly focused to the target while not damaging the sample. The quality of the detected Raman signal depends on several factors, relating either to the instrument itself, the sample under inspection, the setup, or the surrounding conditions. These factors can include (a) the detector itself, or detector shot noise that can be limited when the spectrometer detector is cooled and/or temperature stabilized, (b) the sporadic but high intensity detection of cosmic rays, (c) black-body radiation (d) ambient light such as LEDs, or incandescent bulbs, as well as mercury-vapor or gas-discharge lamps, and (e) fluorescence and other types of photoluminescence interference [10–14]. A common solution for performing Raman measurements without ambient light interference is to measure in a dark space, or by placing the sample in a stray light sealed sample enclosure. The broad spectral disturbance of fluorescence in Raman measurements represents a major challenge across all fields where RS is currently employed, and limits its wider application [7]. For example, the low Raman effective cross-section per molecule (Raman scattering of around 10−31 to 10−29 cm2) is dependent on λexc( excitation wavelength); where the surrounding refraction index (sample medium) to fluorescence effective cross-section per molecule is approximately 10−16 cm2, it is clearly difficult to obtain viable Raman measurement results with strongly fluorescent samples [5, 15].
Fluorescence background may originate from impurities in the sample/solvent, the matrix components of samples (especially where these are coloured), or the analyte itself [14]. Fluorescence background may also originate from optical components in the pathway of the spectrometer, such as lens coatings. Occasionally, fingerprints on lenses or on fibre connectors may cause fluorescence. The Raman signal strength  is a function of the fundamental laser wavelength. It is proportional to the fourth power of the laser wavelength
  , the intensity of the laser radiation
  , the number density of scattering molecules
  — of which a major part may originate from sample-induced fluorescence, cf. equation (2) — and the polarizability change
  as described in equation (1):
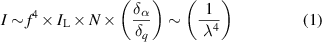
[10, 16]. The strength of the Raman signal increases with the fourth power of the frequency of the incident light. Raman and fluorescence emissions are high in the visible spectral region (around 530 nm), as shown in figure 1, but decrease towards the near infrared spectral range [7, 10].
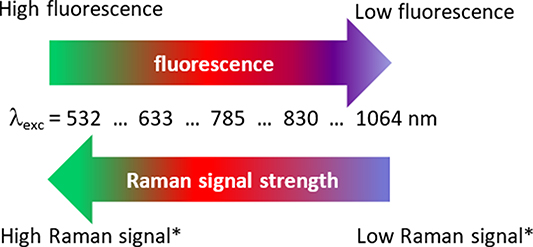
Figure 1. Raman signal strength and influence of the fourth-power rule (*) with respect to common Raman excitation wavelengths and the impact of fluorescence emission, modified with permission from ref [10].
Download figure:
Standard image High-resolution imageFigure 1 can also be extended to include shorter wavelengths i.e. the UV spectral range, where at very short wavelengths, fluorescence is no longer a problem, but the risk of sample degradation generated by the UV laser is increased [7]. An common practical compromise between the amount of available Raman scattering and fluorescence reduction is the use of a 785 nm laser excitation wavelength with corresponding Raman spectrometer setup. However, this setup may not be applicable for high fluorescent samples, as discussed below, in the application and extension sections of this TG Raman review. According to the Perrin-Jablonski molecular energy level diagram, the fluorescence process itself is determined by excitation, conversion and emission, which occur at different times. There are three stages operate as follows: (i) the excitation of fluorophore molecules by re-radiating photons, which occurs within femtoseconds, (ii) in approximately the same time frame, non-radiative internal conversion processes take place due to vibrational relaxation, and (iii) detectable fluorescence emission occurs over a much slower time frame, i.e. around the pico- to nano-second scale, depending on the sample [17].
The main aim of the TG principle in RS is to suppress sample-induced fluorescence, as well as phosphorescence, during the measurement process, and to keep the signal-to-noise ratio (SNR) sufficiently high while simultaneously suppressing other potential continuous disturbances, such as ambient light and thermal emissions [18].
The SNR, as shown in equation (2), can be maximized by tuning the width and position of the time-gate, whereas  is the number density of scattering molecules for the Raman, fluorescence, and the detector's dark count rate, respectively (cf. equation (1) and equation (2) [10, 19]). The relation of Raman versus fluorescence photons in terms of the SNR seems obvious. While Raman scattering has a very short lifetime, the fluorescence process involves real electronic excited states with finite measurable lifetimes; thus the Raman and fluorescence signal can be separated in the temporal domain [7]. This review highlights key findings and applications relating to past, present, and future developments of TGRS.
1.1. TG Raman spectrometer setup and measurement principle
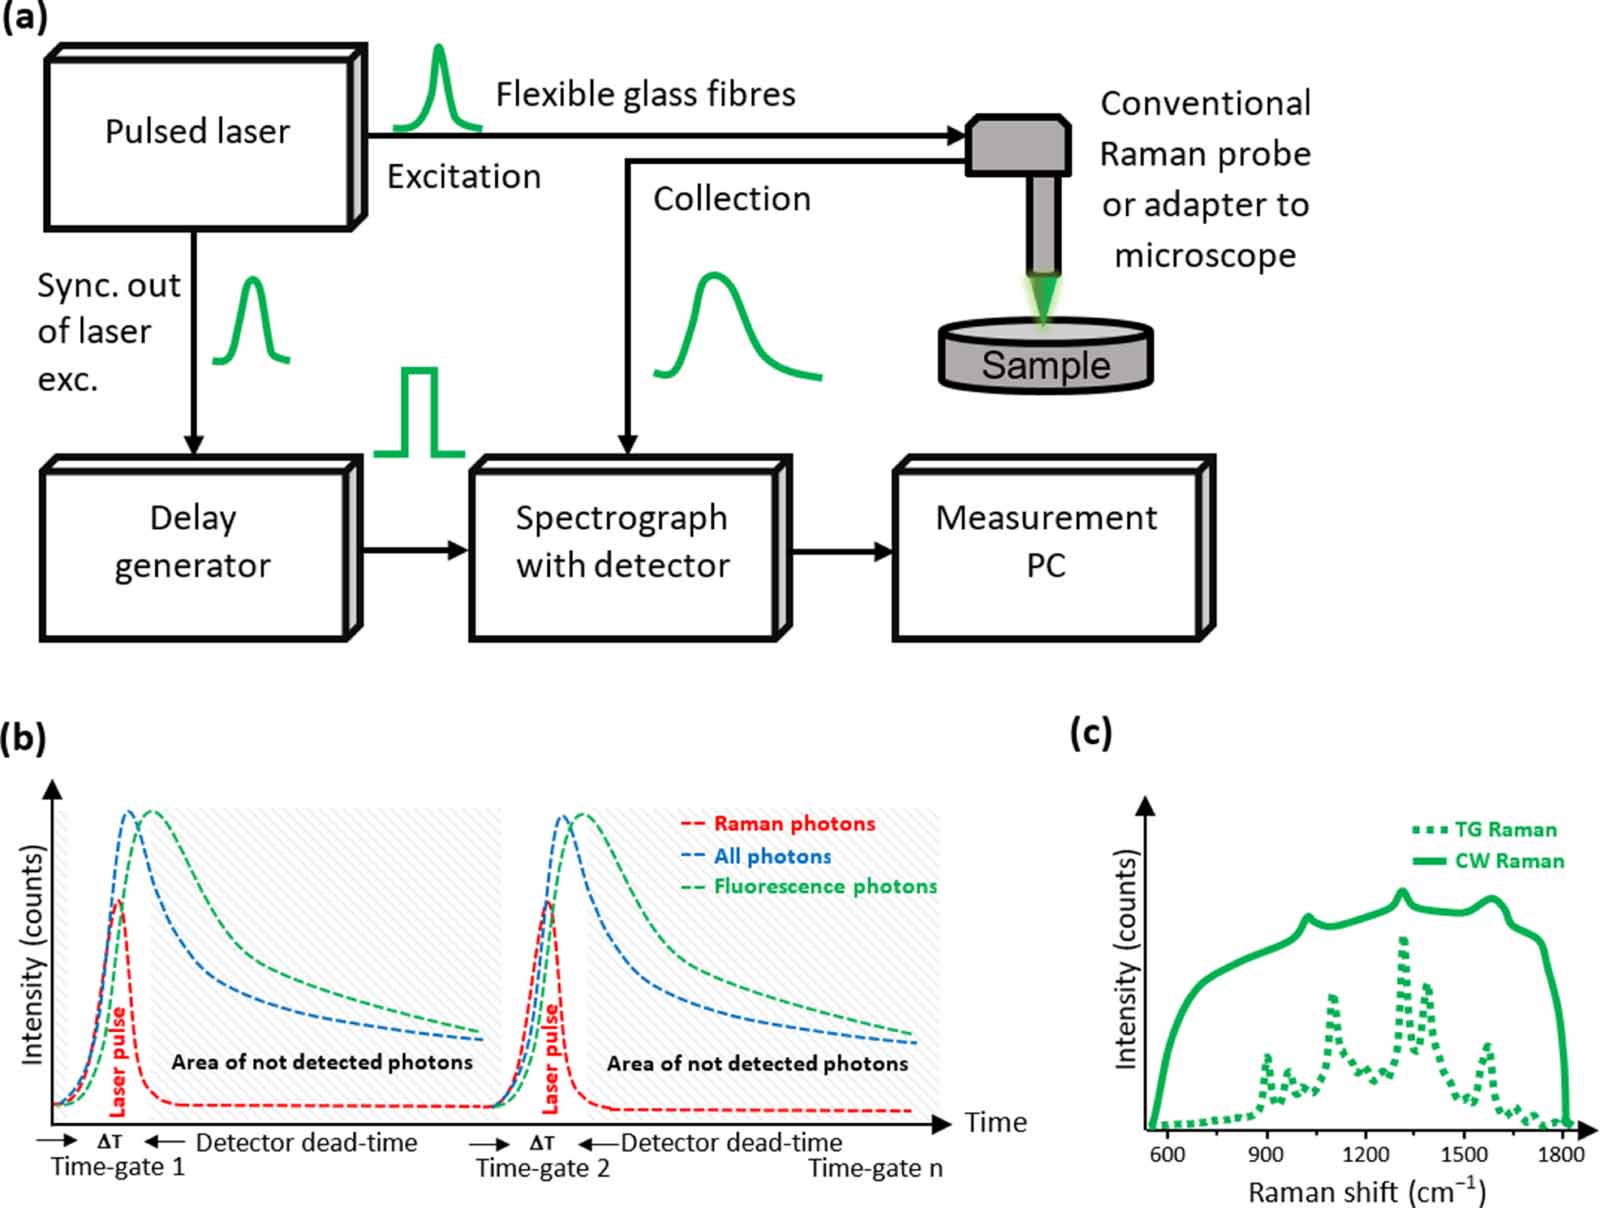
The components and typical setup of a TG Raman spectrometer are illustrated in figure 2(a). The essential component for performing TG Raman is a pulsed laser excitation source with a suitable repetition rate, pulse width and pulse energy. Most of the pulsed laser energy is focussed onto the sample spot for the purpose of excitation, but a fraction is used to enable TG through the delay generator, matching the sequence of detection, and used for temporal synchronization with the detector. The main components are as follows: a pulsed laser (commonly in picosecond time-frame) with a fast repetition rate (typically in MHz range), and a delay generator, synchronized to the detector-spectrograph unit via opto-electrical adjustable delay settings, and to a computer, which acts as a controller and measuring device. Figure 2(b) shows the temporal profile of TGRS, with its adjustable time-gate and concomitant rejection of fluorescence [10, 17, 20–22]. Based on the operational principle depicted in figure 2(a), the detector is activated only during the emission pulses, as shown in figure 2(b). The difference between TG (dashed line) and CW (continuous line) operation mode, with a fictive Raman spectrum for each mode, is illustrated in figure 2(c).

Figure 2. Time-gated Raman spectroscopy—(a) general block-diagram of a TG-spectrometer (b) Temporal profile with time-gating, detection of Raman photons (red-dotted line), rejection of most fluorescence photons (green-dotted line) with residual photons (blue-dotted line) and (c) TG Raman (green-dotted line) compared to conventional—continuous wave Raman (green) in spectral domain for the case of a strong fluorescent sample measurement, (b) and (c) are modified and reprinted with permission from refs. [10, 23].
Download figure:
Standard image High-resolution imageUntil recently, the complexity, size, and price of TG Raman spectrometers have precluded its widespread use. Different types of detectors have been employed in the past, such as multichannel plates (MCPs), photo-multiplier tubes (PMTs), and ultra-fast and intensified charge-coupled devices (ICCDs), with and w/o Kerr gates. Essentially, these devices require detector cooling, and are thus very complex and bulky, (see table 1) [24]. Since the turn of the millennium, complementary-metal-oxide-semiconductor (CMOS) single-photon avalanche diode (SPAD) array detectors have been commercially available [21, 24]. CMOS SPADs have the benefit of significantly reducing the disadvantages mentioned above. Moreover, there is often no need to cool the detector, which further reduces the complexity, cost, and overall size of the spectrometer. Current commercial TG Raman devices are portable tabletop sized units, suitable for process industry monitoring purposes [25]. We compare different detector technologies suitable for TG in section 3, (see table 1).
Table 1. Summary of prominent fluorescence suppression methods, modified and extended from references. [10, 17, 26].
| Method | Time-domain | Frequency-domain | Wavelength-domain | Computational |
|---|---|---|---|---|
| Cost | Medium to high | Medium to high | Medium | Low |
| Performance | High | Medium | Medium | Medium to high |
| Advantages | Separation of Raman signal from fluorescence and other background interference. Minimal risk of photon scattering effect in thick samples. Effective statistical noise reduction. Short duty cycle for excitation and detection system. A third dimension enables the representation of data in the temporal domain. | Combination of fast responding detectors, e.g. PMTs and spectrum analyzers is possible, which can distinguish high frequencies, primarily from Raman (coupled to excitation source), and lower frequencies, primarily from fluorescence signals. Fluorescence can be reduced by phase-nulling or demodulation. | Require only moderate modification of conventional Raman systems. | After subtracting the background (i.e. background correction), specific spectral features can be preserved. |
| Disadvantages | Ineffective separation between Raman and fluorescence when fluorescence lifetime is comparable to the excitation pulse duration (timing window). Spectral resolution is affected by the laser pulse width. The Kerrgate: requires very high pulse energies to operate. | High intensity Raman emission required to overcome fluorescence interference. Any noise on the fluorescence signal (e.g. shot noise) within the detector bandwidth will contribute to the phase-nulled Raman spectrum. | Complex data processing is required subsequentially after the performance of different Raman measurements, to obtain the normal Raman spectra. Strong dependence of spectral reproduction on the noise level of the raw spectra. | Optimal choices of key parameters are user-experience dependent. Time consuming data processing, which in some circumstances results in distorted spectral features that have little in common with the original spectral information. Dominance of artifacts, especially in weak Raman signals. Sharp Raman peaks can be left out due to random variations in pixel-to-pixel sensitivity. |
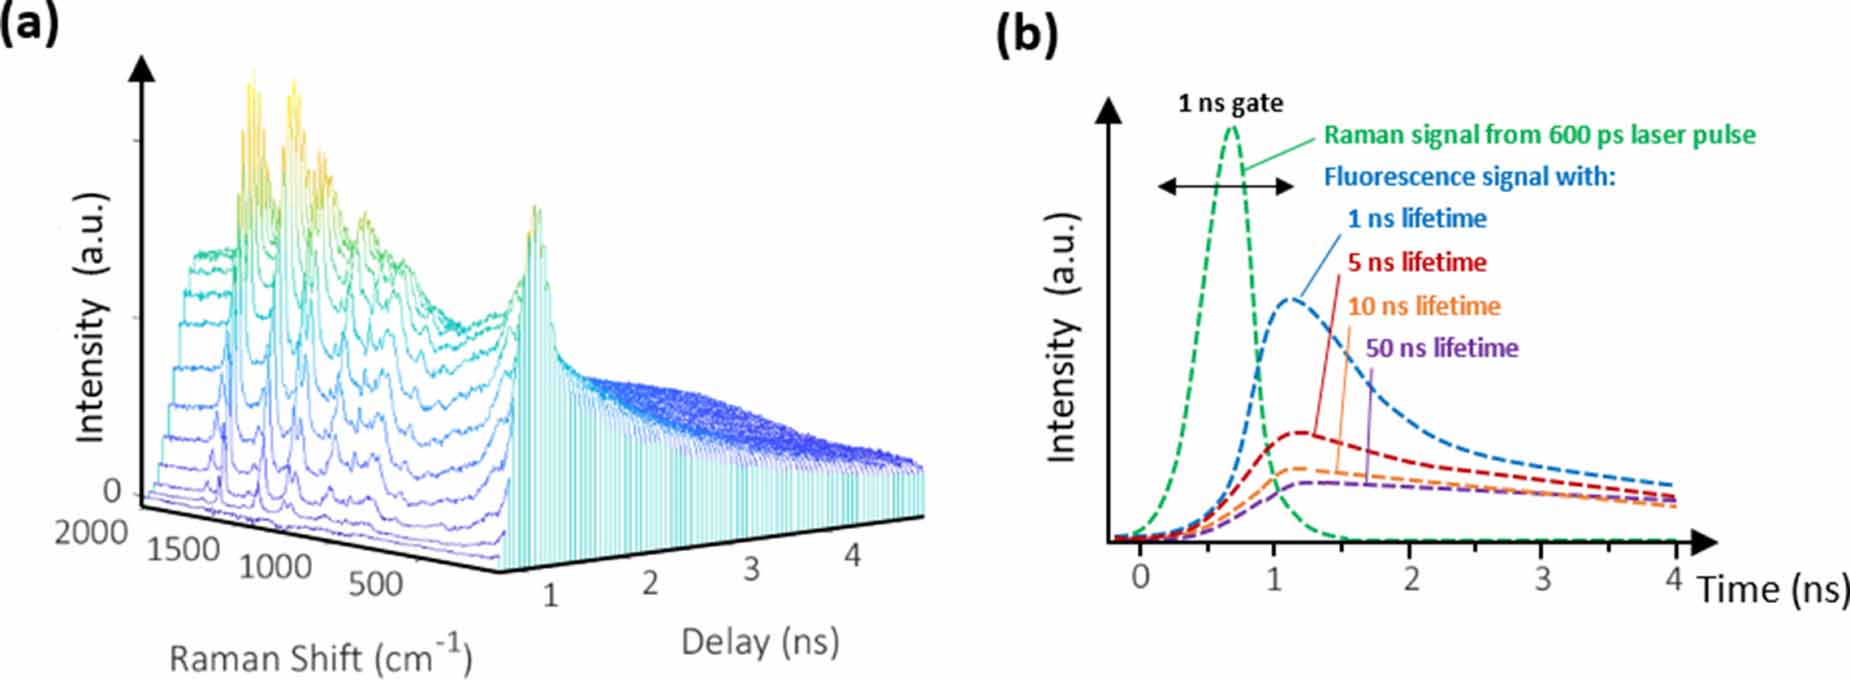
The terms time-resolved( TR) and TG are often used interchangeably. However, while TG mainly focusses on the suppression of fluorescence and other disturbances, thereby repeating a cycle of measurements across the width or part of the width of the pulsed excitation source, it can also be used to perform TR measurements in terms of studying transient processes. Due to its continuous temporal repetition, a third measurement dimension (time) is created, as shown in figure 3. The fixed temporal delay is very often used to study transient change and fluorescence decay processes. Both TG and TR have similar technical features which measure specified temporal regions, rejecting unwanted emissions, and thus enabling the separation of Raman and fluorescence [27]. Although in evaluating the literature for this review, it seems that the majority of articles describing the technical aspects of fluorescence signal suppression are actually referring to TG rather than TR, we feel that it would be inappropriate to view these terms as interchangeable.
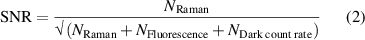
Figure 3. Sample TG Raman data: (a) Raman signal of sesame oil as a function of time (sampling shown as 3D-data-cube) with fluorescence interference, and (b) sample-specific fluorescence lifetime, reprinted with permission from reference [10].
Download figure:
Standard image High-resolution image1.2. TG Raman measurement result
A TG Raman measurement result is a three-dimensional plot of intensity versus frequency and time; - it is therefore possible to view Raman and fluorescence simultaneously [28]. The raw data temporally sampled after each laser pulse is subsequently accumulated, as illustrated in figure 3(a).
Sesame oil, shown in figure 3(a), exhibits a high fluorescence background and a lifetime of more than 4 ns. It can be used to demonstrate the effectiveness of TG Raman, as compared to conventional CW Raman [19]. Figure 3(b) shows several fluorescence characteristics and lifetimes for various samples [29]. It also demonstrates that setting a corresponding gate width is important, in that each sample has different sample-induced fluorescence emission characteristics.
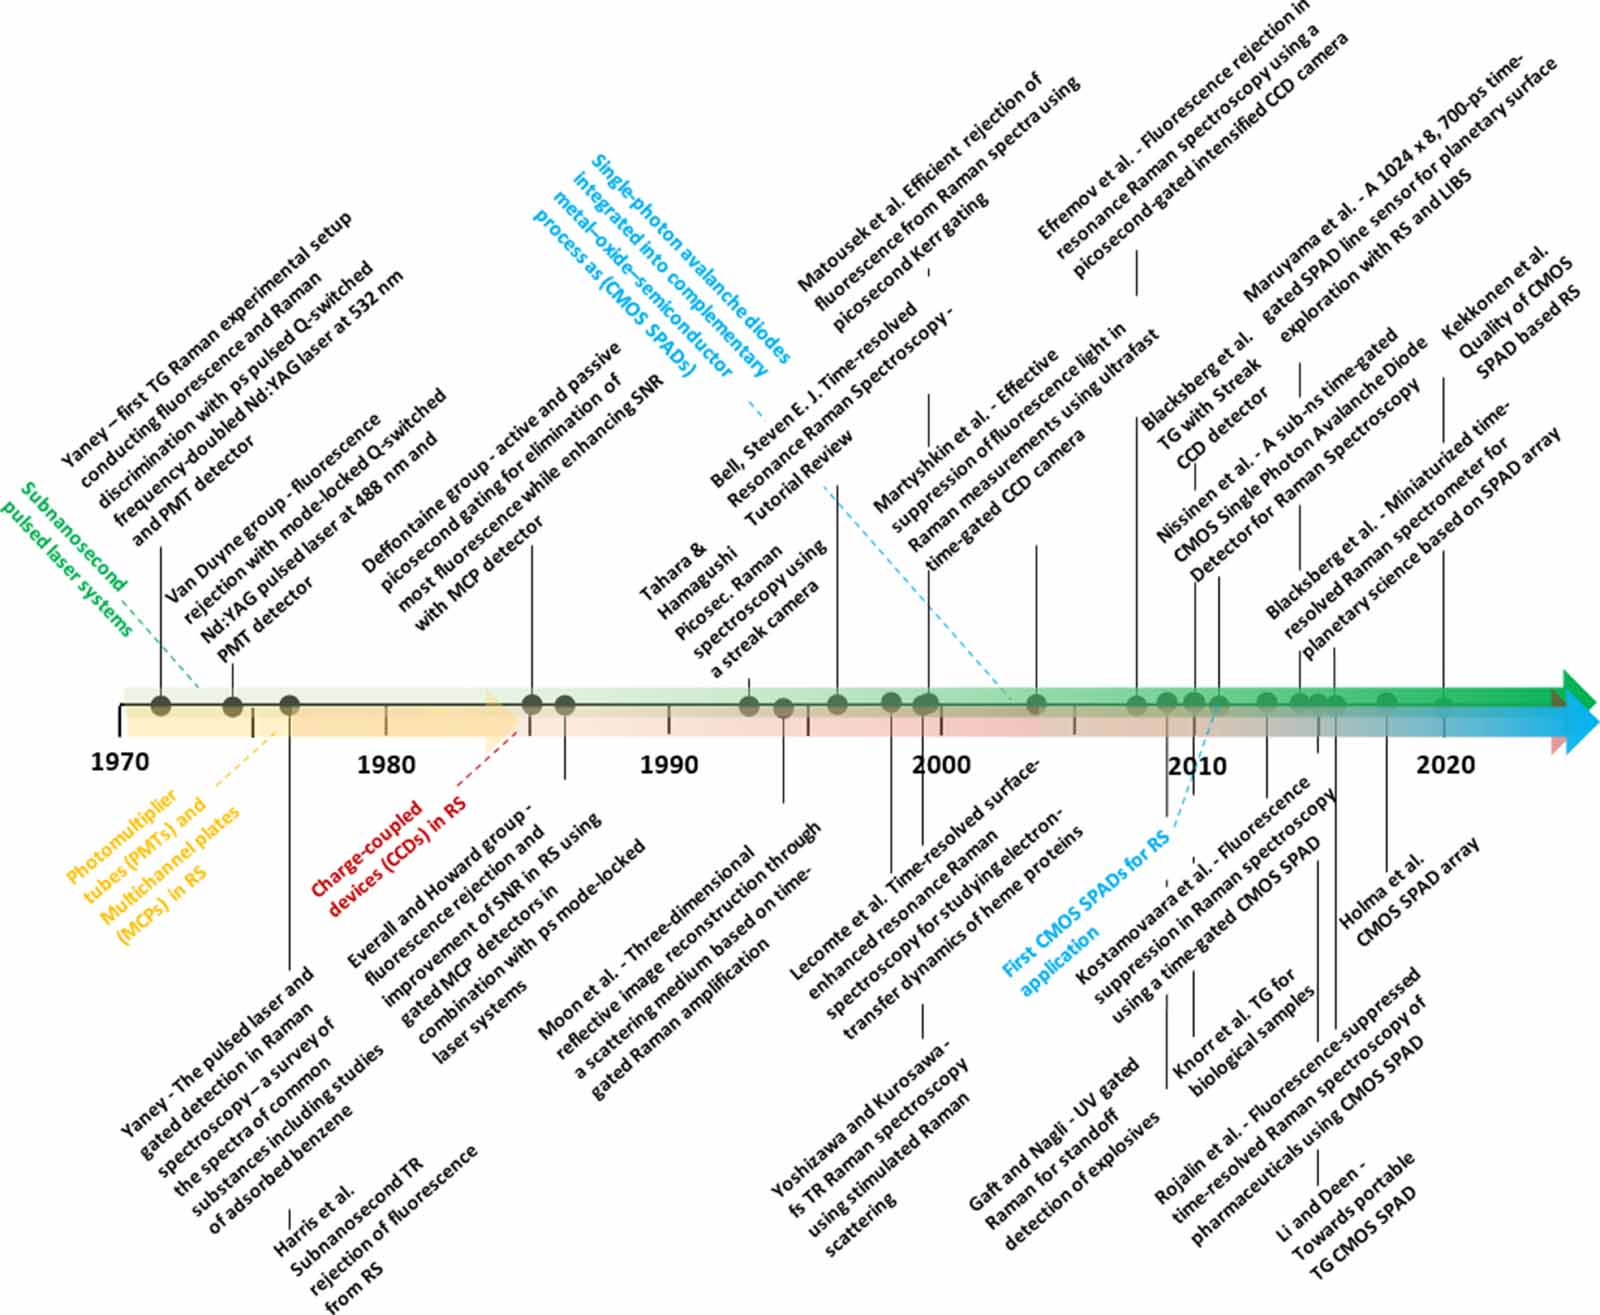
1.3. Brief historical overview of the development of TG Raman
TG Raman has its roots in the 1970s, with the advent of pulsed laser systems in the subnanosecond range, and the availability of computer controllable detectors. In 1972, Perry P. Yaney was the first to experimentally and theoretically prove the concept of fluorescence interference reduction by applying the TG principle [30]. Another pioneer was Richard Van Duyne, who is also one of the discoverers of the surface-enhanced Raman effect (see Chapter 5 of this review [3]). In 1974, the Van Duyne research group demonstrated experimentally for the first time that fluorescence rejection was possible, using a Rhodamine 6 G dye-doped benzene sample, while improving the SNR with the combination of a photomultiplier tube (PMT) and a pulsed argon ion laser source at 488 nm excitation [3]. In 1976, Yaney, using a similar setup to Van Duyne et al., but with a different pulsed excitation source (ps pulsed Nd:YAG, neodymium-doped yttrium aluminium garnet laser at 532 nm), found that TG Raman significantly improved the spectral results of three major Raman bands of acridine orange in benzene with a short laser pulse width (around 200 ns), as compared to CW Raman. He also stated that ambient light does not interfere with TG Raman spectral results, and that it improved the SNR of weak Raman signals in the presence of fluorescence. In addition, he noted that simultaneous fluorescence processes in a sample limited Raman detection, and that the TG principle enabled the use of short gating times, and higher dark current detectors are acceptable, e.g. uncoolled PMTs [18]. In the same year, Harries et al were the first team to compare the level of fluorescence background rejection in a TR experiment to that of continuous excitation on a fluorophore-doped benzene Raman band at 992 cm−1[ 31].
Laser systems and detectors at this time required large, complex devices, requiring very precise device calibrations [2]. By 1985, Deffontaine et al were testing active and passive methods for picosecond (ps) time gating, with the aim of improving SNR, in combination with synchronous streak camera detection and an optical Kerrgate; however, they noted the limited applicability of this approach [32]. In the same year, Watanabe et al demonstrated fluorescence rejection with ethanol doped Rhodamine 6 G in an ultra-short TG window of 31 ps, with a fast gating PMT-MCP arrangement and a 570 nm ps pulsed laser [33]. One year later, in 1986, both Everall et al and Howard et al demonstrated independently that with ps pulsed lasers systems, the bulk of fluorescence photons from a dye (rubrene) could be rejected from the pure Raman signal of benzene when the detection of the MCP was performed in TG mode [22, 34]. The ps pulsed laser excitation and MCP acquisition was limited with the 8-bit computers of the time, and therefore only one Raman band, i.e. benzene (992 cm−1), was observed, while rubrene was sequentially added. Prior to this, fluorescence-rejection had only been tested on non-fluorescent samples, such as benzene or hexane, which were doped with fluorescent dyes. Only the most prominent Raman bands of these samples could be investigated, rather than the whole spectrum. Various applications for TG Raman emerged in the following years. For example Petrich et al examined the resonance TR Raman of haemoglobins with an Nd:YAG ps pulsed laser in 1987 [35]. In 1993, Tahara and Hamaguchi demonstrated fluorescence background suppression during TR Raman measurements of benzophenone, using an ICCD-based streak camera and a 532 nm Nd:YAG laser in a time-resolution of 10 ps [36]. Moon et al used a ps TG Raman spectrometer with pulsed 532-nm excitation in 1994 to reconstruct a 3D image through a turbid medium (water) by amplification, imaging it to a CCD detector [37]. The optical Kerr effect in combination with TG Raman was first described by Deffontaine et al in 1985. In their work, the alteration of the refractive index of a Kerr medium (1 mm thick CS2 cell) in response to a ps laser between crossed polarizers, was applied to perform like a light shutter for TG Raman detection, rather than gating the detector itself [32]. Later in 1999, using a similar ps Kerr gating approach, fluorescence rejection with a more advanced liquid nitrogen-cooled CCD array detector of stepwise 4‐(dicyanomethylene)‐2‐methyl‐6‐(p‐dimethylaminostyryl)‐4H‐pyran (DCM)- doped acetonitrile was successfully demonstrated by Matousek et al, and independently, with a different setup in the ultra-short (fs) range, by Yoshizawa and Kurosawa [38, 39]. With their method, the Matousek group realised fluorescence rejection at variable gating times up to a remarkable minimum of one ps, while Yoshizawa and Kurosawa were actually able to achieve results in the subpicosecond range. However, the Matousek group's setup initially comprised a whole laboratory room, even though they significantly improved the performance of this system in 2001 by using a high-performance ps Kerr gate [38–40]. From the mid-nineties until past the turn of the millennium, various patents have been filed by multiple parties. This includes the US Secretary of Navy's patent relating to TG Raman amplification, involving the use of TG and surface-enhanced Raman spectroscopy (SERS) and TG imaging, as performed by the Massachusetts Institute of Technology (MIT) [41, 42].
Several research groups have studied TG-SERS, including Lecomte et al, who focussed on TR surface-enhanced resonance Raman spectroscopy to study the electron-transfer dynamics of heme proteins in 1998 [43]. In addition, a good overview of TR resonance RS is provided by Steven Bell [44].
In 2004, Martyshkin et al achieved fluorescence rejection in highly fluorescent solid samples (crystalline CaWO4 with Nd3+ and hexobenzocoronane), with a temporal resolution of approximately 150 ps, using a 2 ps fast pulsed 785 nm Ti: sapphire laser excitation source in combination with an intensified gated/modulated CCD. A similar approach, but with resonance Raman was taken by Efremov et al in 2007 to quench the fluorescence from a flavoprotein sample in the UV-region, using cooled ICCD combined with a blue ps excitation source. Figure 4 provides a short summary in the form of a timeline, featuring selected articles described above, together with the technological drivers for TG Raman, such as subnanosecond pulsed laser systems as key component for TG Raman, as well as different kind of detector variants applicable to the collection of Raman photons in gated mode.

Figure 4. Timeline of the development of time-gated Raman spectroscopy, with technological drivers (with ps-pulsed laser shown in green, PMTs and MCPs in yellow, CCDs incl. Kerr-gating in red, and CMOS SPADs in blue), and relevant selected articles.
Download figure:
Standard image High-resolution imageAs shown in figure 4, a major boost to the development of TG Raman came with the advent of CMOS SPADs after turn of the millennium. Later, in 2011, CMOS SPAD technology was applied for the first time as a detector technology in Raman applications [20, 45].
2. Fluorescence suppression methods and classification of TG
Several methods have been developed to perform fluorescence rejection. A comprehensive overview is provided by Wei and co-authors [17]. They classify fluorescence interference reduction methods into five different categories: (1) time-domain, (2) frequency-domain, sometimes referred to as 'phase-modulation' under high-frequency modulation, (3) wavelength-domain, (4) computational methods for background removal and post-processing of measured spectra, and (5) other methods. TG is classified as a time-domain method. The first two methods have the major advantage of taking the different temporal behaviour of Raman scattering and fluorescence response into account. The third method utilizes the fact that fluorescence has broader spectral characteristics even at different wavelengths, whereas the Raman emission spectrum is coupled to the wavelength of the excitation [46, 47]. Notable techniques for this method include shifted excitation Raman difference spectroscopy (SERDS), and subtracted shifted Raman spectroscopy, both of which require an additional step, subsequent to spectral acquisition [17]. Only minimal modification is required to convert a conventional CW Raman system into a SERDS setup with CCD based spectrometers, i.e. incorporating two slightly wavelength shifted laser excitation sources, typically set apart at full width at half maximum (FWHM) [48].
Computational methods have a limited capacity to improve the SNR once fluorescence has broadened or distorted Raman peaks. Another drawback is that they can omit sharp Raman peaks, due to random variations in pixel-to-pixel sensitivity that are greater than the actual Raman signal. A significant advantage is that they can be used for baseline-correction, due to the difference between the very narrow Raman peaks as compared to the broad fluorescence [49]. This approach might fail where samples show wider Raman peaks of several tens of wavenumbers. In addition, in some cases, automated computational baseline-correction with single parameters may not be a good fit for all application and sample types, as (i) the risk of data loss and spectral distortion and (ii) manual parameter modification may be required [10, 50]. Other methods for effective fluorescence suppression include sample photobleaching prior to measurement [51], and SERS. A significant enhancement of the Raman scattering can be accomplished using SERS, which increases the Raman scattering when specimens are close (i.e. a distance of nanometres) to metallic surfaces or nanoparticles of matching size and excitation wavelength, creating a plasmonic local electromagnetic enhancement effect to boost the Raman signal, thereby minimising the influence of fluorescence [5]. SERS combines the specificity of Raman with a high sensitivity which enables the analysis of samples at very low analyte concentration, and can also be combined with TG [52]. A more detailed discussion regarding TG-SERS is included in Section 5.
Table 1. Shows a survey of the most notable methods of fluorescence suppression.
Other non-linear techniques, such as coherent anti-Stokes Raman scattering spectroscopy (CARS), can also be classified as fluorescence suppression methods, having the capacity for spatial discrimination of the Raman signal from background interference. CARS has been used for TR measurements in the ps scale, with the aim of rejecting the background from Raman measurements. However, for practical reasons, it is often not applicable to all sample states [22, 53]. Furthermore, the same surface-enhancement methods of boosting Raman signals and supressing fluorescence can be used for both anti-Stokes Raman and for Stokes (more common) Raman, with the specific advantage in the UV spectral range that vibrations from resonant groups can be selectively picked out [54–56].
3. Gated detector technologies
3.1. PMTs and MCPs
In the 1940s, PMTs were used for the first time as photosensitive low light detectors for Raman experiments [57, 58]. Gating could only been performed by external trigger pulsing, for which in the 1960s PMTs were used to gate stimulated light scattering discrimination, paving the way for future TG Raman detectors [59, 60]. Later MCPs facilitated TG measurements up to the femtosecond range [61, 62]. In this kind of detection arrangement, an image intensifier is placed ahead of photodiode arrays using a microchannel plate. Linearity problems with image intensifiers limited their applicability in combination with the TG measurement setup. A further enhancement in terms of sensitivity can be achieved with intensified photodiode arrays [63]. MCPs are, in principle, electron multipliers in a vacuum-tube assembly, which multiply incident charges to a secondary emission [64]. Since there are many channels permitting spatial resolution, MCPs can be used to resolve a temporal delay [62]. They are also capable of fast switching in the MHz region, making them suitable for TG-related Raman measurements [34]. More commonly, microchannel-plate photomultipliers (MCP-PMTs) are used, as they combine the advantages of both detector elements. PMTs are special vacuum glass-sealed electron tubes, designed to enhance weak light signals (up to single photons) by generating electrical signals from a photocathode [57, 65].
One drawback of MCP-PMTs is a serious 'aging'- issue, caused by the ions of residual gases striking and destroying the photo cathode. This results in a rapid deterioration in the quantum efficiency of the detectors, as well as irritating secondary bumps and irregular tails at the FWHM of the instrument response function [66]. This can be addressed by atomic layer deposition and coating with a thin alumina or magnesia layer so as to reduce out-gassing from the MCP substrates [65]. Even though MCP-MPTs seem to be outmoded as Raman detectors, their sensitivity is satisfactory, with suitable temporal resolution, and their development has continued in relation to other applications, as shown in table 2. For example, recent advances have shown that MCP-MPTs make suitable detectors for fluorescence lifetime imaging [67].
Table 2. Comparison of TG Raman-cmpatible detector technologies, compiled from references [24, 68–70].
| Detector type | Multichannel plates (MCPs) | Photo-multiplier tubes (PMTs) | MCP-MPTs | Intensified gated charge-coupled devices (ICCDs) | Complementary metal oxide semiconductor single-photon avalanche diodes (CMOS SPADs) |
|---|---|---|---|---|---|
| Instrument complexity | High | High | Medium | Medium to high | Low |
| Size | Large | Large | Large to medium | Medium | Medium/compact/portable |
| Sensitivity | Good | Good | Good | Good | Very good |
| Time-gate range depending on excitation source | Femtoseconds | Nanoseconds | Picoseconds, up to Femtoseconds, depending on setup | Picoseconds | Picoseconds |
| Necessity for cooling | – | Beneficial | Beneficial | Required | Not required |
| Cost | – | – | - | High | Medium |
| Remarks | Laboratory setup for TG Raman | Laboratory setup for TG Raman; can be used with optical Kerr gates | Laboratory scale; can be used with optical Kerr gates | Typically, larger setup required. Can be used with optical Kerr gates. Streak camera and EMCCD options available. Commercial availability | Original application as single-photon counting devices. Commercial availability, e.g. as portable process Raman spectrometer instruments |
3.2. CCDs and ICCDs
In general, CCDs are the most commonly used detector variant for RS, but for the TG setting they need to be highly sensitive (single photon counting ability), allow for a fast external trigger, and possess a temporal resolution in the subnanosecond range. ICCDs fulfil these requirements. Optical Kerr-gating, which acts like a light shutter in front of the entrance slit of the spectrometer, has been used by several groups to trigger the CCD. This setup requires space, thus limiting the portability of the system. Guidelines for the selection of Raman multichannel and gated detection have been formulated by Talmi [71]. In 1993, Tahara and Hamaguchi were the first to achieve high sensitivity and good timing resolution by constructing an intensified CCD-based streak camera. The streak camera in a TG Raman setup guides the backscattered light from the sample onto a photocathode; this accelerates electrons when hit by photons, by means of high speed voltage ramps (for positive and negative DC bias) on an anode in a cathode tube (known as a streak tube). The movement of the electron beam (streak) is swapped from the negative anode side to the positive, before being passed through a phosphor screen via an intensifier onto the CCD detector. This mode of sweeping enables a detection result for a three-dimensional plot (intensity vs. frequency and time) [72].
An extended option for performing streak-based TG measurements with increased detection sensitivity is the use of electron-multiplying charge-coupled devices (EMCCD), which is an additional feature of some CCD detectors [73–75].
ICCDs often require Peltier cooling (from −20 °C to below −100 °C), which is not generally water-cooling or liquid nitrogen cooling. These components affect the electronics, overall size, cost, and complexity of ICCDs, which are still relatively sizeable at present.
3.3. SPADs
The CMOS industrial technology standard enabled the design of high-speed electronics in combination with SPADs at low cost and in smaller sizes, without the need for detector cooling. This made it possible to arrange simplified photo-detection and fast (subnanosecond) readout circuitry on a tiny solid state chip [19].
The very first SPAD array detector was developed by Rochas et al in 2003 [76]. SPAD detectors are very sensitive, produce no significant readout noise at high speeds, allow for precise timing, and do not require additional preamplifiers for this level of sensitivity, in contrast to CCDs [68]. Even a single photon entering the depletion region on the detector can trigger an avalanche breakdown that can directly produce high-speed logic-level pulses (bias) for the read-out measurement electronics [9]. Generally speaking, a SPAD is an avalanche photodiode, in which the p-n junction is reverse biased above its breakdown voltage, operating in the so-called 'Geiger Mode'. When a photon hits the active area, it creates an electron-hole pair, triggering an avalanche [9, 20, 68].
3.4. Advantages and disadvantages of SPADs for TG Raman vs other detector techniques
The advantages of SPAD detectors over MCPs, PMTs and CCDs for TG Raman can be summarized as follows: (1) greater suitablility for TG, due to their temporal behaviour, (2) advanced sensitivity, since SPADs operate close to the 'break-down' voltage in Geiger mode, thereby enabling single photon detection and the exposure of fast transitions at very low intensities, (3) less complexity, resulting in lower manufacturing costs, (4) the capacity for improved system integration, resulting in reduced space requirements, (5) less power consumption/improved power dissipation and (6) no cooling requirements, due to the detectors' short duty-cycle and low dark current [10, 17, 77, 78]. One current disadvantage of SPAD detectors in relation to TG Raman applications is the challenge of matching a comparable number of pixels in the detector array, as compared to CCDs. This can have an effect on the spectral resolution, although there are ways to improve this, e.g. the implementation of microlens arrays and sub-pixel acquisition [68, 79, 80]. Current commercial TG Raman spectrometers provide a spectral resolution of about 5 (cm−1) wavenumbers, while some CCD- based systems can achieve below 1 (cm−1) [25, 81]. However, the majority of applications do not require sub-wavenumber resolutions.
3.5. Overview of SPAD-detector development for TG Raman
The first applications using SPAD technology for TG RS were demonstrated by Blacksberg et al, and by Nissinen et al, in 2011 [20, 45]. The Nissinen group used the rising edge of a 300 ps pulsed Nd:YAG micro-chip laser, at a 532 nm excitation wavelength, to trigger a delay generator and timing circuits to enable the SPAD, detecting the collected Raman photons on one SPAD element. Later in 2013, Kostamovaara et al, using a similar setup, demonstrated that gating times of around 100 ps are sufficient for most sample-induced fluorescence suppression schemes [9]. The early setups used a single pixel SPAD element and a translational stage that moved the SPAD detector over the spectrograph's output slit in order to resolve a full Raman spectrum. There are multiple variants of two-dimensional SPAD array detectors suitable for TG Raman applications, as initially demonstrated in 2013 by Nissinen et al[ 82]. A detailed overview of CMOS SPADs for biophotonics applications is provided by Bruschini et al 2019 [68]. Details of recent technical advances in CMOS SPAD detectors for TG RS were provided by Nissinen et al's 2017 paper [19]. They demonstrate a compact (9 mm × 3 mm) 16 × 256 CMOS SPAD line sensor with low power consumption, and a 256-channel time-to-digital converter (TDC) on the chip. The 3-bit TDC is placed near the SPAD array, facilitating an adjustable timing resolution from 52–104 ps. This is manufactured via a 0.35 µm high-voltage CMOS process, similar to Maruyama et al's 2014 8 × 1024 SPAD-array, with less active pixels, but a greatly improved FWHM, an increased fill factor, and a smaller time-gate width [69, 83]. Detailed comparisons of CMOS SPADs for single-photon detection, and for Raman applications in particular, can be found elsewhere [69, 80, 84].
4. Application areas and future directions
As mentioned above, pulsed laser techniques enable TG and TR measurements. However, application areas for these techniques might differ, depending on whether the aim relates purely to background (e.g. fluorescence) suppression or to transient measurements, i.e. studying the temporal emission distribution. Based on our findings in the literature, TG has successfully been used in several application areas. These findings enable us to estimate some of the most suitable application areas for TG Raman, as shown in figure 5. RS is an important online-monitoring tool with the capability for quantitative and qualitative analysis in process industrial sensing applications; currently its main fields of application in relation to TG Raman are the steel industry or industrial catalysis [85, 86]. These fields benefit in particular from the capacity of RS to perform a real-time and in situ non-invasive and non-destructive analysis at different locations in a process, with zero or minimal sample preparation (e.g. flow-cell or reaction chamber), together with its capacity to identify relevant structural information and polymorphism with high levels of spectral and spatial composition for compounds at different process phases [86–92]. All this is possible with fluorescent-free and undisturbed Raman detection [93]. Notable in terms of process analytical applications is the fact that gated Raman measurements can also be conducted in transmission mode, i.e. through turbid media (using flow-cells or pipes), with improved SNR by means of spatially offset Raman spectroscopy [94, 95]. TG Raman industrial applications include the following published examples: Heilala et al investigated traces of acids in pickle liquor in metalworking industry. Gyakwaa et al successfully characterized Calcium-Aluminate in steel production, as steel and most other alloys produce minimal Raman intensities and thus unwanted inclusions and other components can be detected [85, 86]. Gal-Or et al demonstrated the feasibility of using TG Raman in 3D printing manufacturing of glass microfluidics [96], and Dou et al confirmed, using TG Raman and NMR spectroscopy, that highly fluorescent willow bark is a rich source and a potential feedstock for biorefinery processes in fibre production [97]. Catalytic process applications usingwhere TG/TR Raman performs an online-monitoring function in relation to transition metal oxides [92] and the optimization of SiO2—TiO2 concentration ratios at specific temperatures has also been studied. Enzyme biocatalytic reaction processes have also shown promising results using this type of monitoring technology [98]. Furthermore, qualitative and quantitative Raman process measurements are mostly unaffected by vibrations and high pressure caused by high flow-rates or generated through pumps in the pathway, so long as the detection takes place on a fixed sample substrate, e.g. membranes in water filtration processes [99]. The effect of changes in pH and temperature (e.g. hot temperature and catalysis processes) on Raman and IR spectra manifest as small band drifts, but they are not negatively influenced by e.g. very large drifts or intensity changes in bands, which is a great advantage when following process-related changes, and is even more suitable for pulsed laser and TG or TR measurements in general [100–103]. Sharma et al have demonstrated excellent results for fluorescence suppression using pulsed laser TR Raman applied in NASA's Venus Chamber, at temperatures of up to 1373 K and at high pressures [102]. Promising results aimed at planetary sciences, but also at more general mineralogical sciences, have been realized using TG/TR Raman to investigate specimens of minerals with very strong fluorescence interference [46, 104]. These results include the investigation of rock samples containing rare earth elements [93, 105, 106].
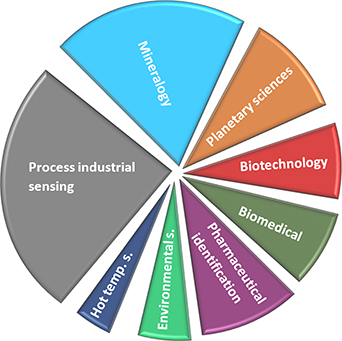
Figure 5. Applications of time-gated Raman found in literature (related to the evaluated articles) ranging from process industrial sensing to hot temperature and environmental sensing.
Download figure:
Standard image High-resolution imageA recent focus of TG Raman in the biomedical arena has been the chemical imaging of human teeth, as described by Kekkonen et al[ 107], and Usai et al[ 108], who compared the results of samples from pure distilled-water fluorescein, paracetamol, and sesame oil, known to have high fluorescence backgrounds, with TG (uncooled 1024 × 8 SPAD line detector). Compared with the results obtained using conventional CW Raman (cooled CCD), at 532 nm excitation, they were able to demonstrate remarkable fluorescence suppression results using TG. Knorr et al developed a CCD-based TG Raman system to study biofuels [109]. They noticed that high laser peak power at low repetition rates caused sample surface damage, but that sufficient spectra can be measured below a certain laser power threshold. Morris and co-authors used ps TG Raman for the transcutaneous evaluation of bone compositions, using the Kerr gate to study bone compositions from below the surface (phosphates around 945–957 cm−1, carbonates 1073 cm−1, amide II region at 1250 cm−1, CH2 at 1445 cm−1, and amide I envelope at 1685 cm−1). Transcutaneous Raman bands are observable from 0–10 ps delay, without fluorescence interference and sufficient SNR, but increased fluorescence and decreased SNR. Further studies on living animals or human subjects are proposed, where scanning and real-time detection of a larger tissue surface area may be possible [110]. Rojalin et al demonstrated fluorescence suppression with a CMOS SPAD TG Raman prototype, based on pharmaceutical samples that produced a high degree of fluorescence interference, such as caffeine, ranitidine, and indomethacin powders [21]. A residual fluorescence background (REL) subtraction was implemented, together with a decay estimation function, which is currently used in some commercial TG Raman spectrometers [25]. Conventional 785 nm CW Raman and 532 nm TG Raman measurements for these samples were compared, revealing that TG could significantly dampen the fluorescence background. Lipiäinen et al applied multivariate chemometric data analysis to solid fluorescent pharmaceutical drug mixtures, using a commercially ready CMOS SPAD prototype system. A precise estimation of the compound quantification of the mixtures was achieved, with partial least-square (PLS) and kernel-based regularized least-squares regression (RLS), employed where a large amount of spectral data is considered for Raman signal intensity due to overlapping peaks. Chemometric analysis using PLS and RLS was conducted on data acquired using a CMOS SPAD prototype TG Raman, and the individual temporal intensity decays of each mixture's fluorescence was also included in the study.
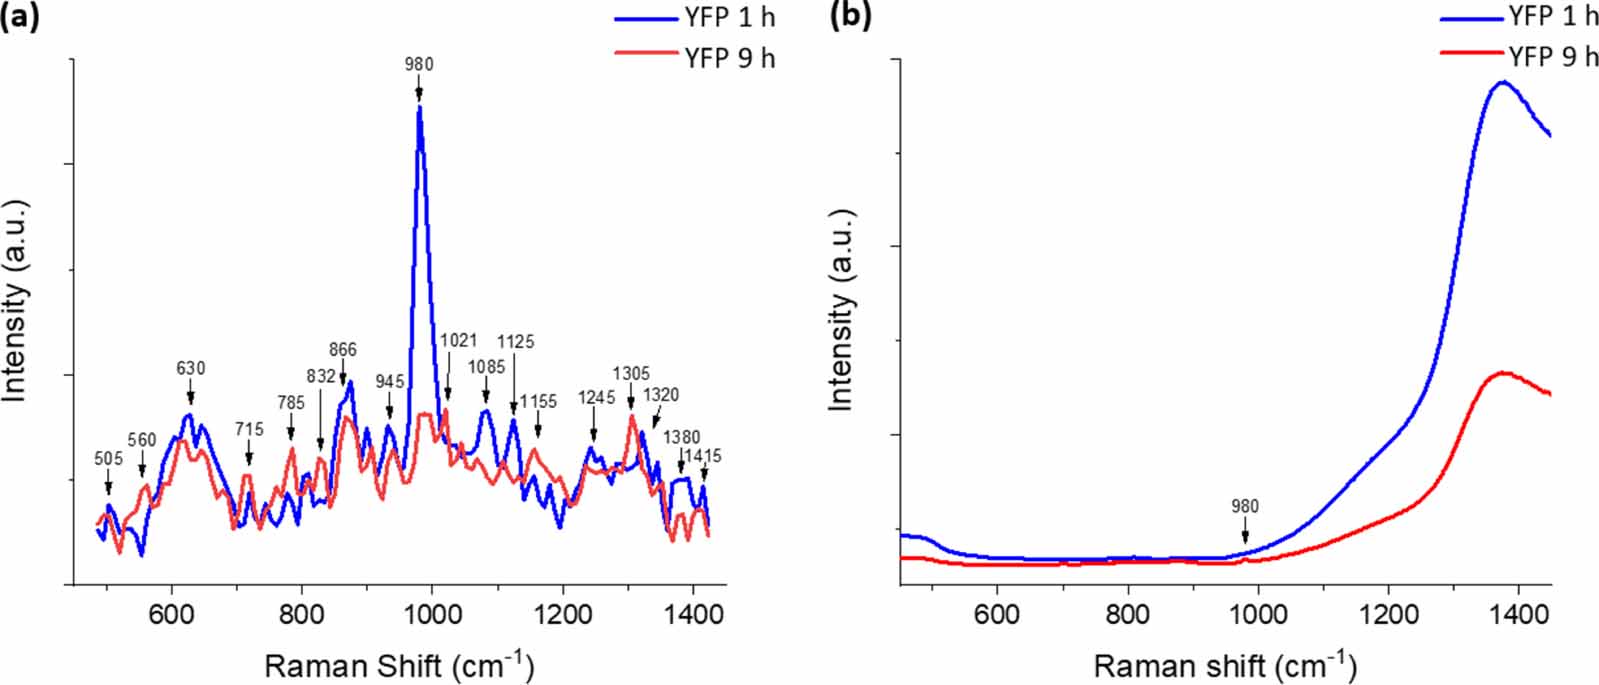
In the field of of biotechnology, Kögler et al showed in 2018 that TG Raman, accomplished using a commercially ready CMOS SPAD prototype system with and w/o nanoparticle enhancement, could identify significantly more Raman and SERS bands than the common CW process Raman spectrometers and confocal Raman microscopes in relation to Escherichia coli( E. coli) cultivation samples over a 24 h process time [111]. In addition to the qualification of relevant compounds such as glucose and acetate, data detailing changes in nucleotides (DNA) taken from TG Raman and CW Raman were chemometrically quantified and compared with high-performance liquid chromatography. Kögler et al concluded that even with a spectral resolution of 10 cm−1, the SPAD-based TG Raman is more suitable for qualification and quantification than CW Raman, due to its fluorescence suppression capability, and its combined plasmonic enhancement with SERS. Further experiments, without the use of plasmonic enhancement, on yellow fluorescent protein (YFP), cultivated over an extended process time, and using the same mineral salt medium as for the E. coli studies, are illustrated in figure 6. Data obtained from TG Raman were taken at the beginning of the cultivation period (after approximately1 h (blue curve)) and at its end (after about 9 h (red curve)), as shown in figure 6(a). These were then compared with data obtained via CW Raman (figure 6(b)). The results clearly indicate that TG Raman identifies significantly more known Raman bands for this process than CW Raman, and that fluorescence causes distortion in the Raman signature (only one visible Raman peak at around 980 cm−1 with λexc = 785 nm CW Raman) with a broad interference from 1000 cm−1 onwards [10].
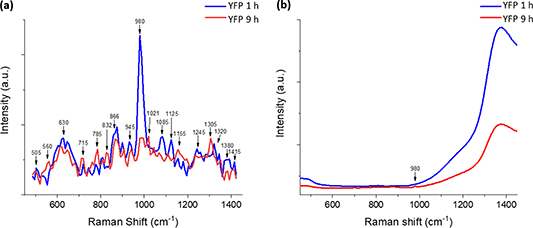
Figure 6. Bioprocess application—comparison of (a) TGRaman (at λexc = 532 nm) and (b) CWRaman (at λexc = 785 nm) for yellow fluorescent protein (YFP) in a turbid growth medium with strong fluorescence interference during cultivation at 1 h cultivation time (blue curve) and towards the end at 9 h cultivation time (red curve), modified and reprinted with permission from reference [10].
Download figure:
Standard image High-resolution imageFor process analytical applications, and for most application areas mentioned in figure 5, a TG Raman spectrometer needs to be a high-performance device; it should be portable and compatible with different kind of probe options for specific applications. The device size and portability are also important factors in many applications, although they might be less crucial when monitoring mature processes. Modifications to reduce costs and size to meet specific application needs is possible with TG Raman. As an example, by 2014, Li and Deen had already developed a portable TG Raman system, based on CMOS SPAD technology, intended to be used in field and environmental applications, particularly for water quality monitoring in remote areas [73, 84]. They stated that the largest component in the system is the spectrograph, which can be downsized (approx. 2.5 × 4 cm in their system) by employing a concave grating design [84]. However, future directions for RS applications aim to achieve miniaturization down to the size of handheld devices, or even smartphone-based systems [112, 113]. These portable systems may be very suitable for environmental sensing, mineral & rock identification, counterfeit detection, and bio-sample detection in the field. We believe that an even greater degree of miniaturization in TG Raman systems is possible. One example of a portable TG Raman system is the SuperCam Instrument, carried on NASA's Mars 2020 rover, which includes a TR pulsed laser Raman spectrometer [114].
5. Extensions and further developments of TG Raman
Some techniques can be seen as extensions of TG Raman, because the TG mode enhances the capabilities of these techniques far beyond what they are capable of without TG. SERS and standoff Raman detection may be viewed as such extensions to TG, with great potential for further development in the future.
5.1. TG-SERS
SERS requires suitable metallic nanostructures or planar electrode surfaces (typically silver or gold) in order to achieve plasmonic signal enhancement in Raman technology. Noble metallic nanoparticles of specific size and shape or specially patterned nanostructures are suitable; sometimes combination of both seems applicable [115, 116]. SERS has the advantage of strongly enhancing the Raman signal and, like Raman, is insensitive to the molecular vibrations of water [117, 118]. Fluorescence can be partially quenched via plasmonic enhancement, but this is dependent on the quantum yield of the molecules under inspection [5, 10]. Even low-end specification Raman spectrometers can be employed with very reasonable results; thus, SERS does not require a high-end process or confocal Raman spectrometer systems [119]. Surface enhancement is based on the resonance excitations of surface plasmons in the metal, and enhancement factors of about 104–106, in extreme cases even about 1011, can be achieved [5]. SERS is currently by far the most predominant subject in the field of RS research, but due to the lack of long-term repeatability in terms of spectral results, and variable performance, it has yet to make a meaningful breakthrough in the industry [10]. More in depth information about SERS can be found elsewhere [120–122].
While TG helps to overcome the issue of fluorescence and other background interference, it cannot improve the generally weak Raman scattering phenomenon in relation to the strong fluorescence signal, as discussed in the introduction. Improving the limit of detection is highly desirable, particularly for low analyte concentrations. Another related aspect is the aforementioned ability of SERS to quench fluorescence to some extent. Conceivably, therefore, a TG-SERS combination may help to overcome even a very strong influence of fluorescence, as Kögler et al have demonstrated [111, 116].
Most recently, Kögler et al assessed the capacity of TG-SERS to reduce high fluorescence signals from complex cultivation media of E. coli cells in a bioprocess. They also compared the results obtained from TG-SERS with the non-enhanced evaluation of TG and CW Raman spectra [23].
Figure 7 illustrates the difference between TG-SERS (green spectra) and common CW-SERS (red spectra) results, both at λexc = 532 nm, in comparison with the same sample from a bioprocess. Figure 7(a) shows the results for an E. coli sample at the beginning of its cultivation period, and figure 7(b) gives results for an enhanced green fluorescent protein (eGFP) with an even stronger background fluorescence.
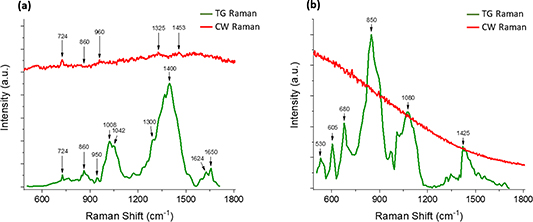
Figure 7. TG-SERS (picosecond pulsed excitation) versus CW-SERS (continuous excitation) at λexc = 532 nm—(a) E. coli cells in complex media expressing hCNTF (1 h after induction) and (b) eGFP in buffer—TG-SERS (green curve) and conventional CW-SERS (red curve)—reprinted with permission from reference [23].
Download figure:
Standard image High-resolution imageThe spectral results shown in figure 7 are from highly fluorescent samples, but at relatively low concentration levels; thus, a simultaneous Raman enhancement and fluorescence suppression with TG-SERS is beneficial for these applications.
5.2. TG standoff Raman detection
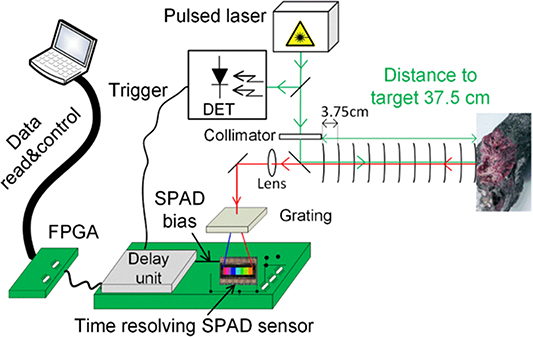
Remote Raman analysis of dangerous (e.g. explosives or biohazards), fragile, mineral or inaccessible samples can be performed at a safe standoff distance of up to several hundred metres. A good overview of this method and its applications can be found elsewhere [123, 124]. For example, standoff Raman detection has been used to detect pollutants in air and water at great distances, as well planetary exploration for the detection of organics mixed in mineral matrices [125–127]. The reason why the TG principle plays an important role in this method stems from the need to reduce the disturbing amount of fluorescence and the background radiation of ambient light from the often unknown heterogeneous sample matrices under inspection. Often, a pulsed laser system around the fluorescence maximum at λexc = 532 nm, or in the UV-region, with very sensitive and gated detectors (ICCDs or SPADs), is employed for this type of application [128, 129]. Recently, Kekkonen et al( 2018) proposed CMOS SPAD detectors for remote Raman detection to further reduce size, price and complexity, with an additional adjustable time-correlation option, for a TG standoff Raman setup. They demonstrated remote distance Raman results for TiO2 using an uncooled low power consumption 16 × 256 CMOS SPAD line sensor, with a 256-channel TDC, and a high scanning resolution of 3.75 cm, at different target distances. Figure 8 shows the TG standoff Raman setup with the CMOS SPAD array detector. It should be noted that the measurement distance to the target can be increased with a telescope aligned with the lens, as shown in figure 8.
Figure 8. Standoff TGRaman, based on a compact time-correlated complementary metal-oxide-semiconductor (CMOS) single-photon avalanche diode (SPAD) array sensor and ps pulsed laser, reprinted with permission from reference [128].
Download figure:
Standard image High-resolution image
Furthermore, an important role for standoff Raman is in terms of its application in the in situ detection of explosives [130]. Gaft and Nagli evaluated already in 2007 gated-Raman for standoff detection of explosives (factory and homemade). They noticed that the binder in explosives creates a strong luminescence signal, and that near-infrared Raman seems to be inapplicable for the detection of explosives, given the presence of strong background fluorescence. Only a stronger scattering probability in UV can overcome the fluorescence issue, since many explosives have maximal absorption bands in parts of the UV spectrum. TG UV Raman excitation can minimize fluorescence, and increases the Raman signal by a factor of about 100–200 [49].
6. Conclusion and outlook
Since the discovery of Raman fluorescence background suppression in the 1970s by Yaney, using a TG PMT detector setup in combination with a pulsed excitation laser source, many new technical approaches, application areas and extensions of this method have emerged. Despite the option to enhance the Raman signal with plasmonic nanostructures (SERS), the disturbing sample-induced fluorescence background still seems to be a major issue across all Raman-related disciplines. Even SERS could benefit from further fluorescence suppression, by combining it with TG Raman. Different detector techniques, ranging from MCP/PMTs, ICCDs with and without Kerr gates, and CCD-based streak cameras, to efficient and compact CMOS SPAD arrays have been used to perform TG Raman. High laser pulse intensities to obtain a sufficient SNR are no loner necessary, due to the increased sensitivity, larger number of active pixels, and improved fill factor available in most recent SPAD-array detectors.
TG Raman technology has in the past been criticised due to its requirements for very complex, expensive and large instrumentation. This problem has been overcome thanks to advances in the CMOS process, which have enabled the fabrication of RS-dedicated SPAD technology. Furthermore, affordable small and fast enough picosecond pulsed micro-chip laser at 532 nm excitation have only recently become available. As the excitation and detector side of the technology matures, it is also possible to move to other regions in the emission spectrum to further reduce auto-fluorescence. Commercial high-performance TG Raman spectrometers for process analytical applications are now available. These are portable and compact in size. Less highly performing but even smaller TG Raman spectrometers would open up more application areas, and have been already demonstrated for various field and environmental sensing applications. A possible future direction is towards mobile and handheld Raman devices, using a TG Raman spectrometer to connect to a smartphone, able to verify measured results via a spectral library in the cloud.
Acknowledgments
We thank the sensing and integration department of VTT, the technical research centre of Finland, for their support in the production of this review article.
Conflict of interest
Co-author Bryan Heilala is affiliated with the company which commercialized the CMOS SPAD detector technology described in this work. The first author has no conflict of interest.