


Abstract
We propose and experimentally validate a wavelength diversity technique combined with a passive depolarizer in order to improve the performance of Brillouin optical time domain reflectometry (BOTDR). The wavelength diversity technique enables the maximization of the launch pump power and suppresses the nonlinear effects, the latter of which limits the conventional BOTDR performance. As a result, the signal-to-noise ratio increases, thus improving the measurement accuracy for strain and temperature. In addition, considering the complexity and expensive methods required for polarization noise suppression in BOTDR system, a simple, low-cost passive depolarizer is employed to reduce the polarization noise. The experimental results show that the signal-to-noise ratio is improved by 4.85 dB, which corresponds to 174% improvement compared to a conventional BOTDR system.
Export citation and abstract BibTeX RIS
1. Introduction
Brillouin based distributed optical fiber sensors gained lots of attention in recent years, due to their immunity to electromagnetic interference, high sensing range over tens of kilometers and capabilities of simultaneous strain and temperature measurements. The dependence of the Brillouin frequency along the fiber distance is basis for the distributed strain and/or temperature sensing. For measuring distributed strain and temperature, two Brillouin-based techniques are widely used; the Brillouin optical time domain reflectometry (BOTDR) [1], based on spontaneous Brillouin scattering (SpBS) and Brillouin optical time domain analysis (BOTDA) [2], based on stimulated Brillouin scattering (SBS). The BOTDR system features simple implementation schemes and only requires access to the single end of the sensing fiber. Whereas, the BOTDA system requires access to the both ends of the sensing fiber with complex system implementation [3, 4].
For both Brillouin based techniques, the signal-to-noise ratio (SNR) of the detected Brillouin signal determines the strain and temperature measurement accuracy at any given location. Heterodyne detection is most commonly used in BOTDR system to amplify the weak SpBS signal [5]. In BOTDR system, the SNR depends on the injected pump power, local oscillator (LO) power, sensing fiber distance and polarization noise. Increasing the injected pump power in BOTDR system will improve the SNR but the level of the pump power is limited by the non-negligible nonlinear effects in the sensing fiber, which comprises of SBS and modulation instability [6]. If the pump power is above the nonlinear threshold, it will result in pump power depletion and invoke unwanted nonlinear effects, hence reducing the sensing range and the accuracy of strain and temperature measurements [7]. Several techniques have been proposed to improve the SNR of the BOTDR system, such as employing multiple longitudinal modes of Fabry–Perot laser [8], Raman amplification [9] and pulse coding [10, 11] techniques.
On the other hand, if the LO signal power is strong enough, the SNR is no longer dependent on the LO signal power [12]. Another performance limitation in the BOTDR system is polarization noise. The polarization noise significantly influences the beat signal fluctuations, which leads to lower SNR, thus reducing the measurement accuracy [13]. When the polarization state of the LO signal and detected Brillouin signal are identical to each other, the beat signal would be at maximum, whereas when the polarization states are orthogonal to each other, the beat signal would be at minimum [14]. In order to minimize the polarization induced measurement error, several techniques have been proposed. Song et al [15] used a polarization controller (PC) in LO path to generate two orthogonal polarizations periodically. However, randomizing the LO signal polarization states requires repeatable and accurate polarization controlling. Another widely used technique is a polarization scrambler, which scrambles the polarization states of the LO signal, and covers all polarization states averagely [16, 17]. However, polarization scrambler is an active device, which induces additional noise to the system and is an expensive device. In addition, a complicated design is needed to make sure that the scrambled polarization states can cover all polarization states averagely [18].
Considering the input pump power limitation due to the nonlinear effects in conventional BOTDR and the complexity with expensive methods required for polarization noise suppression, a wavelength diversity technique combined with a simple, low-cost passive depolarizer is proposed in this paper. In order to evaluate the sensing performance and spatial resolution of the proposed system, we measure the temperature effects and compared with those from the conventional BOTDR.
2. Principle of wavelength diversity technique
In the proposed wavelength diversity BOTDR, multiple wavelengths are injected into the sensing fiber to improve the SNR, thus achieving a higher measurement accuracy. The multiple pump wavelengths significantly increase the total injected pump power into the sensing fiber without activating the unwanted nonlinear effects, while keeping each individual wavelength peak power below the SBS threshold level [7]. As described in [19], the SBS threshold for N pump wavelengths is given by:

where  is the single pump wavelength SBS threshold. Therefore, the SBS threshold with N wavelengths with equal power will be N times greater than the single wavelength. The total pump power with N wavelengths cannot be raised significantly more than the stimulated Raman scattering (SRS) threshold, which imposes a power limit of ~400 to 600 mW [20, 21]. However, in proposed technique using three wavelengths (N = 3), the total peak power (3 × 18 dBm) is still below the SRS threshold. It is important to mention that, there are some prior works, such as employing a multi-mode Fabry Perot laser [8] and multi-wavelength pump source [20] using a polarization scrambler. Due to the large wavelength spacing (0.25 nm) between the Fabry Perot laser modes, the resultant beat spectrum significantly broadens, which leads to the BFS uncertainty. In [21], proposed a time and frequency pump-probe multiplexing method based on two arrays of fiber Bragg gratings (FBGs) in the BOTDA system in order to avoid the nonlinear effect, which is modulation instability. The use of a larger pump frequency spacing of 17 GHz, which leads to a substantial spectral broadening at the receiver. Moreover, the use of polarization scrambler induces an additional noise to the system. Although, the method employed in this paper is based on the heterodyne BOTDR system to overcome the SBS nonlinearity. In addition, we employed a simple, low-cost passive depolarizer and experimentally investigated in the proposed system. The concept of the conventional BOTDR (single wavelength) and our proposed wavelength diversity BOTDR are illustrated in figures 1 and 2, respectively [22]. Figure 1, illustrates the operating principle of the conventional BOTDR using a single wavelength. The pump signal at a frequency, v1 is injected into the sensing fiber, which generates SpBS and detected at the same end. The backscattered stokes Brillouin gain spectrum (BGS) is downshifted with respect to pump signal by the Brillouin frequency shift (BFS), vB. The Brillouin signal beat with LO signal with the frequency of v1 − vLO. The detected electrical beat signal has the center frequency of vB − vLO. In figure 2, our proposed wavelength diversity technique where, three pump wavelengths (N = 3, where N is the number of wavelengths) with the corresponding frequencies of v1, v2, v3 have been considered for generating multiple pump wavelengths instead of a single wavelength in the conventional BOTDR. The three pump wavelengths generate three BGS, which beat with the corresponding LO signals and each pump wavelength has the same frequency separation (Δv) as shown in figure 2(b). The Stokes and Anti-stokes of each pump wavelength, which are
  and
and  , respectively (where, N = 1, 2, 3) beat with corresponding LO frequencies of
  and
and  , respectively. Therefore, at the receiver, the superimposed Brillouin gain amplitude (which is proportional to the sensor amplitude response improvement [7]) will be N (three) times larger than that of the conventional BOTDR as shown in figure 3. As a result, the SNR will increase. Considering the beat signal frequency components among LO frequencies of
  and
and  , and backscattered Brillouin Stokes signals of
  , (N = 1, 2, 3), the potential obtained frequency components are described in figure 4. It is noted that, the frequency spacing between the pump wavelengths should be larger than the PD bandwidth, in order to avoid the undesired beating between the other LO frequencies and backscattered Brillouin signals.

Figure 1. Conventional BOTDR (N = 1) (a) operating principle (b) Brillouin gain spectrum.
Download figure:
Standard image High-resolution image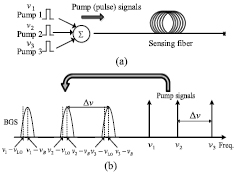
Figure 2. Proposed wavelength diversity BOTDR (N = 3) (a) operating principle (b) Brillouin gain spectrums.
Download figure:
Standard image High-resolution image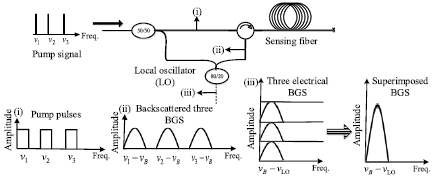
Figure 3. Schematic representation of proposed wavelength diversity BOTDR (N = 3).
Download figure:
Standard image High-resolution image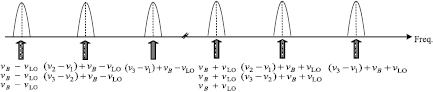
Figure 4. Schematic diagram of beat signal frequency components among LO frequencies ( ) and Stokes Brillouin signals (
 ).
).
Download figure:
Standard image High-resolution imageIn our proposed technique, the following factors should be taken into account: (i) the frequency spacing between the different pump wavelengths must be two times larger than the BGS linewidth of ~30 MHz to avoid the interference; (ii) the frequency spacing between the pump wavelengths should be greater than the PD bandwidth (iii) on the other hand, if the frequency spacing is too large then it will result in a beat spectral broadening at the receiver, which causes a BFS uncertainty [23]. As shown in figure 5, we experimentally verified that the BFS dependence on pump wavelength. Figure 5(a) shows the measured BGS for different pump wavelengths ranging from 1546 to 1562 nm and the resultant BFS dependence is 7.02 MHz nm−1, as shown in figure 5(b). This corresponds to 0.056 MHz GHz−1. In our proposed technique, the beat spectral broadening caused by the different pump wavelengths can be negligible due to the small frequency spacing of the pump wavelengths (less than 10 GHz). The other nonlinear effects such as four-wave mixing and cross-phase modulation can be negligible in proposed technique, as each wavelength pump power is less than the SBS threshold and pump pulse repetition frequency normally less than 1 MHz [20].

Figure 5. (a) BGS measured for different pump wavelengths (b) calculated BFSs for wavelengths ranging from 1546 to 1562 nm.
Download figure:
Standard image High-resolution imageFurthermore, the pump wavelength frequency spacing can be set with following different cases:
Case 1 (Δv > 2 × BFS): The frequency spacing between N pump wavelengths can be twice larger than the BFS (~11 GHz) of the sensing fiber to ensure no frequency overlapping. In this case, the main disadvantage is that the large spectral coverage is required in the presence of higher pump wavelengths. In addition, the higher frequency RF signal generator and electro-optic modulator are needed to generate different pump wavelengths, which make the system expensive.
Case 2 (BFS < Δv < 2 × BFS): The frequency spacing can be higher than the BFS but less than the twice of the BFS. This configuration is spectrally more efficient than the case 1. However, in both case 1 and 2, the use of large frequency spacing leads to the beat spectral broadening, thus BFS uncertainty.
Case 3 ( ): The frequency spacing is lower than the BFS but higher than the twice the BGS linewidth
  (~60 MHz), hence avoiding the crosstalk between BGS. In this case, generation of multi pump wavelengths could be easier since it only requires lower RF frequency components. Moreover, the BFS uncertainty induced by the beat spectral broadening can be considered negligible [24]. Therefore, the most effective configuration for separation of pump wavelength is case 3.
The detected photocurrent with N wavelengths can be expressed as [25]:
where  is the photodetector responsivity,
  is the peak Brillouin signal power of ith pump wavelength at time t,
  is the peak power of ith LO signal,
  is the frequency difference between the Brillouin signal and LO signal, θ denotes the polarization angle difference of Brillouin signal and LO signal. Furthermore, the SNR of the wavelength diversity BOTDR with N wavelengths can be expressed as follows [26, 27]:
where  is the total peak power of the Brillouin signal,
  is the total LO power and Navg is a number of trace averages. In the above denominator, the first term
  and the second term
  denote the thermal noise and shot noise of the photodetector, respectively.
  is the Boltzmann constant, T is the photodetector operating temperature in Kelvin,
  is the load resistance, q is the elementary charge, B is the bandwidth of the photodetector and the term
  is the power of the electrical noise.
Assuming, the polarization state of both Brillouin signal and LO signal are identical to each other (θ = 0, a passive depolarizer is used in the proposed system) and sufficient trace averages are used (Navg > 2000) [28], then the SNR can be modified as:
 and
and  can be expressed as:
where  is the peak power of the Brillouin signal of ith pump wavelength and
  is the peak power of the ith LO signal, respectively. In the proposed technique, each pump wavelength has the same level of peak power, which is below the SBS threshold. Therefore, the total injected pump power is spectrally distributed over three wavelengths to overcome the nonlinear effects.
Furthermore, the measurable one way fibre loss range or dynamic range (DR) of the BOTDR system is defined as the longest sensing range can be reach at a required strain/temperature accuracies (or at a required SNR) is expressed as [12, 29],

where  is the input pump power (dBm),
  is the Brillouin backscattering factor (dB),
  is the Brillouin scattering selection ratio (dB),
  is the directional coupler loss (dB),
  is the minimum detectable power of the receiver (dBm),
  is the SNR improvement (averaging and other sophisticated techniques) (dB),
  is the SNR required for strain/temperature measurement (dB). Assuming, the quantum noise of the receiver is much higher than the thermal noise, its sensitivity will be improved towards the ultimate quantum limit, and the minimum detectable power will be −90 dBm [29]. Adopting the values defined in [12], which were,
  = 20 dBm,
  = −68 dB,
  = −14 dB,
  = 5 dB,
  = −90 dBm and assuming the required SNR for a 1 °C temperature accuracy is,
  = 25 dB and
  = 20 dB after the 40 000 trace averages, the DR estimated to be 10.2 dB at a spatial resolution of 100 m [30]. At the same set of conditions, we theoretically evaluated the DR improvement with an improved SNR using (7) and illustrated in figure 6, and the obtained slope is 0.25 dB/SNR.

Figure 6. SNR improvement versus enhanced DR.
Download figure:
Standard image High-resolution image3. Fundamentals of passive depolarizer technique
In heterodyne BOTDR system, the polarization state of both Brillouin signal and LO signal should be identical to each other, in order to reduce the beat signal fluctuations. Typically, the polarization state of the LO signal is stable, due to the small length of fiber path and stable environment. Deventer et al [14] confirmed that, the polarization state of the Brillouin signal changes randomly along the fiber distance and unpredictable in advance. The Brillouin signal over the fiber distance is given by [15]:

The Brillouin signal polarization state changes randomly in x and y directions along the fiber distance, z. If the polarization state of the LO signal maintains only in x or y direction, only part of the Brillouin signal is maximized which leads to beat signal fluctuations. Therefore, the polarization of the LO signal is split into two orthogonal polarization states and described as [15]:

where,  is the time delay between the two orthogonal polarization states. When the LO signal beat with the Brillouin signal, the resultant beat signal can be expressed as [19]:

The LO signal distributes in two orthogonal polarization states, thus the beat signal fluctuations induced by the polarization noise can be eliminated effectively.
The schematic representation of the passive depolarizer is illustrated in figure 7. The polarization beam splitter (PBS1) is used to split the input light polarization, which are orthogonal to each other. These two signals are coupled back through a PBS2, which is used as polarization beam combiner. A polarization maintaining fiber (PMF) of 5 km, whose length is longer than the coherence length of the laser light. The time delay between the two orthogonal polarization signals eliminates the fixed phase relationship between them, when they are recombined using PBS2. In this passive configuration, the LO signal is composed of two orthogonal polarization signals with equal power, which significantly eliminates the beat signal fluctuations [18, 31].

Figure 7. Schematic representation of passive depolarizer based on Mach–Zehnder interferometer.
Download figure:
Standard image High-resolution image4. Experimental setup
The experimental setup for the proposed wavelength diversity BOTDR using a passive depolarizer is illustrated in figure 8. A distributed feedback laser (DFB) laser at 1550 nm with an output power of 10 dBm is used as a laser source. The single wavelength laser output is modulated by a Mach–Zehnder modulator (MZM) driven by an external microwave signal generator at 5 GHz. In our experiments, a 5 GHz frequency spacing has been selected due to the availability of only 4 GHz bandwidth PD in our laboratory (the frequency spacing between the pump wavelengths should be greater than the PD bandwidth to avoid the undesired beating between the other LO frequencies and backscattered Raleigh and Brillouin signals). In our experiments, the spectral broadening at the receiver using 5 GHz pump frequency spacing is 0.28 MHz (0.056 MHz GHz−1), which is considerably negligible compared to BGS linewidth of ~40 MHz. By tuning the DC bias of the modulator, the three pump wavelengths (carrier and two sidebands) can be set to an equal peak power. The three pump wavelengths are split into two propagation paths using 50/50 coupler, the upper branch signal is used for the pump and the lower branch signal is used for the LO signal. The PC is employed at the input of each MZM to achieve the maximum optical power at the output of the MZMs. The upper branch modulated with a dual drive MZM (DD-MZM), which modulates the electrical pulses into optical pulses with a high extinction ratio. Subsequently, the output signal is amplified by an erbium-doped fiber amplifier (EDFA). The amplified spontaneous emission (ASE) filter is used to eliminate the ASE noise from the EDFA. The peak power and pulse width of each pump wavelength are the same as those of the single wavelength, i.e. 18 dBm and 50 ns, respectively.

Figure 8. Experimental setup of wavelength diversity BOTDR (N = 3) using a passive depolarizer technique (DFB laser = distributed feedback laser, PC = polarization controller, MZM = Mach–Zehnder modulator, EDFA = erbium doped fiber amplifier, DD-MZM = dual drive-MZM, ASE = amplified spontaneous emission, PBS = polarization beam splitter, PMF = polarization maintaining fiber, ESA = electrical spectrum analyzer).
Download figure:
Standard image High-resolution imageThe LO signal is then modulated by the MZM 2, whose frequency is down-shifted and up-shifted by 10 GHz from the original frequency with six sidebands. Thereafter, the six LO signal is fed into the passive depolarizer to suppress the polarization noise as described in section 3. Since the output of MZM 2 is not a PM fibre, therefore, a PC 4 is used to rotate the input polarization state in order to guarantee that the two polarization signals at outputs of PBS 1 have equal powers [18, 32]. The PC 5 is used to adjust the polarization state of the light, which can demonstrate the effect of a fully functional/non-functional depolarizer. The peak power before the depolarizer and after depolarizer is 5.2 dBm and 3.4 dBm, respectively. Therefore, the insertion loss of the depolarizer is 1.8 dB. The LO signal beat with the three BGS. The beat signal is detected by the photodetector and analyzed by an electrical spectrum analyzer (ESA) in a zero-span mode. Acquisition procedure and data processing remain identical to those of the conventional single wavelength BOTDR. The electrical signal from the photodetector consist summed contribution of BGS generated by three pump wavelengths.
5. Results discussion
The peak Brillouin frequency power traces obtained for conventional single wavelength BOTDR with depolarizer and without depolarizer are illustrated in figure 9. For both the cases, 2000 trace averages are used. As shown in figure 9, the signal fluctuations induced by the polarization noise has been reduced significantly using a passive depolarizer, which proves that the introduction of a passive depolarizer can effectively reduce the beat signal fluctuations.

Figure 9. Peak Brillouin power traces of conventional BOTDR with depolarizer (blue curve) and without depolarizer (red curve).
Download figure:
Standard image High-resolution imageTo experimentally validate the proposed system, the peak Brillouin frequency power traces are measured for both the conventional single wavelength BOTDR and wavelength diversity BOTDR (N = 3). Figure 10 illustrates the comparison of the SNR of measured traces for three different cases. The measured SNR of the wavelength diversity BOTDR without depolarizer (black curve) has strong oscillations induced by the polarization noise. Interestingly, the same SNR response has been obtained at the starting of the sensing fiber, due to the same input pump power and low polarization noise, due to the shorter optical path. However, the polarization noise is significantly reduced using the passive depolarizer technique. At the far end of the sensing fiber, the SNR of the conventional BOTDR (red curve) is 5.1 dB. However, for the proposed wavelength diversity BOTDR (blue curve), the SNR has been significantly improved up to 9.95 dB. Therefore, the improved SNR is 4.85 dB, which corresponds to 174% improvement.
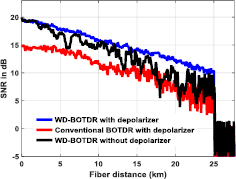
Figure 10. Comparison of SNR at peak Brillouin gain frequency of conventional BOTDR (red curve), WD-BOTDR with depolarizer (blue curve) and WD-BOTDR without depolarizer (black curve).
Download figure:
Standard image High-resolution imageIn order to obtain a 3D spectral mapping, the frequencies are swept from 10.79 GHz to 10.94 GHz with a frequency step of 1 MHz and 2000 trace averages. The proposed wavelength diversity BOTDR spectrum with passive depolarizer is shown in figure 11. The obtained BFS profile over the sensing fiber distance is shown in figure 11 inset. The BFS distribution of conventional BOTDR and wavelength diversity BOTDR (both with passive depolarizer) over the sensing fiber is shown in figure 12. By calculating the standard deviation of the measured BFS at each fiber location, the frequency error along the fiber distance can be obtained.
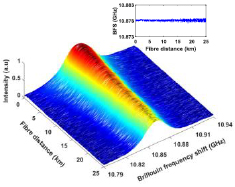
Figure 11. Measured 3D spectrum over fiber distance of proposed wavelength diversity BOTDR with passive depolarizer.
Download figure:
Standard image High-resolution image
Figure 12. Brillouin frequency shift (BFS) distribution of conventional BOTDR and wavelength diversity BOTDR.
Download figure:
Standard image High-resolution imageFirstly, we experimentally verified the strain and temperature sensitivities of the sensing fiber. We obtained the strain sensitivity of 0.05 MHz/µε and temperature sensitivity of 1.07 MHz °C−1. As shown in figure 13, at the far end of the sensing fiber, the frequency error of the conventional BOTDR and wavelength diversity BOTDR are 0.65 MHz and 0.18 MHz, respectively. Therefore, at the far end of the sensing fiber, the accuracy of strain measurement is 13 µε and 3.6 µε, respectively (the calibrated strain coefficient of the fiber is 0.05 MHz/µε). Whereas, the temperature measurement accuracies are 0.6 °C and 0.16 °C, respectively (the calibrated temperature coefficient is 1.07 MHz °C−1). This corresponds to measurement accuracy improved 3.6 times for the strain and 3.75 times for the temperature using the proposed wavelength diversity BOTDR compared to the conventional single wavelength BOTDR.
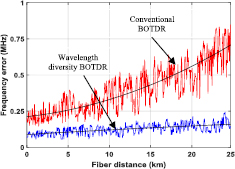
Figure 13. Brillouin frequency measurement error versus fiber distance of conventional BOTDR and wavelength diversity BOTDR.
Download figure:
Standard image High-resolution imageIn order to evaluate the temperature sensing performance and spatial resolution of the proposed system, a 30 m fiber at the far end of the sensing fiber is placed in an oven. The rest of the fiber kept at strain free and at room temperature (~25 °C). At 65 °C, the 3D spectral mapping is shown in figure 14. The frequencies are swept from 10.8 GHz to 11 GHz, with a frequency step of 1 MHz and 2000 trace averages. The BFS distribution along the sensing fiber for both the conventional BOTDR and wavelength diversity BOTDR is illustrated in figure 15. The spatial resolution of 5 m is attained as shown in figure 15 inset, which confirms the 50 ns pulse width used in both the systems. The results demonstrate an accurate temperature measurement and no penalty on the spatial resolution in our proposed technique. Furthermore, we can improve the number of pump wavelengths more than three using either multi MZMs or narrow spacing multi-wavelength laser, although it makes the system more complicated [33].
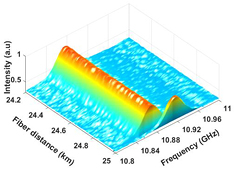
Figure 14. Temperature (65 °C) induced 3D spectrum of wavelength diversity BOTDR at far end of the sensing fiber.
Download figure:
Standard image High-resolution image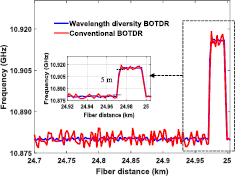
Figure 15. Comparison of measured BFS distribution of conventional BOTDR and proposed wavelength diversity BOTDR.
Download figure:
Standard image High-resolution image
6. Conclusion
We proposed and experimentally demonstrated an SNR improvement in a BOTDR system using a wavelength diversity technique. The proposed technique enables the maximization of the launch pump power, hence achieved an improved SNR, while avoiding the unwanted nonlinear effects, which limits the conventional BOTDR performance. Furthermore, we employed a simple, low-cost passive depolarizer for polarization noise suppression, which significantly reduces the system cost for the BOTDR system. The wavelength diversity BOTDR (N = 3) is able to provide an enhanced SNR up to 4.85 dB, corresponds to 174% improvement compared to the conventional single wavelength BOTDR. The proposed technique can be effectively combined with other sophisticated techniques, such as pulse coding, Raman amplification techniques for further sensor performance improvement.