

Abstract
The accident at Fukushima Daiichi Nuclear Power Plant caused radioactive materials to spread outside the plant. To limit exposure in the area, air dose rates have been measured. When the dose rate exceeded the acceptable upper bound, the area was decontaminated by stripping the soil and washing roads. Immediately after the accident, it was not clear how much of an effect outdoor contamination had on dose rates inside houses. This paper discusses the effect of outdoor contamination on indoor air dose rates and factors influencing those dose rates based upon actual measurements taken of a wooden house standing on flat land in the area around the power plant. In addition, the effects of indoor horizontal distribution, height distribution, and decontamination are discussed using simple model simulations. As a result, the following was found, although within the range of air dose rates and location conditions measured in this study. Horizontal variation in indoor air dose rates decreases monotonically toward the centre of the house. Once decontamination has been performed, the overall dose rate decreases and variation becomes smaller. This trend is thought to be mainly due to expansion of a low-dose area. Vertical changes in indoor air dose rates are not straightforward. It is estimated that the dose rate decreases near the ground surface, then tends to increase going higher and finally decreases even higher up. This change in dose rates is thought to be due to the effect of radioactive materials permeating the soil. Recognition of the effects of these factors is important when estimating indoor air dose rates because indoor air dose rates are affected by the degree of decontamination, house size, and degree of penetration of radionuclides into the soil.
Export citation and abstract BibTeX RIS

Original content from this work may be used under the terms of the Creative Commons Attribution 4.0 license. Any further distribution of this work must maintain attribution to the author(s) and the title of the work, journal citation and DOI.
1. Introduction
The accident at the Fukushima Daiichi Nuclear Power Plant resulted in radioactive materials spreading outside the plant. The area around the plant is comprised of wooden houses and farmland. After the accident, areas were designated as Evacuation Order Zones based on the radiation dose rate and distance from the plant. A requirement prior to lifting the evacuation order is that area residents' level of exposure to radioactive materials must be below a predetermined threshold value.
After the accident, both areas where the annual additional dose was assessed, and found to exceed 20 mSv y−1, and the area within a 20 km radius around the plant were designated as Evacuation Order Zones. In August 2011, the government enacted the Act on Special Measures [1] for radioactive material contamination and decontamination area designation. The decontamination process has involved removing radioactive materials from buildings, roads, and other places [2].
Exposure varies according to lifestyle, but may be broadly divided into two categories: outdoor exposure and indoor exposure. Since the outdoor air dose rate has been generally measured using airborne monitoring surveys [3] and ground-based monitoring surveys [4], the annual dose rate has been calculated by estimating the indoor dose rate based on the results of outdoor air dose rate measurements and factoring in time spent indoors and outdoors [5]. Although it may be assumed that the indoor air dose rate varies depending on the location within a room, a representative estimation method has been used. Specifically, the ratio of the indoor air dose rate to outdoor air dose rate, i.e. the reduction factor, was used. A reduction factor of 0.4 was used as the numerical value for one- and two-story wooden houses. This number is based on data from the International Atomic Energy Agency [6, 7].
Over time, measurement and knowledge of indoor air dose rates have gradually increased. JAEA [8–10] conducted actual measurements in Fukushima prefecture and found that the indoor reduction factor is generally 0.4. Yoshida et al [11] measured 69 houses and obtained reduction factors based on indoor and outdoor measurements. The median reduction factor was found to be 0.43 with a quartile range of 0.34–0.53. It was also shown that indoor contamination has been minimal. Ichijo et al [12] measured air dose rates inside and outside wooden houses in a low-dose area of Fukushima Prefecture. These earlier papers attributed the air dose rates measured inside houses mostly to outdoor contamination. Ito [13] also measured inside houses in the evacuation zone and pointed out that values at ceiling height were higher than at the floor level as well as at the height of 1 m on both the first and second floors.
Actual measurements have increased our knowledge of radioactive material deposition, which has a significant impact on air dose rates. Although radioactive material adheres to the ground immediately after an accident, it penetrates the soil down to a depth of several centimetres over time [14]. In addition, it was found that there was little adhesion of radioactive materials to house walls, which was partly due to the effect of rain [15]. Adhesion of radioactive materials to house roofs has been reported to be limited, depending on the roofing material, but also because of the effect of rain [16].
Thus, more and more data based on actual measurements are available, but detailed studies of indoor areas are still scarce. By looking at air dose rates in terms of horizontal and vertical distributions, it is possible to estimate whether indoor areas are contaminated or not. In addition, the air dose rate changes between the first and second floors, and at the windows and the inner parts of the rooms, so the exposure dose rate is determined by the location of the occupants even within the same house. Enriching such actual measurement data will be useful for people in resuming life in these areas.
Simulations have also been conducted to analyse indoor dose rates. Beppu et al [17] used PHITS to conduct simulations to create a database of building material shielding against gamma radiation sources. They showed that the dose transmission coefficient is 0.984 for a typical wooden house wall, which indicates that the exterior walls of a wooden house can be expected to provide little shielding effectiveness. In addition, Furuta et al [18] created a model of a wooden house, school, hospital, and other public buildings to simulate real structures and used the radiation transport code PHITS to evaluate these [19]. In this study, we assumed that radioactive materials penetrate the soil. Based on this assumption, the reduction coefficient for the indoor air dose rate from outdoor air dose rate was determined to be between 0.3 and 0.7. The variation in the reduction factor is due to differences in house size and measurement location as well as the fact that Japanese wooden houses are smaller than similar houses in the United States as discussed. The report also indicates that the soil penetration of radioactive materials is a factor leading to higher air dose rates on the second floor than on the first floor. The interpretation of measured data can be enhanced by comparing it with simulations.
The Japanese government has published decontamination results [15] and demonstrated its effectiveness. Detailed presentation of changes in air doses before and after decontamination in residences can also contribute to concrete demonstration of the effects of decontamination.
The authors [20] compared actual monitoring data and simulated measurements to examine the relationship between indoor air dose and soil infiltration at a house. However, this was a limited case study.
This paper presents detailed measurements of air dose rates inside houses, including conditions before and after decontamination. In addition, for matters that require analytical understanding derived from actual measurement results, parameter studies using simple simulations was conducted to confirm trends.
This report covers detached houses standing on flat land with initial air dose rates of 15 μSv h−1 or less in the Fukushima evacuation area where residential decontamination was required at that time. Since air dose rates, topography, and surrounding environmental conditions vary from place to place even within the area, this report cannot be used to interpret the dose rates of all houses. However, it is possible to gain a better understanding of the distribution of indoor air dose rates in the targeted houses by comparing them with outdoor air dose rates.
2. Overview of actual measurements
Between 2013 and 2018, the indoor and outdoor air dose rates were measured for ten wooden houses in the Hamadori district of Fukushima Prefecture.
An overview of the houses and the measurement dates is shown in table 1.
Table 1. Brief description of houses and survey dates.
| No. | Overview of the houses | Survey date | |
|---|---|---|---|
| Before decontamination | After decontamination | ||
| A | Traditional construction, 2 stories | October 2013 | — |
| Outer wall: wood panels on mortar finish | |||
| B | Traditional construction, 2 stories | September 2013 | May 2017 |
| Outer wall: wood panels on mortar finish | |||
| C | 2 × 4 construction method, 1 story | November 2013 | November 2015 |
| Outer wall: ceramic siding | |||
| D | 2 × 4 construction method, 2 stories | November 2013 | November 2015 |
| Outer wall: ceramic siding | |||
| E | 2 × 4 construction method, 2 stories | November 2013 | November 2015 |
| Outer wall: ceramic siding | |||
| F | 2 × 4 construction method, 2 stories | November 2013 | November 2015 |
| Outer wall: ceramic siding | |||
| G | 2 × 4 construction method, 2 stories | November 2013 | November 2015 |
| Outer wall: ceramic siding | |||
| H | 2 × 4 construction method, 2 stories | November 2013 | November 2015 |
| Outer wall: ceramic siding | |||
| I | 2 × 4 construction method, 2 stories | November 2013 | November 2015 |
| Outer wall: ceramic siding | |||
| J | 2 × 4 construction method, 2 stories | November 2013 | November 2015 |
| Outer wall: ceramic siding | |||
Houses A and B are traditional two-story wooden houses located in the northeastern region of Japan. Their roofs are tiled and they have walls constructed of wood panels with mortar. Both houses are located in residential areas, which are flat, and have an area of approximately 150 square meters. House A is close to the north side of the site boundary. The north side boundary has an approximately 1.5 m high concrete block wall 2 m from the building with a gutter on the outside. On the south side of the house, a garden has been planted about 5 m away from the house and the ground is soil and gravel. House B has garden trees approximately 5 m away from the residence around the property boundary. On the south side of the house, some trees been planted approximately 10 meters away and the ground is dirt and gravel.
Houses C through J are located on the same parcel of land. They are built using the 2 × 4 construction method. The structure has higher density walls compared to House A and House B. Thus, compared to the conventional Japanese construction method, these walls are slightly more effective at shielding the structure from external radiation. Each house is small, having an area of about 50 square meters. Houses C to J are located in a row of plots and spaced at intervals of between 2 and 10 meters. There are no trees on the site. The ground is soil and gravel.
A NaI scintillation survey meter (TCS-172B, Hitachi Aloka Medical, Ltd) was used to measure the air dose rate.
Indoor rooms were measured in the centre at a height of 1 m from the floor, and outdoor areas were measured at points at least 2 m away from exterior wall and 1 m above ground. Measurement points were selected to accurately determine the spatial distribution of indoor air dose rates. When taking measurements to confirm horizontal distribution, the measurement points were set at a height of 1 m. The measurement points were set at three locations: near a window, in the centre of the room, and at the back of the room. When taking measurements for defining the vertical distribution, six points were set: 1 cm, 50 cm, 100 cm, 150 cm, 200 cm above the floor, and just below the ceiling.
3. Results
The results of the measurements for each house are given below.
3.1. House A
The measurement results for the centre of each room, at a height of 1 m, and outdoors are shown in figure 1. Measurements after decontamination were not taken at House A. The average indoor value for first floor is 4.14 μSv h−1. Indoor dose rates in Rooms 1 and 2, which are located in the centre of the house, are low, and relatively high in other rooms facing the outside. The average outside dose rate was 10.93 μSv h−1, and ranged from 8.05 μSv h−1 to 13.1 μSv h−1, depending on the measurement location.

Figure 1. Indoor and outdoor air dose rates at House A.
Download figure:
Standard image High-resolution imageIn order to ascertain dose rate distribution in the same room, vertical cross-sections aligned at the centre in the north-south direction of House A's Room 2 and Room 4 are shown in figure 2. It can be seen that the radiation dose rate is relatively high near the windows and high under the ceiling.

Figure 2. Vertical cross-sectional distribution of air dose rate at House A.
Download figure:
Standard image High-resolution image3.2. House B
The measurement results for the centre of each room, at a height of 1 m, and outdoors are shown in figure 3. Measurements were taken before and after decontamination was performed at House B. The average indoor dose rate was 1.00 μSv h−1 before decontamination and 0.29 μSv h−1 after decontamination, i.e. the air dose rate decreased to approximately 30% after decontamination. The average outdoor dose rate was 2.31 μSv h−1 before decontamination and 0.42 μSv h−1 after decontamination, i.e. the air dose rate was fell to approximately 20% of its earlier value after decontamination.
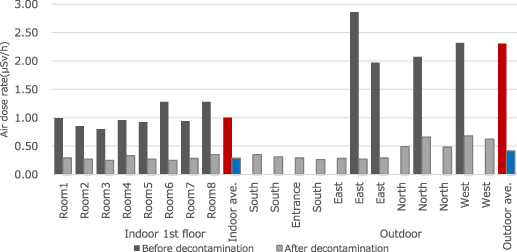
Figure 3. Indoor and outdoor air dose rates at House B.
Download figure:
Standard image High-resolution imageFigure 4 shows the vertical cross-sectional distribution before decontamination and figure 5 shows the vertical cross-sectional distribution after decontamination. Although the number of data samples before decontamination is small, different rates may be seen at different heights before decontamination, while difference by height is reduced after decontamination.
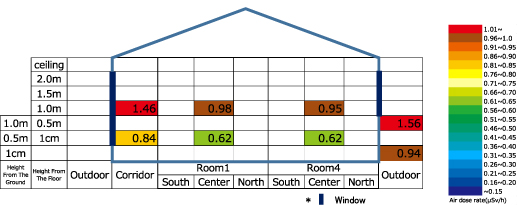
Figure 4. Vertical cross-sectional distribution of air dose rate at House B (before decontamination).
Download figure:
Standard image High-resolution image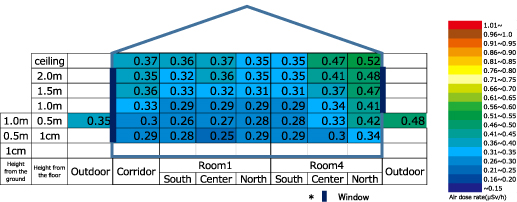
Figure 5. Vertical cross-sectional distribution of air dose rate at House B (after decontamination).
Download figure:
Standard image High-resolution imageThese figures show a significant decrease in the indoor air dose rate due to decontamination. In addition, the dispersion of air dose rates also decreased. However, the degree of indoor dose rate decrease was smaller than that of the outdoor dose rate.
3.3. Houses C through J
The measurement results for the centre of each room, at a height of 1 m, and outdoors are shown in figure 6. At these houses, measurements were taken before and after decontamination, except for a few houses.
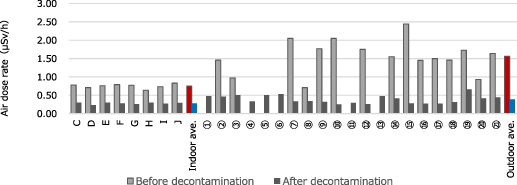
Figure 6. Indoor and outdoor air dose rates at Houses C through J.
Download figure:
Standard image High-resolution imageThe average indoor dose rate was 0.75 μSv h−1 before decontamination and 0.28 μSv h−1 after decontamination, indicating that the air dose rate decreased to 30%–50% of its original value due to decontamination. The average outdoor dose rate was 1.64 μSv h−1 before decontamination and 0.39 μSv h−1 after decontamination, i.e. the air dose rate fell to about 25% of its original value due to decontamination. Dose rate variability also appears to have decreased. However, at these houses, the reduction of indoor air dose rates was smaller than that of outdoor air dose rates.
House I is used as the representative house to confirm cross-sectional distributions as this house is where the most detailed data could be measured before and after decontamination. The cross-sectional distributions of air dose rates before and after decontamination are shown in figures 7 and 8. Before decontamination, air dose rates were high near the outer wall and under the ceiling, and dose rates were low in the centre of the room. After decontamination, the same trend remains, but the dose values are within a more limited range.
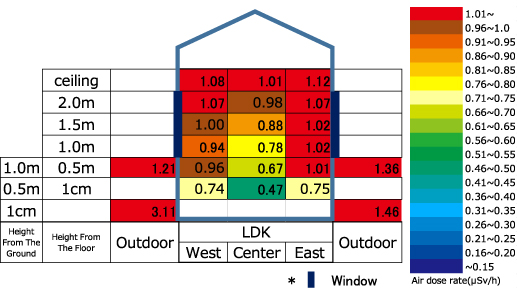
Figure 7. Vertical cross-sectional distribution of air dose rate at House I (before decontamination).
Download figure:
Standard image High-resolution image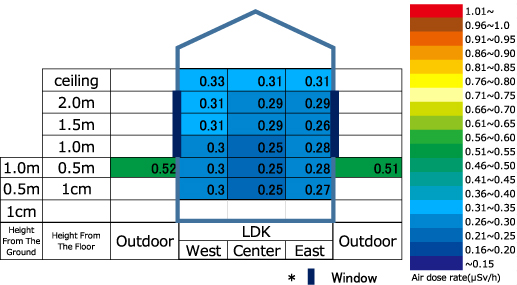
Figure 8. Vertical cross-sectional distribution of air dose rate at House I (after decontamination).
Download figure:
Standard image High-resolution image4. Discussion
4.1. Air dose rate distribution in the horizontal direction
The horizontal distribution at a height of 1 m above the ground outdoors was focused on in order to understand the changes in horizontal air dose rates indoors in detail. This height corresponds to a height of 50 cm from the floor indoors. The results of measurements taken at intervals of about 2 m in the horizontal direction are shown for House A (figure 9), after decontamination of House B (figure 10), and before and after decontamination of House I (figure 11).

Figure 9. Horizontal distribution of indoor air dose rates at House A.
Download figure:
Standard image High-resolution image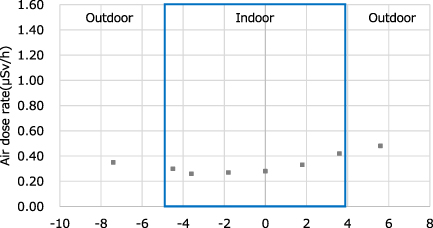
Figure 10. Horizontal distribution of indoor air dose rates at House B.
Download figure:
Standard image High-resolution image
Figure 11. Horizontal distribution of indoor air dose rates at House I.
Download figure:
Standard image High-resolution imageThere was a difference between the air dose rates near the windows and in the inner part of the room.
In a horizontal direction, the dose rate decreases going toward the centre of the house from the outer walls of the house, which is due to the fact that the indoor space under the floor is a non-contaminated area. In addition, no unusual trends, such as unnatural increases in air dose rates, were observed. These results suggest that there were no suspicious circumstances in which radioactive materials entered a room, or at least, there was no infiltration of radioactive materials that affected the air dose rate. Comparing the range of variation in indoor air dose rates at House I before and after decontamination, the air dose rates after decontamination appear to be smaller than those before decontamination.
Simulations were performed to confirm the trend of the horizontal indoor reduction and the effect of decontamination.
The simulations were conducted using a horizontal model (appendices

Figure 12. Horizontal distribution of indoor and outdoor air dose rates (fluence).
Download figure:
Standard image High-resolution imageIn the case of decontamination area with contamination degree 1, the indoor centre dose rate is about 0.65 compared with the non-decontaminated area outdoors. In the case of a zero degree of contamination in decontamination area, i.e. complete decontamination of the area around the house, the indoor-centred dose rate is about 0.57. The effect of decontamination on reducing dose rate is evident. The reduction in air dose rates due to decontamination was not large, but this was probably due to the fact that the area of decontamination around the house was limited.
Both actual measurements and simulations show that air dose rates decreased going toward the centre of the houses. The reduction in indoor air dose rates and decrease in variability due to decontamination can be understood to be a result of the fact that decontamination was performed in the field at varying degrees of intensity commensurate with the degree of contamination. The results also showed a tendency to reduce variability of air dose rates, which may be due to the impact of the decontamination process on the size of low-dose-rate areas.
The effect of outdoor decontamination is not only to reduce air dose rates, but also to reduce residents' personal exposure doses regardless of where they are indoors due to the elimination of unevenness in indoor air dose rates.
Although the results of actual measurements of houses have previously been published, improvement of the data based on multiple points of measurements within a single house is valuable, and enhancing understanding of the conditions by comparing with simulations is also valuable.
4.2. Air dose rates in the vertical direction
In the vertical direction, the trend was that the higher the measurement position, the higher the air dose rate. This tendency has been reported in previous studies.
In order to make a detailed confirmation of the results, the measured dose rate distributions in the height direction indoors are shown in figure 13 for House A, figure 14 for House B, and figure 15 for Houses C through J.
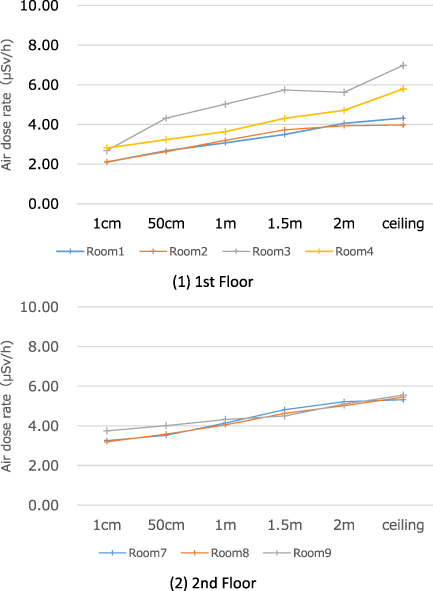
Figure 13. Vertical distribution of indoor air dose rates at House A.
Download figure:
Standard image High-resolution image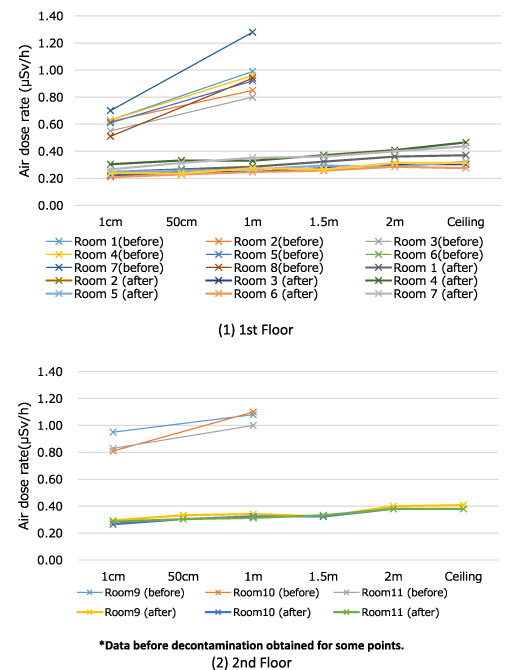
Figure 14. Vertical distribution of indoor air dose rates at House B.
Download figure:
Standard image High-resolution image
Figure 15. Vertical distribution of indoor air dose rates at Houses C through J.
Download figure:
Standard image High-resolution imageThe higher the measurement point, the higher the dose rate tended to be. This variation was observed on both the first and second floors. A comparison of the dose rates at the ceilings of the first floor and on the second level floors shows a tendency for air dose rates to decrease at the boundary between the first and second floors.
The reason for the increase in the dose rate at greater heights is thought to be partly due to the impact of the surrounding environment, but the overall effect is believed to be due to ground penetration of radioactive materials. Comparing dose rates on the first and second floors, the ceiling measurement on the first floor is higher than the floor-level value on the second floor. This may be due to the fact that even in a wooden house, there are many structural materials, such as beams, as well as surface materials between the ceiling of the first floor and the floor of the second floor that are dense. These dense materials may have a shielding effect.
With a few exceptions, Houses C through J were measured before and after decontamination, and the effect that decontamination had on reducing air dose rates is clearly evident. Although the tendency for air dose rates to increase going up from the floor to the ceiling remains, the range of fluctuation seems to be smaller because of decontamination.
This trend was confirmed by simulation (appendices
The simulation results with soil penetration are shown in figure 16. The dose rate decreases once, then rises to a certain height, and finally declines, as can be seen in the case of a 10 m × 10 m or 20 m × 20 m site, due to the combined effects of radioactive materials on the surface and soil penetration. Near the ground surface, the dose rate decreases due to the impact of radioactive materials on the ground surface, then increases due to the impact of radioactive materials in the ground. Finally, the dose rate decreases as the distance from the radioactive materials both on and in the ground increases. This trend showing an increase in the dose rate at the height of the first and second floors of a typical house was simulated in the paper by JAEA [18].

Figure 16. Vertical distribution of dose rate for the case with the contamination distributed to depth in the soil.
Download figure:
Standard image High-resolution imageDose rates in the vertical direction tended to be higher at the ceiling than on the floor and higher on the second floor than on the first floor. There was no change in this trend before or after decontamination, and it is not believed to be affected by the decontamination. In the simulation, this phenomenon was reproduced by simulating soil penetration of radioactive materials.
There was also a tendency for measured air dose rates to be lower on the second floor than at the first floor ceiling. However, house structural materials were ignored in the simulations because they were not expected to have a substantial shielding effect. However, as mentioned earlier, house structural materials at the boundary between the first and second floors are, in fact, thought to have a substantial shielding effect and reduce the dose rate.
Regarding the vertical direction, although a theoretical study has been conducted based on actual measurements and JAEA's paper [18], it is worthwhile conducting simulations to verify the dose rate distribution based on actual measurement data and clarify continuous change in the air dose rate going from low to high positions.
4.3. Reduction factor
The results of actual measurements show that decontamination reduces outdoor air dose rates and significantly reduces indoor air dose rates. This can be easily assumed for wooden buildings with low shielding effectiveness.
Although decontamination reduces air dose rates, the degree of reduction appears to be different in indoor and outdoor areas. Therefore, the ratio of the indoor air dose rate to outdoor air dose rate, i.e. reduction factor, is used in this paper. If the degree of reduction in the dose rate were the same indoors and outdoors, there would be no change in the dose rate reduction coefficient before and after decontamination. The results are shown in figure 17. The indoor measurements are the average values measured at the centre of each room at a height of 1 m in Houses A and B, and the values measured at the centre of each house at a height of 1 m in Houses C to J. Outdoor measurements are the average values measured at a height of 1 m from the ground around the houses. The reduction factor before and after decontamination was about 0.4, but the reduction factor tended to increase as the dose rate decreased with decontamination.
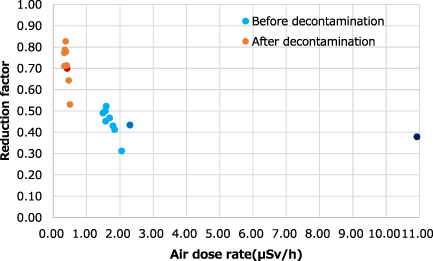
Figure 17. Indoor/outdoor ratios of air dose rates (reduction factors).
Download figure:
Standard image High-resolution imageThe following two factors are regarded as the principal factors affecting the decontamination process. The first is the effect of a gradual change in the dose rate from outdoor to indoor due to expansion of the low-dose area as a result of decontamination. The second reason is that the air dose rate after decontamination approached the natural air dose rate, which was almost constant both indoors and outdoors, and the effect of skyshine, which also has a constant effect both indoors and outdoors, may become relatively more pronounced. It should be noted that the influence of indoor sources may increase the reduction factor, but this is unlikely as explained in section 4.1 and as previously reported [8].
5. Conclusion
Indoor and outdoor air dose rates were measured and simulated for houses located in the vicinity of Fukushima Daiichi Nuclear Power Station. The following facts were found regarding houses which were built with Japanese construction methods, were limited to air dose rates of less than 15 μSv h−1, and simulated based on a simple model.
The dose rate decreases going from a window toward the centre of the house in a horizontal direction. Decontamination not only lowers the dose rate but also reduces dose rate variability. Although dependent on decontamination, it is also largely affected by expansion of the low-dose-rate area.
In the vertical direction, it was clearly confirmed by actual measurement that the dose rate was higher at the ceiling than on the floor and higher on the second floor than on the first floor. The effect of radioactive material infiltration into the soil is one of the main factors. It is estimated from the simulation that the dose rate decreases in the area lower than the first floor, increases at the height of the area where people live, and finally decreases. The effects of other possible factors, such as the surrounding topography and local pollution, will require further verification.
Air dose rates inside a house are affected by the degree of decontamination, house size, and the degree of radioactive material soil penetration. It is important to understand these factors when estimating indoor air dose rates based upon outdoor air dose rates. The prediction of these factors may be useful for estimating conditions and selecting appropriate decontamination methods.
Acknowledgments
The authors would like to express their appreciation to the homeowners who helped with the house measurements.
: Appendix
1. Overview of simulations
The two models considered are:
- A model for understanding the horizontal dose rate, which was set up in order to understand the effects of decontamination.
- A model for understanding the continuous vertical dose rate by simulating ground surface penetration of radioactive materials.
The various conditions of the simulation are based on the following ideas:
- The simulation was based on the Monte Carlo radiation transport code (PHITS ver.3.13[6]), which has been used in previous studies for simulating houses.
- The ground underneath the house was assumed to be non-contaminated, and radioactive materials not to adhere to the roof or walls.
- The target house is wooden and its structural materials not modeled because the shielding effect of key materials, such as floors and walls, is minimal.
- The effect of a dose decrease due to attenuation when gamma rays penetrate the air, dose increase due to build-up effect, and dose increase due to skyshine effect are not included.
- A hypothetical Cs-137 source with an emission energy of 0.662 MeV for a single photon was used.
- The number of iterations of the Monte Carlo method was more than one billion (more than 109), and the statistical accuracy of the results was less than 1%.
2. Models of horizontal direction
A model of the contamination was developed as shown in figure A18 below.
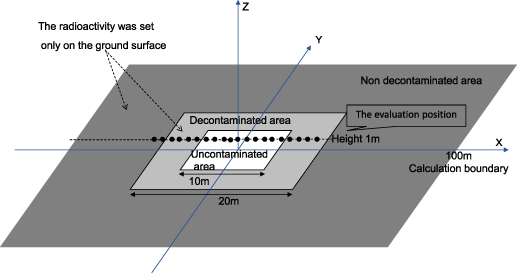
Figure A18. Model for analyzing the horizontal distribution of air dose rates.
Download figure:
Standard image High-resolution imageUncontaminated area: Under the house, 10 m × 10 m square meters. Actual measured areas of the houses (50 square meters and 150 square meters) were used as a reference.
Decontaminated area: Area around the house where decontamination is to be performed. If there is no decontamination at all, the decontamination level is set at 1, and, depending on the degree of decontamination, the decontamination level is set at 1, 0.5, 0.2, 0.1, or 0. The area around the house is 20 m × 20 m square meters (except for uncontaminated area 10 m × 10 m square meters).
Non-decontaminated area: Broader area around the houses that is not decontaminated. 200 m × 200 m square meters around the perimeter of the site.
The radioactivity was defined as being present as a thin source on the ground surface, and the evaluation position of the fluence Φ instead of dose rate was set on the X-axis at the height of 1 meter from the surface.
3. Models of vertical direction
In the height direction, soil penetration of radioactive materials affects distribution. Therefore, the model of soil infiltration of radioactive materials was developed as shown in figure A19.
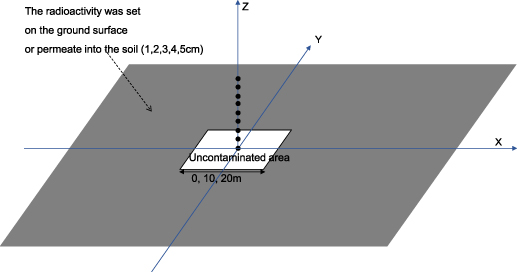
Figure A19. Model for analyzing the vertical distribution of air dose rates.
Download figure:
Standard image High-resolution imageThe contaminated surface spreading over a wide area is 200 m × 200 m square. Three uncontaminated area sizes were set at the center of the contaminated surface.
Area: 0 square meters, 0 m × 0 m
Area: 100 square meters, 10 m × 10 m
Area: 400 square meters, 20 m × 20 m
For the vertical simulation, radioactive materials are considered to have penetrated the soil. Although radioactive materials permeate the soil continuously, this was set to be at discrete depths. Specifically, it was assumed that the contaminated soil is on the surface and at depths of 1, 2, 3, 4, and 5 cm from the surface. The Z value of soil was taken to be equal to that of aluminum (Z = 13), and the density of the soil was set to 1.5 g cm−3. The density of the air was approximated so that there would be no density because the transmission distance between source and evaluation point is less than the mean free path (MFP) in the analysis area.
The simulation points in the vertical direction are set perpendicular to the center of the site.
As for the vertical simulation, the phenomenon is rather complicated. Some simulation results and their interpretations are appended below.
For comparison, figure A20 shows the simulation results for a case where the source is the ground surface. The dose rate (fluence) decreases with increasing distance, i.e. the further away from the radioactive material, the lower the air dose rate. The initial dose rate decreases with the size of the area, i.e. the larger the size of the uncontaminated surface. However, at a certain height, the dose rate (fluence) is almost the same regardless of the size of the uncontaminated surface. This indicates that low dose rates are affected by the uncontaminated area at small heights, but, at larger heights, the dose rates (fluence) are much less affected by the extent of the uncontaminated surface.

Figure A20. Vertical distribution of dose rates (fluence) for surface contamination.
Download figure:
Standard image High-resolution imageNext, the results are shown for a case where radioactive materials permeate the soil. For ease of understanding, figure A21 shows the results for a case where radioactive material is present only at 1 cm below the ground surface.
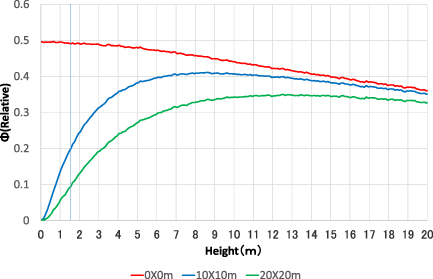
Figure A21. Vertical distribution of dose rates (fluence) for soil contamination at a depth of 1 cm.
Download figure:
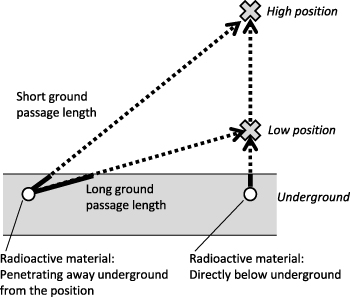
Standard image High-resolution imageWhen the size of the area is 0 square meters, i.e. when there is not any uncontaminated surface, the distance from radioactive material increases with height, and the dose rate (fluence) decreases monotonically as shown in figure A20. However, the effect is different when the non-contaminated surface is at the center. The dose rate starts at a low level and rise to a maximum in relation to height. This is because the radioactive material in the contaminated area surrounding the non-contaminated area is in the ground. Therefore, the radiation transport path is partly through the soil and partly through the air. The dose rate is decreased near the ground because of long oblique transport paths through the soil and increases with height as those paths shorten (see figure A22). This interpretation is also described in a paper by JAEA [18], which explains why the dose rate on the second floor is higher than that on the first floor.
Figure A22. Conceptual image of air dose rate effected of soil infiltration and height.
Download figure:
Standard image High-resolution image
For heights above a certain level, the effect of the transit distance in the soil is smaller and the air dose rate decreases simply because the distance from the radioactive material becomes greater.
Finally, we simulate radioactive materials present on both the surface and in the soil, i.e. general circumstances where there is partial radioactive material penetration.
The degree of soil penetration was set as shown in table A2. This reflects the fact that the depth of contamination was only a few centimeters after the accident and that it permeated vertically over a few years to give an exponential profile [14].
Table A2. Degree of contamination according to soil infiltration depth. (Source intensity at a depth of 5 cm is only a trace amount and therefore given as '0'.)
| Depth | Activity |
|---|---|
| Surface | 0.330 |
| 1 cm | 0.270 |
| 2 cm | 0.200 |
| 3 cm | 0.130 |
| 4 cm | 0.070 |
| 5 cm | 0.000 |
In this paper, figure 16 was prepared from the addition of figures A20 and A21 based on table A2.