

Abstract
After the Fukushima Daiichi nuclear power plant accident in 2011, Iitate village was placed under an evacuation order because the level of radioactive materials drifting from the nuclear plant to the village was above a government-set level for allowing residents to live in the area. The evacuation advisory for most of the village was lifted on 31 March 2017. For displaced residents deciding whether or not to return to their homes, it is important to correctly understand and estimate the realistic individual external doses they will receive after returning to the village. In this study, with the support of residents of the village, we used a personal dosimeter (D-Shuttle) coupled with a global positioning system device to measure and thus understand realistic individual external doses while the residents were in Iitate village and to project the individual external doses for different administrative districts as of 1 April 2017. The measured individual external doses measured by D-Shuttle for 38 study participants showed that the doses measured during time spent inside the village were higher and more widely distributed than the doses measured during time spent outside the village. The exposure ratio (ER) was defined as the ratio of additional individual external dose measured by D-Shuttle to the additional ambient dose based on an airborne monitoring survey. The medians of the average ERs were 0.13 (min–max 0.06–0.27) for time spent at home and 0.18 (min–max 0.08–0.36) for time spent outdoors. Projected additional annual individual external doses as of 1 April 2017 for different administrative districts in the village were calculated using ERs obtained in this study. Assuming that individuals spent 8 h per day on outdoor activities and 16 h on indoor activities, additional annual individual external doses were estimated to be below 3 mSv using the mean of the average ERs for most districts in the village, and these values were well below the individual external doses estimated using the approach taken by the central government. The results of this study provide valuable information both for understanding realistic radiological situations in the village and for those who want to know their future individual external dose in order to make a decision on whether or not to live in the village.
Export citation and abstract BibTeX RIS

Original content from this work may be used under the terms of the Creative Commons Attribution 3.0 licence. Any further distribution of this work must maintain attribution to the author(s) and the title of the work, journal citation and DOI.
1. Introduction
In the days and weeks following the Fukushima Daiichi nuclear power plant (F1NPP) accident resulting from the East Japan earthquake of 11 March 2011, approximately 85 000 people from 12 municipalities were forced to evacuate from areas within a 20 km radius of F1NPP ('Restricted Area') and heavily contaminated areas outside of this zone ('Deliberate Evacuation Area') [1].
At the end of November 2012, the 'Restricted Area' and the 'Deliberate Evacuation Area' were rearranged into three areas (Areas 1, 2 and 3), reflecting the annual cumulative dose [2]. Area 1 encompasses areas for which evacuation orders are ready to be lifted, Area 2 comprises areas in which residents are not permitted to live, and Area 3 contains areas to which residents are unlikely to return for a long time. The Ministry of Environment devised a decontamination plan that would be implemented under the direct supervision of the government and announced the 'Policy for Decontamination of Special Decontamination Areas', which overlaps with the evacuation order areas ('Decontamination Road Map'; January 2012) [3]. As of the end of November 2016, decontamination of the majority of the evacuation order areas was complete, except for Area 3, and the evacuation order for five municipalities had been lifted [4]. The evacuation order for two municipalities (Kawamata town and Iitate village) was to be lifted at the end of March 2017 [4]. However, only a limited number of residents have returned to their original homes in areas for which the evacuation order has been lifted [5, 6], and their reasons for not returning include limited social infrastructure and employment opportunities, and a concern regarding radiological conditions [7].
The village of Iitate is located about 40 km northwest of F1NPP and the population of the village was approximately 6100 in 2010 [8]. The government issued an evacuation order for the entire village after the F1NPP accident because of high radiation levels. Approximately 90% of the population was evacuated from the village to the areas located within a 1 h radius of the village, while approximately 10% of the population was evacuated to outside Fukushima Prefecture [6]. In July 2016, the village offices returned to their functions inside the village and registered residents were allowed to stay long term in the village. It was planned for the village to lift the evacuation order, except in zones where the return of residents is deemed difficult, at the end of March 2017. According to a residents' awareness questionnaire survey conducted by the village, approximately 33% of former residents responded that they currently cannot determine whether or not they would return to the village, approximately 30% were considering returning to the village, and approximately 27% had decided not to return to the village [7]. Approximately 60% of the residents responded that important information that would help them decide whether or not they would return to the village included the likely future radiation situation and the effectiveness of decontamination efforts [7]. This suggested that radiological conditions in the village remain a concern to former residents when deciding whether or not to return to the village.
In order for residents to return to their original residential areas after lifting of the evacuation order it is important to correctly understand and assess realistic individual external doses. Several studies have attempted to use personal dosimeters along with personal diaries or global positioning system (GPS) data to understand realistic individual external doses related to time–activity patterns in Fukushima [9–11]. Our previous studies [10, 11] used a semiconductor silicon personal dosimeter called 'D-Shuttle' (Chiyoda Technol Inc., Tokyo and AIST, Tsukuba, Japan) together with a GPS and geographical information system (GIS) device to understand these external doses and compare them with airborne monitoring-based ambient dose rates, mainly outside the evacuation zones in Fukushima. Only a few attempts have been made to date to measure and assess individual external doses in the evacuation zones, especially in Area 2, in Fukushima [12, 13]. Sakumi et al [12] measured the annual individual external dose to indoor workers in Iitate village and found that the dose for 70% of the workers was estimated to be less than 2 mSv. These studies contributed valuable information towards understanding realistic individual external dose levels and their variabilities in relation to the time–activity patterns of indoor workers for limited areas in Iitate village. However, little attention has been given to obtaining individual external doses applicable to assessing the future individual external doses of people with different time–activity patterns living in different districts of the village after lifting of the evacuation order.
In the current study, we used personal dosimeters (D-Shuttles) along with GPS and GIS to understand the realistic individual external doses in Iitate village, and to estimate the potential individual external doses of residents after returning to the village. This information was based on the relationship between individual external doses, the activity patterns of individuals and the ambient dose based on an airborne monitoring survey.
2. Materials and methods
2.1. Study participants and area
Thirty-eight local residents of Iitate village in Fukushima Prefecture participated in our study. The village remains designated as an Evacuation Advisory Zone, and thus most participants had lived in the village for only a short period of time as temporary registered residents and visiting workers prior to the start of the survey. The locations of their original homes are shown in figure 1. The study was conducted over periods of approximately 5–14 days between September 2015 and May 2016. The airborne monitoring-based ambient dose rates at the homes of the participants ranged from 0.40–4.23 μSv h−1, based on the 10th Airborne Monitoring Survey conducted between 12 September and 4 November 2015 [14].

Figure 1. Study area and locations of the homes of the study participants. In the figure, circles represent the location of the home of each study participant and X is the location of F1NPP. Ambient dose rates are for 4 November 2015 and are based on the 10th Airborne Monitoring Survey conducted between 12 September and 4 November 2015. Maps were created using ArcGIS 10.2.
Download figure:
Standard image High-resolution image2.2. Determination of individual external doses, ambient doses and time–activity patterns
Personal dosimeters incorporating GPS receivers with time–activity diaries and a GIS were used to determine when, where and how much external exposure occurred, based on previous studies [10, 11]. The devices and methods are briefly described below. D-Shuttle dosimeters were used to determine the hourly and total external dose (figure 2). Study participants were instructed to always wear the D-Shuttle on their chest, except when sleeping or bathing, when the D-Shuttle was to be nearby. Each D-Shuttle consists of a silicon semiconductor and can measure total dose in the range 0.1 μSv to 99.9999 mSv. The sensitivity of each D-Shuttle was calibrated with a 137Cs photon source, then tested at the Oharai Research Center, Chiyoda Technol Corporation prior to use. The values measured by D-Shuttle are expressed as personal dose equivalent (Hp(10)). Hp(10) values measured under the conditions of the affected areas in Fukushima are known to be comparable to the effective dose of isotropic (ISO) or rotational (ROT) irradiation geometries [15, 16]. Consequently, we regarded the individual external dose measured by D-Shuttle to be a realistic indicator of the effective dose due to external radiation exposure. Several municipalities in the special decontamination areas in Fukushima provide a D-Shuttle to each resident to measure and help them understand their individual external dose. Moreover, D-Shuttle is recognised as a good communication tool for understanding individual external doses and was used in a study to measure and compare the individual external doses inside and outside Fukushima Prefecture [17].

Figure 2. The 'D-Shuttle' (left) personal dosimeter and 'i-gotU' (right) GPS receiver used in this study.
Download figure:
Standard image High-resolution image
Figure 3. Distributions of individual external dose rates measured by D-Shuttle for time spent inside and outside the village. Individual external dose data for all participants for whom the locations of the measurement sites were identified by GPS or diary information were used for this analysis.
Download figure:
Standard image High-resolution imageThe i-gotU device (GT-600, MobileAction Technology Inc., Taiwan), a commercial GPS receiver with a data logger (figure 2), was used to determine the locations of study volunteers at short time intervals. i-gotU uses an SiRF Star III low-power chipset with WASS (wide area augmentation system) and EGNOS (European Geostationary Navigation Overlay Service) support. In this study, the i-gotU devices were set to record latitude and longitude every 5 s. In addition to GPS, self-reported time–activity and location diary data were used to fill any gaps in the GPS data, and to determine indoor and outdoor positions. The GPS and time–activity diary data were used to determine the locations and activities of the subjects.
The 10th Airborne Monitoring Survey was used to determine the ambient dose [14]. In relating the individual external dose measured by D-Shuttle with the ambient dose determined from the 10th Airborne Monitoring Survey, the values of the ambient dose were adjusted for the study periods by taking into account physical decay. Both the individual external dose measured by D-Shuttle and the ambient dose determined on the basis of the 10th Airborne Monitoring Survey include doses resulting from artificial radionuclides (i.e. 134Cs and 137Cs) and from natural radionuclides. Estimation of the ambient dose for the individual external dose measurement was adjusted for the study period, and the physical decay of artificial radionuclides only was taken into account.
Individual external dose data measured by each D-Shuttle, GPS receiver data with time–activity diaries and ambient dose rate data were collated into a database by matching the associated timestamps from each device, thereby integrating the data into a common array using ESRI ArcGIS 10.2. The collated data were anonymised, then made available for post-processing and analysis. Individual external dose data were used in this analysis, making it possible to locate position and relate the ambient dose data.
2.3. Prediction of individual external doses
The exposure ratio (ER) is defined as the ratio of the additional individual external dose rate to the additional ambient dose rate at the same location, and is expressed as:

where the Individual external dose rate is the personal dose rate measured by D-Shuttle, and the Ambient dose rate is the estimated average ambient dose rate based on the airborne monitoring data for the location where the personal dose data were obtained. PDRbk and ADRbk are the natural background doses for personal dose rate and ambient dose rate, respectively. We used a value of 0.06 μSv h−1 for PDRbk and 0.04 μSv h−1 for ADRbk [11]. The PDRbk value, 0.06 μSv h−1, is the personal dose estimated from natural sources set by Chiyoda Technol Corporation as 0.54 mSv year–1. The ADRbk value, 0.04 μSv h−1, is a national average of ambient dose from natural sources and is the same value as used by the government [18]. The government has designed the decontamination work and the criteria for lifting the evacuation orders on the basis of additional individual external dose estimates using ambient dose levels. Both the individual external dose measured by D-Shuttle and the ambient dose determined based on the 10th Airborne Monitoring Survey include doses resulting from artificial radionuclides (i.e. 134Cs and 137Cs) and from natural radionuclides. In order to be consistent with the existing regulatory approach, we followed the convention of the additional doses resulting from artificial radionuclides in the current study, unless otherwise stated.
Future individual external doses were projected by estimating ERhome and ERoutdoor. ERhome is defined as the ratio of the additional individual external dose rate obtained by staying at home in the village to the additional ambient dose rate based on the airborne monitoring data. ERoutdoor is defined as the ratio of the additional individual external dose rate obtained by staying outdoors in the village to the additional ambient dose rate based on the airborne monitoring data. The average ERhome and ERoutdoor for each study participant were determined and used for estimating annual additional individual external dose.
The central government uses the following formula to estimate the annual additional individual external dose, AAIEDgov (mSv year–1):

where AADR is the additional ambient dose rate in μSv h–1, Tout and Tin are hours spent outdoors and indoors in a day, respectively, and β is the shielding coefficient, which is defined as the ratio of the indoor ambient dose rate to the outdoor ambient dose rate at the same location. AADR is calculated by subtracting the natural background dose, which is assumed to be 0.04 μSv h−1, from the ambient dose rate (μSv h–1). The central government uses 8, 16 and 0.4 for Tout, Tin and β, respectively [18]. Referring to equation (2), we used the following formula to estimate the annual additional individual external dose, AAIEDest (mSv year–1):

where AADRairborne is the additional ambient dose rate (μSv h–1) based on the airborne monitoring survey, and ERoutdoor and ERhome are the exposure ratios for outdoors and in the home, respectively, as defined above. The prospective individual external doses in Iitate village will be calculated from the estimated ambient dose rate on 1 April 2017 determined by considering only the physical decay of 134Cs and 137Cs based on the 10th Airborne Monitoring Survey data. Details of the prospective ambient dose rate calculation are provided elsewhere [19].
Variabilities in the ambient dose rates in the residential areas were taken into account to provide distributions of annual additional individual external doses for different administrative districts in the village. Variabilities in the ambient dose rates were expressed using dwelling locations of the potential inhabitants of Iitate village defined by the 500 m mesh population data from the 2010 population census [20]. The number of data points used to estimate the distributions of the annual additional individual external doses for each administrative district correspond to the population size of Iitate village defined by the 2010 population census [20].
2.4. Ethics
This study was approved by the Committee for Ergonomic Experiments at the National Institute of Advanced Industrial Science and Technology (AIST). Written informed consent was obtained from all subjects prior to conducting the study.
3. Results
3.1. Characteristics of the measured individual external doses
Thirty-one residents participated in the fourth quarter of 2015 and seven in the second quarter of 2016 (table 1). The majority of the participants in the former group were visiting workers whereas the participants in the latter group were registered residents who were staying temporarily. The dosimeters of the 38 participants provided 10 366 individual external dose data points, expressed as μSv h−1. The mean hourly individual external dose measured by D-Shuttle ranged between 0.09 and 0.38 μSv h−1 for all study periods, 0.09 and 0.58 μSv h−1 for time spent inside the village, and 0.08 and 0.16 μSv h−1 for time spent outside the village. Distributions of hourly individual external doses measured by D-Shuttle from study participants for time spent inside the village and for time spent outside the village are presented in figure 3. The median (min–max) of the individual external doses measured by D-Shuttle was 0.19 (0.01–2.43, N = 4046) μSv h−1 for time spent inside the village and 0.09 (0.01–0.63, N = 3268) μSv h−1 for time spent outside the village. Compared with the hourly individual external doses for time spent outside the village, those for time spent inside the village were higher and widely distributed. However, there was much overlap between the distributions. Statistically significant differences were observed for all study participants when individual external doses obtained for time spent inside the village were compared with those for time spent outside the village (data not shown).
Table 1. Study periods, total hours and average individual external doses measured by D-Shuttle for the study participants.
| Mean individual external dose rate (μSv h−1) | |||||
|---|---|---|---|---|---|
| ID | Study period | Total hours (no. of data points) | Total | Time spent inside the village | Time spent outside the village |
| 1 | 14–23 Nov. 2015 | 107 | 0.13 | 0.21 | 0.08 |
| 2 | 14–19 Nov. 2015 | 131 | 0.11 | 0.22 | 0.08 |
| 3 | 14–25 Nov. 2015 | 275 | 0.16 | 0.28 | 0.11 |
| 4 | 17–24 Nov. 2015 | 138 | 0.27 | 0.38 | 0.11 |
| 5 | 20–26 Nov. 2015 | 152 | 0.10 | 0.13 | 0.08 |
| 6 | 13–26 Nov. 2015 | 305 | 0.12 | 0.20 | 0.09 |
| 7 | 14–25 Nov. 2015 | 275 | 0.17 | 0.23 | 0.11 |
| 8 | 17 Nov.–2 Dec. 2015 | 258 | 0.17 | 0.19 | 0.16 |
| 9 | 20–27 Nov. 2015 | 186 | 0.22 | — | 0.11 |
| 10 | 16–30 Nov. 2015 | 258 | 0.17 | 0.14 | 0.12 |
| 11 | 15–26 Nov. 2015 | 282 | 0.17 | 0.26 | 0.10 |
| 12 | 14–19 Nov. 2015 | 130 | 0.22 | 0.53 | 0.15 |
| 13 | 15–27 Nov. 2015 | 282 | 0.38 | 0.28 | 0.07 |
| 14 | 14–27 Nov. 2015 | 330 | 0.18 | 0.23 | 0.09 |
| 15 | 16–28 Nov. 2015 | 312 | 0.12 | 0.27 | 0.07 |
| 16 | 14–28 Nov. 2015 | 354 | 0.32 | 0.26 | 0.11 |
| 17 | 18 Nov.–3 Dec. 2015 | 378 | 0.16 | 0.26 | 0.11 |
| 18 | 17–30 Nov. 2015 | 307 | 0.15 | 0.11 | 0.09 |
| 19 | 18 Nov.–13 Dec. 2015 | 162 | 0.12 | 0.09 | 0.10 |
| 20 | 1–10 Dec. 2015 | 210 | 0.16 | 0.18 | 0.10 |
| 21 | 16 Nov.–13 Dec. 2015 | 186 | 0.15 | 0.25 | 0.12 |
| 22 | 15 Nov.–14 Dec. 2015 | 256 | 0.18 | 0.27 | 0.06 |
| 23 | 15 Nov.–5 Dec. 2015 | 500 | 0.10 | 0.18 | 0.09 |
| 24 | 15 Nov.–4 Dec. 2015 | 474 | 0.14 | 0.25 | 0.09 |
| 25 | 5–13 Dec. 2015 | 210 | 0.18 | 0.45 | 0.08 |
| 26 | 5–13 Dec. 2015 | 210 | 0.21 | 0.58 | 0.09 |
| 27 | 8–17 Dec. 2015 | 234 | 0.14 | 0.17 | 0.08 |
| 28 | 2–17 Dec. 2015 | 378 | 0.16 | 0.30 | 0.12 |
| 29 | 27 Nov.–22 Dec. 2015 | 162 | 0.16 | 0.26 | 0.10 |
| 30 | 27 Oct.–13 Nov. 2015 | 426 | 0.09 | 0.09 | 0.08 |
| 31 | 28 Oct.–26 Nov. 2015 | 714 | 0.10 | 0.11 | 0.09 |
| 32 | 28 Apr.–3 May 2016 | 138 | 0.14 | 0.15 | — |
| 33 | 28 Apr.–5 May 2016 | 183 | 0.24 | 0.46 | 0.14 |
| 34 | 28 Apr.–5 May 2016 | 183 | 0.21 | 0.44 | 0.13 |
| 35 | 27 Apr.–8 May 2016 | 277 | 0.12 | 0.23 | 0.08 |
| 36 | 27 Apr.–9 May 2016 | 291 | 0.15 | 0.22 | 0.09 |
| 37 | 27 Apr.–9 May 2016 | 291 | 0.16 | 0.35 | 0.09 |
| 38 | 28 Apr.–15 May 2016 | 421 | 0.14 | 0.25 | 0.08 |
3.2. Location-specific exposure ratios in the village
The relationships between the average additional individual external dose measured by D-Shuttle and the average additional ambient dose estimated based on the airborne monitoring survey for time spent at home and outdoors in the village are presented in figure 4. Individual external dose data made it possible to locate the position of the participant for that data point and relate the ambient dose data to location in this analysis. We observed a significant positive correlation between the average additional ambient dose and the additional individual external dose for both cases (p < 0.001). The regression line shows that the average additional individual external doses were approximately 0.15 and 0.18 times the average additional ambient doses obtained while at home and while outdoors, respectively.
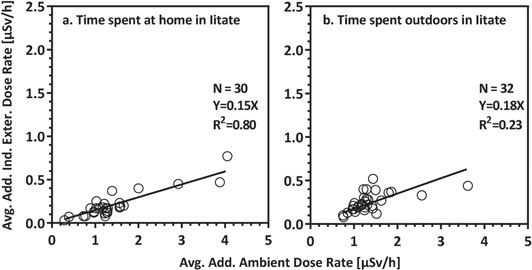
Figure 4. Relationship between average additional individual external dose rate and average additional ambient dose rate for time spent at home and outdoors in the village.
Download figure:
Standard image High-resolution imageThe ER was calculated using the average additional external dose and the average additional ambient dose of each participant. The median values of the average ERs were 0.13 (min–max 0.06–0.27) for time spent at home and 0.18 (min–max 0.08–0.36) for time spent outdoors. The average ERs for time spent outdoors exhibit large variations.
The relationships between the ERs and the average additional ambient dose estimated based on the airborne monitoring survey for time spent at home and outdoors in the village are shown in figure 5. We observed no correlation between the average additional ambient dose and the conversion factor for time spent at home (r = 0.13, p = 0.51) or for time spent outdoors (r = 0.13, p = 0.49).

Figure 5. Relationship between ERs and average additional ambient dose rate for time spent at home and outdoors in the village.
Download figure:
Standard image High-resolution image3.3. Estimation of annual additional individual external doses for 20 administrative districts in the village
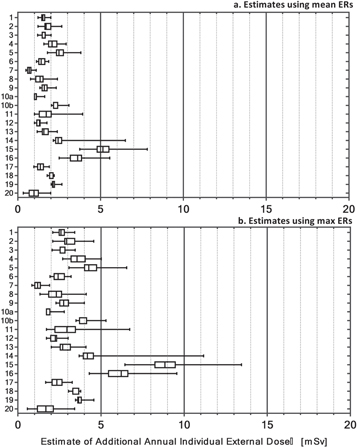
Figures 6(a) and (b) show the annual additional individual external dose, AAIEDest (mSv year–1), projected for 1 April 2017 using the mean and maximum of the average ER values obtained from the estimated ambient dose rates of residential areas for 20 administrative districts in the village. The number of residents in the year 2010 and the airborne-based ambient doses for the locations of homes in each district were incorporated into this estimate. The values of AAIEDest for the majority of the administrative districts were less than 3 mSv using the mean of the average ERs, which is defined by the regression coefficients in figure 4 and 5 mSv using the maximum of the average ERs. Nagadoro district (no. 15) is designated as a 'difficult to return zone' (Area 3) and showed the highest AAIEDest average of 5.3 mSv using mean ERs and 9.0 mSv using maximum ERs. The percentages of AAIEDest exceeding 5 mSv to potential inhabitants were estimated to be approximately 65% for Nagadoro (no. 15), 4% for Hiso (no. 14) and 1% for Warabidaira (no. 16) using mean ERs. Using maximum ERs, the proportions of AAIEDest exceeding 5 mSv to potential inhabitants were estimated to be 100% for Nagadoro (no. 15), approximately 88% for Warabidaira (no. 16), 20% for Hiso (no. 14), 18% for Komiya (no. 5), 7% for Maeta/Yawaki (no. 11), 6% for Iitoimachi (Kuboso) (no. 10b) and 4% for Sekisawa (no. 4).
Figure 6. Estimates of additional annual individual external dose for each administrative district in Iitate village, projected for 1 April 2017. The upper and lower figures show the additional annual individual dose estimated using median and maximum values of ERs. The population density was taken into account to calculate the additional annual individual external doses from ambient dose rates and the distributions of the estimated doses are shown. The numbers on the vertical axes indicate the following districts: 1, Kusano (336); 2, Fukaya (315); 3, Itamizawa (478); 4, Sekisawa (286); 5, Komiya (72); 6, Yagisawa/Ashihara (155); 7, Okura (138); 8, Sasu (242); 9, Miyauchi (314); 10a, Iitoimachi (392); 10b, Iitoimachi(Kuboso) (53); 11, Maeta/Yawaki (345); 12, Okubo/Yosouchi (278); 13, Kamiiitoi (493); 14, Hiso (327); 15, Nagadoro (271); 16, Warabidaira (160); 17, Sekine/Matsuzuka (214); 18, Usuishi (277); 19, Maeda (229); 20, Nimaibashi/Sugaya (242). The numbers in parentheses represent the number of inhabitants determined by the 2010 population census [20].
Download figure:
Standard image High-resolution image
4. Discussion
4.1. Differences between individual external doses inside and outside the village
Overall, individual external doses obtained during time spent inside the village were widely distributed and higher than those obtained outside the village, as the latter areas generally have lower radiation levels. Comparisons between individual external doses measured by D-Shuttle inside and outside Iitate village appeared to show overlaps in these distributions. This can be explained by the activity patterns of individuals while in the village and the effectiveness of decontamination efforts.
Some of the study participants intended to stay inside their home or in well-decontaminated areas while in the village. To date, decontamination of most of the residential areas in the village is complete and in most cases this has efficiently decreased the ambient dose rates, resulting in individual external doses in the village being comparable to those outside the village. However, individual external doses of some of participants were relatively higher while in the village. According to their time–activity diaries, these individuals spent more time in the garden outside their house or in less decontaminated areas.
Our results suggest that, consistent with previous studies [9–11], individual external doses can be attributed to the time–activity patterns and locations of individuals and the ambient dose level (e.g. decontamination conditions) of different locations in the village.
4.2. Variabilities in exposure ratios
For practical reasons, we used the airborne monitoring-based ambient dose rates to calculate exposure ratios (ER). The airborne monitoring data were obtained using high-sensitivity radiation detectors installed on helicopters: second-by-second measurements are taken of gamma rays emitted from radioactive substances deposited in circles with a diameter approximately twice the flight altitude (target altitude 150–300 m) and centred around ground locations directly below the flight trajectory [21]. The airborne monitoring data were considered as the average value of radiation in a circle of radius 300 m on the ground [21]. Therefore, airborne monitoring-based ambient dose rates may be either over- or under-estimates of the actual ambient dose rates measured on the ground near the locations of individuals. According to previous studies, the individual external dose measured by D-Shuttle, expressed as Hp(10) values, in affected areas in Fukushima were comparable with the ISO or ROT irradiation geometries [15, 16]. In addition, the values of Hp(10) were about 0.7 times that of the ambient dose rate, expressed as H*(10), if the measurements were conducted under outdoor field conditions in affected areas in Fukushima [22]. ERs estimated in this study, which ranged from 0.06 to 0.27 for time spent at home and from 0.08 to 0.36 for time spent outdoors, were well below the reported value of 0.7. This discrepancy is due to several factors, such as the effect of decontamination, the behaviour and location of individuals and the shielding effects of buildings. A detailed discussion of this issue can be found elsewhere [11].
Naito et al [11] investigated the relationship between personal dose and ambient dose, mainly in non-evacuation zones of Fukushima. They estimated the mean values of ERs for time spent at home and for time spent outdoors to be 0.16 (min–max 0.03–0.42) and 0.32 (min–max 0.01–0.80), respectively. Comparison with the ERs obtained in this study shows similar values for time spent at home, whereas the current ER values for time spent outdoors were on average about half those reported in the previous study. This may be due to the decrease in ambient dose rates in residential areas resulting from decontamination efforts. The airborne monitoring system did not detect this decrease and thus contributed to measurements of lower individual external dose, which in turn provided relatively lower ER values for time spent outdoors in Iitate village. Furthermore, about half of the study participants were visiting workers and included members of the village security patrol, construction workers and outdoor workers. Individuals in the village security patrol were walking or riding in a car during duty hours and this study considered these duty hours as time spent outdoors in the village. However, a car provides shielding against radiation and thus time spent inside a car will decrease the individual external dose rate. Consequently, the individual external dose data obtained outdoors in the village may be lower than values obtained for time spent in actual outdoor activities.
4.3. Comparisons with annual additional external doses estimated using the government-proposed formula
The central government proposed a simple model that converts the ambient dose rate in μSv h–1 to an annual additional external dose, assuming that 8 h are spent on outdoor activities and 16 h on indoor activities [18]. The model provides a conservative estimate of the annual additional individual external dose that would be received by a 'reference' individual living in an area with a given measured ambient dose rate. This model has been used to determine areas requiring decontamination and evacuation. In a very simple expression, the additional dose from the ambient dose is calculated by multiplying the ambient dose by a conversion factor of 0.6.
Evidence indicates that the true additional dose from external irradiation may be well below the estimated additional dose calculated by this simple model [10, 11, 23–25]. Consistent with the assumption of time occupancy used in the central government model, our results estimated the additional annual individual external dose to be on average 1.0–5.3 mSv using the mean ERs and 1.2–9.0 mSv using the maximum ERs. On the other hand, the additional annual individual dose estimated using the simple model proposed by the central government was on average between 2.4 and 18.1 mSv if the same airborne monitoring data were used.
This suggests that the additional annual individual external doses estimated in our study were approximately 1/4 for the mean ERs and 1/2 for the maximum ERs of those estimated using the simple model proposed by the central government. It is difficult to change the existing approach to regulatory dose assessment. Realistic individual external dose estimations, however, can be an important issue for those considering whether or not to return to their original home after the lifting of an evacuation order.
In the rehabilitation stage, it is important to accurately understand or estimate realistic individual external doses so that individuals can make informed decisions based on radiological protection to return to restricted areas or not. The government has recently stressed the importance of considering individual external dose data collected from personal dosimeters. Accurate information on individual external doses is needed by government policymakers, by people providing advice on health care and radiation dose mitigation, and especially by affected residents. Our results provide valuable information for predicting additional annual external doses following the return of residents to their homes in the evacuation order areas in Fukushima.
In our assessment of additional annual individual external doses, we followed the previous assumption of 8 h of outdoor and 16 h of indoor activities. These fractions of the day spent in each location were reported to be different from actual time fractions [9, 26]. The fraction of time spent outdoors varied widely, and in many cases 8 h is likely to be an over-estimate [26]. If an individual spends most of his or her time indoors, the decrease in time spent outdoors would generally result in a decrease in the annual additional individual external dose. This suggests that understanding the specific time–activity patterns of the daily lives of people in the village would allow the formulation of realistic radiation exposure scenarios, which in turn would lead to an examination of the need for further radiation reduction measures.
4.4. Data needs
In Iitate village, collecting 'Sansai', edible wild plants, and wild mushrooms is an important and traditional seasonal event for many people. The number of people collecting 'Sansai' and mushrooms significantly decreased since the F1DPP incident due to concerns about radiation effects from internal and external doses in Kawauchi village, where the evacuation order was lifted for all areas of the village in 2016. What would be the additional individual external dose obtained when collecting wild plants and mushrooms in the mountains? What is the relationship between ambient dose rate and personal dose rate in non-decontaminated mountains? What is the additional individual external dose when working in agricultural fields in the village? Data to answer these questions are indispensable for improving realistic dose assessment, for understanding radiological conditions and for adopting protective measures for everyday life in the village.
5. Conclusions
We used D-Shuttle personal dosimeters, along with GPS and GIS, to measure and assess individual external doses in the village of Iitate. Although the individual external doses obtained inside the village were higher on average than those obtained outside the village, the former data were widely distributed and there was a large overlap between the distributions of individual external doses obtained inside and outside the village. Our results showed that the magnitude of individual external doses was influenced by the time–activity patterns and locations of individuals in the village.
The ER for time spent outdoors in the village was found to be on average 0.18, which is lower than the value obtained in a previous study. This suggests that decontamination efforts in the village have been effective in reducing ambient dose rates around inhabited areas, which in turn has reduced individual external doses.
Predictions of additional annual individual external dose following the return of residents to their homes in different administrative districts in the village were estimated to range on average between 1.0 and 5.3 mSv using mean ERs and 1.2 and 9.0 mSv using maximum ERs, assuming 8 h of outside activities and 16 h of inside activities. The estimates of additional annual individual external doses in the present study were far lower than the values estimated using the government-proposed approach. The government-proposed approach may have been appropriate in the absence of actual measurement data during the initial stages following the accident. However, in the rehabilitation stage, it is important to understand or estimate realistic individual external doses for those who want to make decisions based on their radiological protection or to return to restricted areas.
The individual external dose is not the sole determinant for deciding whether or not to return to the evacuation zone after lifting of the evacuation order, but is one of the most important factors. The results of the current study provide valuable information for understanding the actual radiological situation in Iitate village, and for those wanting to know their future individual external dose in order to make an informed decision regarding whether or not to live in the village.
Acknowledgments
The authors would like to thank the Iitate residents for collecting valuable data and Mr Kazuhiko Fujii for recruiting participants for this study. This work was supported by JSPS KAKENHI grant number 15H02854 and an AIST strategic fund. The authors would like to thank Chie Yamada for compiling the data and Mr Makoto Miyazaki for useful comments.