

Abstract
Herein, we investigated the pressure dependence of electric transport in a new type of superconducting metal iridate compound, SrIr2, that exhibits a superconducting transition temperature, Tc, as high as 6.6 K at ambient pressure, in order to complete the Tc—pressure (p ) phase diagram. Very recently, this sample's superconductivity was discovered by our group, but the superconducting behavior has not yet been clarified under pressure. In this study, we fully investigated this sample's superconductivity in a wide pressure range. The Tc value decreased with an increase in pressure, but the onset superconducting transition temperature,  , increased above a pressure of 8 GPa, indicating an unconventional superconductivity different from a BCS-type superconductor. The magnetic field dependence of electric resistance (R) against temperature (R − T plot) recorded at 7.94 and 11.3 GPa suggested an unconventional superconductivity, followed by a p -wave polar model, supporting the deviation from a simple s-wave pairing. Moreover, we fully investigated the pressure dependence of crystal structure in SrIr2 and discussed the correlation between superconductivity and crystal structure. This is the first systematic study on superconducting behavior of a new type of metal iridate compound, MIr2 (M: alkali-earth metal atom), under pressure.
Export citation and abstract BibTeX RIS
1. Introduction
Iridium (Ir) is a 5d transition metal atom (5d TM), and compounds based on 5d TM have attracted significant attention owing to the obvious contribution of electron correlation and spin–orbit coupling (SOC) to the physical properties. In particular, the SOC of a 5d TM is larger by an order of magnitude than that of a 3d transition metal atom (3d TM). Therefore, it is a natural way to envision a new type of superconductor that would be mediated by the interplay of strong SOC and Coulomb repulsion U (or electron correlation). In fact, the strong SOC in 5d TM produces a new rule to express electronic states in terms of total angular momentum J, in which spin and orbital are coupled, i.e spin and orbital cannot be distinguished. Such an electronic state defined by J (J-defined electronic state) is evidenced in Sr2IrO4 [1].
Furthermore, several Ir-based compounds have been investigated since the proposal of a spin–orbit Mott state in Sr2IrO4 [1]. Subsequently, resonant inelastic x-ray scattering demonstrated that magnetic dispersion was well expressed by the antiferromagnetic (AF) Heisenberg model with a superexchange interaction in the square lattice [2]. Thus, the analogy of AF ground state and the crystal lattice between Sr2IrO4 and cuprates have motivated the research on superconductivity through carrier doping of Sr2IrO4. Recent studies of angle resolved photoemission spectroscopy of Sr2-xLaxIrO4 indicated the emergence of in-gap states with increasing x value to 0.08 [3]. A decrease in both the magnetic transition temperature, TN and electrical resistance, R, were observed from the temperature dependence of magnetic susceptibility and R of Sr2−xLaxIrO4, respectively, with increasing x value from 0 to 0.2 [4]. These results may serve as evidence for insulator–metal transition, and superconductivity is expected with the increased x value. Thus, pursuing the superconductivity in Sr2IrO4 is both fascinating and challenging at the present time.
Unlike Sr2IrO4, some Ir-based compounds are well known to be superconductors [5–10]. For instance, the compounds IrGe [6], Li2IrSi3 [9, 10], and Mg10Ir19Br16 [11], are superconductors with Tc values as high as 4.7, 3.7, and 4.45 K, respectively. Moreover, a superconductivity through the breaking of Ir–Ir bond formed in Ir1−xPtxTe2 was recently discovered, i.e. a superconductivity with Tc = 3.1 K emerged at x = 0.035 [12]. Recent topics of superconductivity in Ir-based compounds include the discovery of a superconducting phase in CaIr2 [13] that indicated a Tc as high as 5.8 K; CaIr2 is a new type of metal iridate superconductor, i.e. MIr2-type superconductor (M: alkali-earth metal atom). This compound was indicated to be a weakly coupled BCS superconductors [13]. Subsequently, the superconductivity was discovered in SrIr2 by Horie et al in which a Tc value as high as 5.8 K was reported [14]. Both the Tc values of CaIr2 and SrIr2 are the same. These MIr2-type compounds are bulk superconductors with the shielding fraction of 100% at 2.0–2.5 K. In addition, the study on the superconductivity of BaIr2 is currently in progress [15].
Herein, we report the pressure dependence of superconductivity in MIr2-type compound, SrIr2, which provides a Tc as high as 6.6 K at 0 GPa. The investigation was done at a pressure in range of 0–17.4 GPa, and the results indicated a negative pressure dependence of Tc; however, the onset superconducting transition temperature,  , increased with the increase in pressure above 8 GPa, which could be an interesting behavior. The magnetic field (H) dependence shown in R − T plots at high pressures suggested the unconventional superconductivity for SrIr2. Moreover, the pressure dependence of the crystal structure of SrIr2 was fully investigated through powder x-ray diffraction (XRD) measurement using synchrotron radiation at 0–22.4 GPa. Finally, we discuss the correlation between superconductivity and crystal structure in SrIr2. This is the first systematic study on the pressure dependence of superconductivity in a new type of metal iridate compound, MIr2.
2. Experimental
SrIr2 was prepared by a high-temperature reaction of Sr and Ir. The fine powders of Sr and Ir were mixed and pelletized for the reaction. To produce extremely fine Sr powder, Sr polycrystalline powder was dissolved in liquid ammonia (NH3) for 2 d, and NH3 was removed by dynamic pumping at 293–373 K for 8 h. Meanwhile, Ir was sufficiently ground for producing fine powder. Figure 1(a) shows the schematic representation of the reaction process.

Figure 1. (a) Schematic representation of preparation of SrIr2. (b) M/H − T plot for sample A of SrIr2 recorded at ambient pressure. XRD patterns for sample A of SrIr2 are recoded at ambient pressure, together with the patterns calculated by (c) LeBail analysis and (d) Rietveld refinement. The XRD patterns were measured with Cu Kα x-ray beam (λ = 1.5418 Å) using conventional XRD measurement system (see text).
Download figure:
Standard image High-resolution imageXRD and magnetic susceptibility (M/H) at 0 GPa were recorded to verify the formation of SrIr2; M and H refer to magnetization and applied magnetic field, respectively. The XRD measurement was performed using a powder x-ray diffractometer (RIGAKU Smart Lab-Pro) with Cu Kα radiation (wavelength λ = 1.5418 Å), while the M/H measurement was performed using the SQUID magnetometer (Quantum Design: Magnetic Properties Measurement System 2 (MPMS2)).
Pressure-dependent XRD patterns of SrIr2 were measured at 297 K, using synchrotron radiation at BL12B2 of SPring-8; the wavelength λ of the x-ray beam was 0.688 669 Å. A diamond anvil cell (DAC) was used for the high-pressure XRD measurement; the sample was loaded into the hole of an SUS plate. Pressure medium daphne 7373 was used for the XRD measurement under high pressure. The pressure was determined by monitoring ruby fluorescence.
The temperature dependence of electric resistance, R, of SrIr2 was measured using a DAC for R measurement, and the sample was set in an Ar-filled glove box because the sample was highly air sensitive. The polycrystalline sample was loaded directly on a Kapton sheet/epoxy resin/rhenium in the DAC; six Cu electrodes were attached to the Kapton sheet. NaCl was used as the pressure medium to obtain the static pressure. The electrodes were contacted to the sample by pressing the sample to the electrodes, and the good contact between the electrodes and SrIr2 sample was obtained even at 0.41 GPa, as evidenced by metallic behavior at normal state shown in section 3.2. The applied pressure was determined by monitoring ruby fluorescence.
The R was recorded at 290–1.5 K in a standard four-terminal measurement mode using an Oxford superconducting magnet system. The temperature was controlled using an Oxford Instruments MercuryiTC. The H was controlled using Oxford Instruments MercuryiPS. An electric current (I) was supplied by the Keithley 220 programmable current source, and the exact value of I was monitored by the Advantest R-8240 digital electrometer. The voltage (V) was measured by the Agilent 34420 digital nanovoltmeter.
Finally, we briefly comment on hydrostaticity of daphne 7373 and NaCl employed as pressure media in this study. In case of daphne 7373, the hydrostatic pressure is guaranteed up to 2.4 GPa [16], while NaCl generally guarantees the hydrostatic pressure up to 25–30 GPa, exactly saying quasi-hydrostatic pressure [17, 18]. These problems are discussed in sections 3.2 and 3.4.
3. Results and discussion
3.1. Characterization of superconducting SrIr2
Figure 1(b) shows the temperature (T) dependence of magnetic susceptibility (M/H) of SrIr2 in zero field cooling (ZFC) and field cooling (FC) modes at 0 GPa. The values of Tc for SrIr2 was determined to be 6.6 K from the M/H − T plot at ZFC mode. The shielding fraction of SrIr2 was 100% at 2.0 K, indicating that SrIr2 is a bulk superconductor. A significant diamagnetic transition was observed even in the M/H − T plot in FC mode. The result also supports bulk superconductivity.
The XRD patterns of SrIr2 at 0 GPa are shown in figures 1(c) and (d). As shown in figure 1(c), the XRD pattern of SrIr2 was well analyzed by LeBail fitting with the space group of Fd m (No. 227, choice 2) [19], and is called the 'MgCu2 type structure'. The lattice constant a was determined to be 7.7968(1) Å. The value of a for SrIr2 is the same as those (7.545 Å for CaIr2 and 7.70 Å for SrIr2) [19] reported previously for MIr2, indicating that the SrIr2 is exactly formed. The XRD pattern of SrIr2 was analyzed by Rietveld refinement using the same space group, as shown in figure 1(d). Table 1 lists the atomic coordinates of SrIr2; Sr and Ir atoms occupy the special sites of 3/8,3/8,3/8 and 0,0,0, respectively. In the Rietveld refinement, the Debye Waller factor, Uiso, for the atoms were fixed as 0.0125 Å2, and the lattice constant, a, was refined. The a for SrIr2 was 7.7826(1) Å, and is the same as that (a = 7.7968(1) Å) determined for SrIr2 by LeBail fitting. The crystal structure of SrIr2 is shown in figure S1 in supplementary material (stacks.iop.org/JPhysCM/32/025704/mmedia).
Table 1. Atomic coordinate of SrIr2. The crystal structure is face-centered cubic ( ; No. 227).
| Atom | Site | Occupancy | x | y | z | B (Å2) |
|---|---|---|---|---|---|---|
| Ir | 16c | 1.0 | 0 | 0 | 0 | 0.9870 |
| Sr | 8b | 1.0 |  |
 |
 |
0.9870 |
3.2. Temperature dependence of electric resistance under pressure, and pressure dependence of superconductivity
The R R(10 K) − T plots of two different SrIr2 samples (samples A and B) are shown in figures 2(a) and (b), respectively. Both samples A and B of SrIr2 indicated the same Tc (=6.6 K) and 100% shielding fraction at 2 K at ambient pressure. A clear superconducting transition was observed for SrIr2 in a pressure range of 0 to 17.4 GPa; zero R was unambiguously confirmed. The Tc values of SrIr2 at 0.78 and 17.4 GPa were determined to be 5.80 and 4.72 K, respectively, from the R/R(10 K) − T plots shown in figure 2(b); the Tc is defined as the temperature that is half the value of R in the normal state, as shown in figure S2(a). A zero R was clearly observed below Tc, and the decrease in R is sharp in all pressure range, suggesting a homogenous superconductivity. A metallic behavior in the normal state above Tc is observed for SrIr2 in all pressure range, as shown in figure 2(c). Specifically, a broad convex shape in the R/R(280 K) − T plot is observed, indicating a weak localization of carriers [20, 21]. Here, we briefly discuss the residual R ratio, RRR (=R(room temperature)/R(minimum temperature)). The RRR value of sample A of SrIr2 was 2.2 at 7.94 GPa, indicating the presence of defects such as impurities and grain boundaries. The values of R(280 K) and R(7 K) of sample A at 7.94 GPa were taken as R(room temperature) and R(minimum), respectively. The RRR value of 2.2 implies small mean free path in normal state, small coherence length ξ, and type-II superconductivity. In addition, such a small RRR for normal metallic state indicates effectively strong electronic scattering that would be explained by defects or disorder (structural, magnetic, etc...), leading to a short mean free path. In the case of superconductors, the above nature will lead to 'dirty limit' features, which means a small coherence length and type II superconductivity.

Figure 2. R/R(10 K) − T plots for (a) sample A and (b) sample B of SrIr2 at different pressures (temperature T = 0–10 K). (c) R/R(280 K) − T plots for sample A of SrIr2 at different pressures (temperature T = 0–280 K).
Download figure:
Standard image High-resolution imageThe plots of onset Tc ( ), Tc, and the temperature indicating zero R (
 ) for sample A of SrIr2 are plotted against pressure (figure 3(a)). The Tc − p and
  − p plots become almost constant above 7–8 GPa. In fact, Tc appears to exhibit a slight upward turn above ~7 GPa, although this is still unclear because of the limited data. However, if this is true, the upward turn is an interesting behavior because it is unexpected of a BCS-type superconductor.
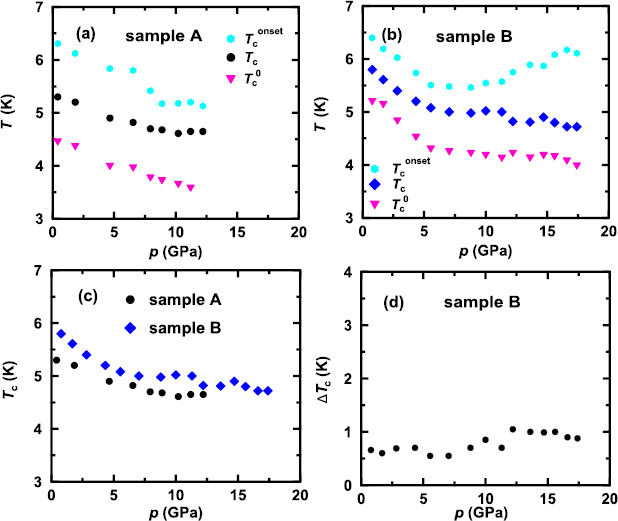
Figure 3. Plots of  − p , Tc − p , and
  − p for (a) sample A and (b) sample B of SrIr2. (c) Tc − p plots for samples A and B of SrIr2. (d) ΔTc − p plot of sample B.
Download figure:
Standard image High-resolution imageMoreover, to confirm the reliability of the plots shown in figure 3(a), the plots of  , Tc, and
  for sample B of SrIr2 are plotted against pressure (figure 3(b)). From the plots,
  unambiguously exhibited an upward turn above 7–8 GPa; however, the upward turn was not clearly confirmed for the plots of Tc − p and
  − p . The Tc − p plots for both samples A and B of SrIr2 shown in figure 3(c) have been found to be similar. However, the Tc for sample A is lower by ~0.25 K compared to that for sample B for the entire pressure range, indicating a degree of experimental error of Tc in this study. The Tc value becomes almost constant above ~7 GPa for both samples A and B (figure 3(c)), after a rapid decrease in a low pressure range. To summarize, the upward turn of Tc or
  against pressure appears to start at approximately 7–10 GPa for both samples of SrIr2.
To check if the increase in  above ~7 GPa (figure 3(b)) originates from intrinsic nature of SrIr2, the superconducting transition width, ΔTc (=T(90%) − T(10%)), for the sample B, where T(90%) and T(10%) refer to the temperature providing 90% and 10% of resistance at normal state just above superconducting transition. The plot is shown in figure 3(d), showing the increase in ΔTc above 7 GPa. This behavior is somewhat similar to the increase in
  , but as described in experimental section, the hydrostaticity should be still maintained even above 7 GPa because NaCl employed as pressure medium guarantees the quasi-hydrostatic pressure up to 25–30 GPa [17, 18].
In addition, the variation of  above ~7 GPa is larger than that of ΔTc. As seen from figure 3(b), the Tc and
  became almost constant above ~7 GPa. These results seem to suggest the intrinsic change of electronic structure of SrIr2, but the possibility of apparent variation of
  caused by non-hydrostatic pressure (inhomogeneity of pressure) also needs to be considered at the present stage. If the observed phenomenon does not originate from the inhomogeneity of pressure, but it reflects a physical feature characteristic of SrIr2, the mechanism of increasing Tc by applying pressure must be fully discussed, which will be described later. Finally, we may point out the possibility that the
  may be sensitive to the change of electronic structure caused by pressure, in comparison with the Tc and
  , because the
  should reflect even filamentous superconductivity.
3.3. Magnetic field dependence of R − T plots under pressure
Figure 4(a) shows the R − T plots of sample A of SrIr2 under an H of 0–5.0 T recorded at 7.94 GPa, which indicates that the decrease in R is clearly suppressed with increasing H, thereby assuring that it can be assigned to a superconducting transition. The plot of Hc2 − Tc at 7.94 GPa (figure 4(b)) shows a linear relationship; Hc2 at 0 K (Hc2(0)) was evaluated to be 6.7 T and was still lower than the Pauli limit  (=1.86Tc), i.e.
  = 8.7 T. In this Hc2 − Tc plot, the temperature providing 50% of normal-state resistance at each H is employed as the Tc. The values of the reduced critical field,
 ![${{h}^{*}}\left( T \right)={}^{\left[ \frac{{{H}_{{\rm c2}}}(T)}{{{T}_{{\rm c}}}} \right]}\diagup{}_{{{\left[ -\frac{{\rm d}{{H}_{{\rm c}2}}(T)}{{\rm d}T} \right]}_{T={{T}_{{\rm c}}}}}} =~\frac{{{H}_{{\rm c}2}}(T)}{{{T}_{{\rm c}}}\times {{\left[ -\frac{{\rm d}{{H}_{{\rm c}2}}(T)}{{\rm d}T} \right]}_{T={{T}_{{\rm c}}}}}}=\frac{{{H}_{{\rm c}2}}(T)}{{{H}_{{\rm c}2}}(0)}$](https://content.cld.iop.org/journals/0953-8984/32/2/025704/revision2/cmab4605ieqn028.gif) , of SrIr2 at 7.94 GPa were plotted as a function of t (
, of SrIr2 at 7.94 GPa were plotted as a function of t (
 , which are shown in figure 4(c); the Hc2(0) of SrIr2 at 7.94 GPa is larger than that, 4 T, of CaIr2 at ambient pressure [13].

Figure 4. (a) R − T plots of sample A of SrIr2 under 0–5.0 T at 7.94 GPa. (b) Hc2 − Tc plot and (c) h* − t plot of sample A of SrIr2 at 7.94 GPa. (d) h* − t plot of sample B of SrIr2 at 11.3 GPa.
Download figure:
Standard image High-resolution imageThe h*(t) − t plot (figure 4(c)) for sample A of SrIr2 at 7.94 GPa was drawn based on the data shown in figure 4(a). We attempted to fit the plot using three different models, i.e. the Werthamer–Helfand–Hohenberg (WHH) theory that corresponds to the s-wave dirty limit superconductivity [22, 23]. The WHH theory predicts h*(0) = 0.69 at t = 0, but the experimental h*(0) does not reach the value. The experimental h*(t) − t plot was well followed by the p -wave polar model (see figure 4(c)). Moreover, the theoretical curve of the s-wave clean limit was not the same as the experimental h* − t plot. The h*(0) value should typically be in the range of 0.80–0.85 for the p -wave polar model [24–28].
To confirm the validity of the above h*(t) − t plot, we investigated the H dependence of R − T plots of sample B of SrIr2 at 11.3 GPa (figure S2(b) in supplementary material). The Hc2 − Tc plot is shown in figure S2(c). The Hc2(0) value was evaluated to be 10.0 T from the linear relationship of the Hc2 − Tc plot. The h* − t plot (figure 4(d)) is well fitted by the p -wave polar model, similar to that for sample A of SrIr2 at 7.94 GPa, supporting the deviation from the simple s-wave pairing.
In the previous section, we suggested the dirty limit feature from the small RRR for normal metallic state. In fact, the p -wave superconducting pairing or the deviation from s-wave pairing was indicated from the h* – t plots (figures 4(c) and (d)). These results may imply that SrIr2 has both natures of the dirty limit feature and deviation from the s-wave. Thus, the pairing mechanism of SrIr2 may not be simple, although a previous study suggested that superconducting CaIr2 was categorized as a weak coupled BCS-type superconductor [13]. The other experiments such as Knight shift and angle resolved photoemission spectroscopy (ARPES) may be required for the final determination of superconducting pairing symmetry.
3.4. Pressure dependence of structure determined from XRD pattern
Figure 5(a) shows the XRD patterns of SrIr2 under pressure (0–22.4 GPa) at 297 K; it indicates that all patterns can be analyzed with the space group of Fd m, similarly as the XRD pattern at 0 GPa (figure 1). No structural phase transitions are observed at 0–22.4 GPa. The XRD patterns were analyzed by Rietveld refinement, and these patterns at 9.56 and 22.4 GPa are shown in figures 5(b) and (c), respectively, together with the patterns fitted by Rietveld refinement. In the Rietveld analysis for XRD patterns under pressure, the a was refined and the Uiso was fixed. As shown in figure 6(a), the a value decreases with increasing pressure. All XRD patterns indicated the presence of Ir metal at less than 10%. The fraction (10% of Ir and 90% of SrIr2) did not change with applied pressure, and the presence of unknown impurities is suggested; peaks due to unknown impurities are indicated by an asterisk (figure 5(a)). As a matter of fact, Rietveld refinement was achieved considering the presence of two phases (main phase of SrIr2 and minor phase of Ir). Here, it is noteworthy that this sample is different from that employed for the XRD measurement at 0 GPa (figures 1(c) and (d)). The SrIr2 sample employed for pressure-dependent XRD measurement is categorized as 'sample C', which exhibited 100% shielding fraction at 2 K, with the Tc value being as high as 5.8 K, as confirmed from the M/H − T plot (not shown).
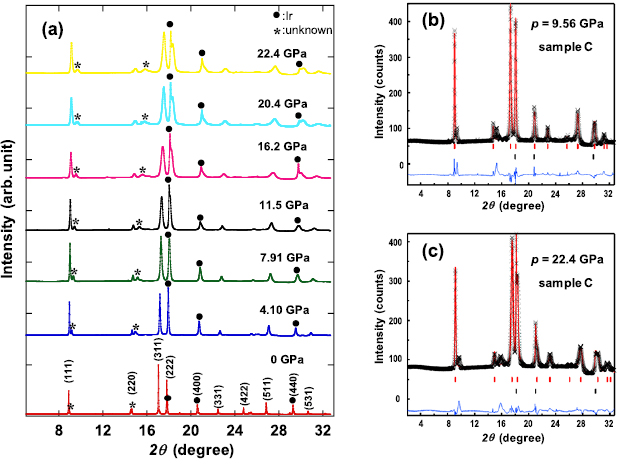
Figure 5. (a) XRD patterns of sample C of SrIr2 recorded at different pressures. (b) XRD patterns of sample C of SrIr2 at 9.56 and 22.4 GPa. In (b) and (c), the patterns calculated by Rietveld refinement are shown.
Download figure:
Standard image High-resolution image
Figure 6. Plots of (a) a − p and (b) p − V of sample C of SrIr2. In (a), the solid line is an eye guide. In (b), the solid line is drawn by the Birch–Murnaghan model. (c) Plots of  − V, Tc − V, and
  − V of SrIr2 obtained from the plots of
  (Tc and
  ) − p in (b) and p − V in figure 3(b).
Download figure:
Standard image High-resolution image
Moreover, we must comment on the hydrostaticity of sample at each pressure. The daphne 7373 was used as pressure medium for XRD measurement, which guarantees the good hydrostatic pressure up to 2.4 GPa [16]. Therefore, the broadened peaks may be observed in the XRD patterns above 2.4 GPa. Actually, the XRD peaks broaden with increasing pressure. The Rietveld refinement for the XRD pattern was successfully performed at 0–22.4 GPa, and the estimated standard deviation (esd) of lattice constant, a, determined was too small, implying the negligible pressure-inhomogeneity in discussing the crystal structure, i.e. the reliable lattice parameters were obtained from the XRD patterns at 0–22.4 GPa.
The p − V plot (figure 6(b)) was well fitted using the Birch–Murnaghan formula [29]; the values of V at 0 GPa (V0), bulk modulus (K0) at 0 GPa, and derivative of K0 (K') are evaluated using least-squares fitting. No anomaly was observed in the a − p and p − V plots (figures 6(a) and (b), respectively). The a and V values decrease monotonously even at ~8 GPa, in which Tc indicated an upward turn with pressure. The plots of  − V, Tc − V and
  − V are provided in figure 6(c), showing that the upward turn of
  occurs at ~440 Å3 (7–8 GPa), in which any significant variation of V are not observed. This implies that the suggested anomaly in the Tc − p plot of SrIr2 does not originate from structural transition.
Recently, the upward turn of Tc against pressure was recorded for metal-doped FeSe ((NH3)y MxFeSe) prepared by the liquid NH3 method [30–32]. In this case, it was found that the electron density exhibited a sudden increase above the pressure, thus leading to an upward turn [31], as observed from the Hall effect measurement. This result was associated with the variation in the Fermi surface (Lifshitz transition). We have not yet performed Hall effect measurements under pressure because of the polycrystalline powder sample. Therefore, it was still unclear if the suggested Tc enhancement was associated with the variation in the electronic structure (variation in the density of states on the Fermi level). This is the future task.
4. Conclusion
The pressure dependence of superconductivity in a new iridate superconductor, SrIr2 was confirmed in this study. The Tc − p plot decreased with an increase in pressure (negative pressure effect of Tc); however, the  and Tc indicated an upward turn against pressure above 7–8 GPa. In particular, an increase in
  against pressure for sample B above 8 GPa was clearly observed. This behavior may be significant if it was the intrinsic nature of SrIr2. It is noteworthy that the Tc becomes almost constant or slightly increases at high pressure. The crystal structure did not change in the pressure range of 0 to 22.4 GPa but demonstrated a monotonous decrease in a and V with the increased pressure. Specifically, no significant anomaly was observed for the a − p and p − V plots. This implied that the variation in the behavior of the Tc − p plot in the high-pressure range was not associated with structural change. Moreover, the H dependence of Tc recorded at high pressures for SrIr2 suggested that the pairing was not explained by a simple s-wave conventional superconductivity. Thus, through this study, some interesting results from the physical perspective were observed for SrIr2, although most of them could not simply be explained in this study. This is the first systematic study on the superconductivity and crystal structure of MIr2 and would be the first step in the thorough understanding of 5d TM-based superconductors. Namely, the further study on MIr2-type superconductor must lead to the fruitful physics in 5d TM-based superconductors mediated by the interplay of strong SOC and Coulomb repulsion U.
Acknowledgments
The authors are grateful to Ms Saki Nishiyama and Mr Takahiro Terao for their kind assistance in the preparation of sample and XRD measurement under pressure, and would like to appreciate Dr Yasuhiro Takabayashi of Tohoku University for his valuable suggestion for the Rietveld refinement of XRD patterns at 0 GPa. This study was partly supported by Grants-in-Aid (26105004, 15K21732, 17K05500, 18K03540, 18K04940, 18K18736, and 19H02676) from MEXT, JST ACT-C Grant Number JPMJCR12YW, Japan, and by the Program for Promoting the Enhancement of Research Universities. The XRD measurements at SPring-8 were performed under the proposals of 2017A4138, 2017B4133, and 2018A4132.
Conflicts-of-interests
There are no conflicts to declare.
Author contributions
YK planed and supervised this study under discussion with XF, HG, RE, RH, KH, KK and JA. HL and RH synthesized the polycrystalline powder samples of SrIr2 under collaboration with XF and YW. XF performed the measurement of electric resistance under pressure, and analyzed all of data under discussion with YK. TH, TT, HG assisted measurement of temperature dependence of electric resistance under pressure. HG managed equipment for the measurement of temperature dependence of electric resistance under pressure. HI, YFL, HY performed the equipment setup for measurement of XRD under pressure using synchrotron radiation, and the XRD measurement under pressure was done by XF, TH, HG, HI, YFL, HY and YK. KH carried out Rietveld refinement for all XRD patterns under pressure. The paper was prepared by YK and XF under the discussion with HG, RE, RH, KH, KK, and JA.