

Abstract
The substitution of Mn for Fe on the sub-lattice in LaFeAsO has a remarkable impact on both structural and magnetic properties; for example, the structural and magnetic transition temperatures decrease of ~20 K in samples with a Mn-content as low as x = 0.01. Such a dramatic effect results from the high stability of the substituting Mn2+ ion (3d5) in its high-spin state, which opposes any variation to its electronic state (configuration), perturbing thereby interactions within the Fe sub-lattice between the Fe ions surrounding the substituent. Several investigations ascertained that the structural transformation in LnFeAsO compounds (Ln: lanthanide) cannot be ascribed to lattice degrees of freedom, but rather to electronic or spin ones. In this context, even an extremely low concentration of Mn2+ ions diluted in the Fe sub-lattice produces a reduction of the electronic degree of freedom of the system, thus hindering the structural transformation and the magnetic transition.
Export citation and abstract BibTeX RIS
1. Introduction
In the last decade, systematic studies invested the class of compounds referred to as Fe-based superconductors, not only for what concerns their superconductive properties, but also for the delicate and tangled interplay between magnetism, superconductivity, structure and crystallo-chemistry. One of the most studied family is the LnFeAsO (Ln = lanthanide) [1]. The origin of the tetragonal to orthorhombic P4/nmm → Cmme structural transformation taking place at Ts ~ 150 K in these compounds and its relationship with the magnetic ordering established at Tm < Ts is one of the main debated issues [2, 3]. Lattice degrees of freedom cannot drive the transformations, since no symmetry-breaking soft mode condensing a collective atomic displacement is active in this transition [4]. As a consequence, the origin of this transformation should involve electronic degrees of freedom: charge, orbital or spin ordering. Most credited scenarios foresee (i) an orbital ordering mechanism [5–7] that drives the structural transition and induces magnetic anisotropy, thus triggering the magnetic transition, or alternatively (ii) magnetic fluctuations [8] inducing spin ordering, thus driving the structural transformation. Chemical substitution is one of the most effective methods that can be applied to modify and disentangle the structural and magnetic properties. For example Tm and Ts progressively decrease by similar amounts by increasing the chemical pressure with Y-substitution in the (La1−xYx)FeAsO system [9, 10]. For the isolectronic Ru-substitution at the Fe site [11–13] a different behaviour is observed; in the La(Fe1−xRux)AsO system the long-range ordered magnetism occurs within the orthorhombic phase, whereas short-range magnetism appears to be confined within the structural strained regions of the tetragonal phase [14].
Among all the different types of chemical substitution examined in LnFeAsO compounds, the optimally electron-doped La(Fe1−xMnx)As(O0.89F0.11) system stands out for its peculiar behaviour. In fact, an anomalously huge and unexplained suppression of superconductivity by Mn-substitution as small as x ~ 0.2% characterizes this system, whereas static magnetism is recovered for x ~ 0.1% [15, 16] (notably, the recovery of magnetism is coupled with the reestablishment of the orthorhombic structure [17]). This behaviour recalls the anomalous suppression of superconductivity accompanied by a recovery of magnetism observed in the (La2−xBax)CuO4 system for a hole concentration corresponding to x ~ 1/8; remarkably, in this and other similar systems a static charge density wave appears, which is associated with the suppression of superconductivity and stems from the pinning of dynamical charge density waves [18–20]. For this reason, we focused our attention on the Mn-substituted LaFeAsO system in order to investigate the possibility that the physics of Fe-based superconductors could involve also the charge density wave state, among all the other components. As a result, we recently detected the development of a static incommensurate modulated structure across the low-temperature orthorhombic phase in the La(Fe1−xMnx)AsO system, revealing a possible major role of charge ordering also in Fe-based materials [21].
In this paper we report a neutron powder diffraction investigation of the La(Fe1−xMnx)AsO system, carried out in order to determine the evolution and interplay of the crystal and magnetic structures as a function of the Mn content.
2. Experimental
Polycrystalline La(Fe1−xMnx)AsO (0.00 ⩽ x ⩽ 0.08) samples were prepared reacting stoichiometric amounts of pre-synthesized LaAs with high purity Fe2O3, MnO2, Fe in evacuated silica tubes, as described in [22].
Neutron powder diffraction (NPD) measurements were carried out at the Institute Laue Langevin in Grenoble (F). High-resolution NPD patterns were collected on selected samples (x = 0.01, 0.02, 0.03, 0.04, 0.06, 0.08) between 10 and 150 K using the D2B diffractometer (λ = 1.596 Å). Neutron thermo-diffractograms were collected using the high-intensity D20 diffractometer (λ = 2.410 Å) between 10 and 175 K on samples with x = 0.01, 0.02, 0.03, 0.04.
Structural refinement was carried out according to the Rietveld method [23] using the program Fullprof [24]; refinements were carried out using a file describing the instrumental resolution function. In the final cycle of refinement using the D20 data, the refined parameters were: the scale factor; the background; the zero point of the detector; the unit cell parameters; the atomic site coordinates not constrained by symmetry; the overall isotropic displacement parameter; the Lorentzian isotropic strain parameter; the coefficients of the linear combinations of basis functions (magnetic moment components). For the D2B data, the following parameters were refined: the scale factor; the background; the zero point of the detector; the unit cell parameters; the atomic site coordinates not constrained by symmetry; the atomic displacement parameters; the anisotropic strain parameters. The micro-structure was investigated by using the refined anisotropic strain parameters and analysing the broadening of diffraction lines by means of the Williamson–Hall plot method [25]. Generally, in the case where size effects are negligible and the micro-strain is isotropic, a straight line passing through all the points in the plot and through the origin has to be observed, where the slope provides the micro-strain: the higher the slope, the higher the micro-strain. If the broadening is not isotropic, strain effects along particular crystallographic directions can be obtained by considering different orders of a same reflection.
3. Results and discussion
3.1. Crystal structure and structural transition
As revealed by NPD analysis, at 150 K all samples crystallize in the tetragonal system, but undergo a P4/nmm → Cmme structural transition on cooling at Ts, evidenced by selective peak splitting. As a matter of fact, split peaks can be only observed in the high-resolution D2B data, whereas in the high-intensity D20 data they are convoluted in a single peak; as a result only selective peak broadening is detected. Figure 1 shows the thermal evolution of the tetragonal 220 and 322 Bragg peaks that split into the orthorhombic 040 + 400 062 and 152 + 512 doublets, marking the symmetry breaking (high-resolution D2B data). In particular, Rietveld refinements reveal that the tetragonal and the orthorhombic polymorphs coexist in a rather extended thermal range in the inspected samples, indicating that the character of the structural transition is 1st order, as in pure LaFeAsO.

Figure 1. Splitting of the tetragonal 220 (on the left) and 322 (on the right) Bragg peaks on cooling; sample La(Fe0.96Mn0.04)AsO (D2B data).
Download figure:
Standard image High-resolution imageTable 1 lists the structural parameters at 10 K as obtained by Rietveld refinement, whereas figure 2 depicts the corresponding crystal structure; figure 3 shows the Rietveld refinement plot for the sample La(Fe0.96Mn0.04)AsO, selected as representative (data collected at 10 K). Chemical substitution in LnFeAsO compounds has previously been found to lead to a contraction of the lattice constant c; this is observed for F-substitution in the SmFeAs(O,F) system [26, 27] as well as for Y-, Ru- and Co-substitution in LaFeAsO and SmFeAs(O0.85F0.15) [9, 11, 14, 28]. Conversely, Mn-substitution in LaFeAsO produces a peculiar increase of this parameter (table 1); in particular, this behaviour is related to the decrease of the As–Fe–As bond angle (As atoms at the same xy plane) with the increase of the Mn content (from ~113.9° down to ~113.0° moving from x = 0.01 to 0.08; see table 1), opposite to what observed in Ru-doped samples [11]. Figure 4 shows the effect of Mn substitution on the crystal structure of LaFeAsO: a notable expansion along the c-axis in the tetrahedral Fe–As layer is observed, yielding a significant compression of the La–O layer.
Table 1. Structural data at 10 K for La(Fe1−xMnx)AsO samples (space group Cmme; Biso: isotropic Debye–Waller factor; high-resolution NPD data collected at D2B).
| La(Fe0.99Mn0.01)AsO | La(Fe0.96Mn0.04)AsO | La(Fe0.94Mn0.06)AsO | La(Fe0.92Mn0.08)AsO | ||
|---|---|---|---|---|---|
| Cell parameters (Å) | a | 5.6873(1) | 5.6933(1) | 5.6987(1) | 5.7010(1) |
| b | 5.7120(1) | 5.7123(1) | 5.7135(1) | 5.7142(1) | |
| c | 8.7411(1) | 8.7453(1) | 8.7550(1) | 8.7609(1) | |
| Volume (Å3) | 283.97(1) | 284.41(1) | 285.06(1) | 285.40(1) | |
| Atomic site | x | y | z | Biso | x | y | z | Biso | x | y | z | Biso | x | y | z | Biso | |
|---|---|---|---|---|---|---|---|---|---|---|---|---|---|---|---|---|---|
| La | 4g | 0 | 1/4 | 0.1424(1) | 0.101(7) | 0 | 1/4 | 0.1420(1) | 0.137(5) | 0 | 1/4 | 0.1416(1) | 0.119(3) | 0 | 1/4 | 0.1410(1) | 0.154(6) |
| (Fe,Mn) | 4b | 1/4 | 0 | 1/2 | 0.007(5) | 1/4 | 0 | 1/2 | 0.026(4) | 1/4 | 0 | 1/2 | 0.013(3) | 1/4 | 0 | 1/2 | 0.008(5) |
| As | 4g | 0 | 1/4 | 0.6501(1) | 0.007(8) | 0 | 1/4 | 0.6509(1) | 0.164(6) | 0 | 1/4 | 0.6519(1) | 0.103(4) | 0 | 1/4 | 0.6523(1) | 0.121(7) |
| O | 4a | 1/4 | 0 | 0 | 0.155(8) | 1/4 | 0 | 0 | 0.260(7) | 1/4 | 0 | 0 | 0.254(4) | 1/4 | 0 | 0 | 0.269(8) |
| As–Fe–As bond angle (deg) | 113.86(1) | 113.60(1) | 113.21(1) | 113.06(1) | |||||||||||||
| 107.51(2) | 107.59(1) | 107.74(1) | 107.80(1) | ||||||||||||||
| RBragg | 3.74 | 3.53 | 1.55 | 3.55 | |||||||||||||
| Rfactor | 3.01 | 2.20 | 1.24 | 2.26 | |||||||||||||
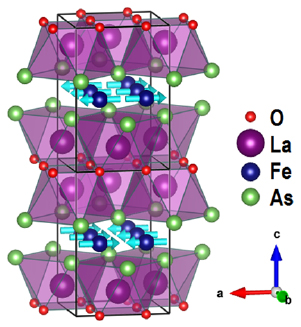
Figure 2. Spin ordering in La(Fe1−xMnx)AsO (the double anti-square prism layer coordinated by La atoms is evidenced).
Download figure:
Standard image High-resolution image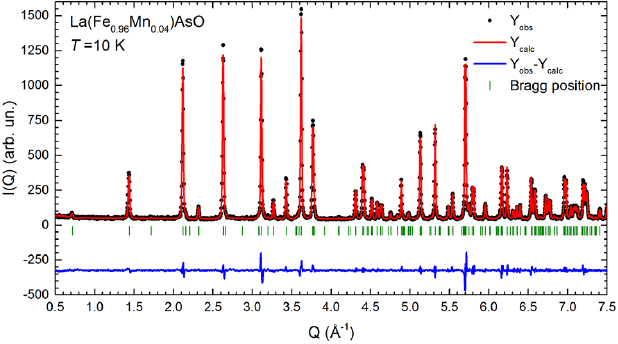
Figure 3. Rietveld refinement plot obtained fitting the NPD data collected at 10 K on the La(Fe0.96Mn0.04)AsO sample (space group Cmme); tick marks indicate the position of the Bragg peaks, the points are observed data, whereas the solid line is the calculated profile; the difference curve (observed minus calculated) is plotted at the bottom.
Download figure:
Standard image High-resolution image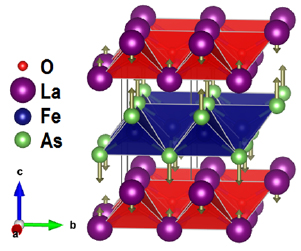
Figure 4. Distortion of the LaFeAsO crystal structure produced by Mn-substitution.
Download figure:
Standard image High-resolution imageAs afore-mentioned the tetragonal and orthorhombic phases are found to coexist within a significant thermal range; figure 5 shows a selected Q-region of the diffraction pattern where several diffraction lines split on account of the structural transformation (sample with x = 0.04, selected as representative). It is evident that the structural model foreseeing the coexistence of both polymorphs perfectly fits the experimental data collected at 80 K.
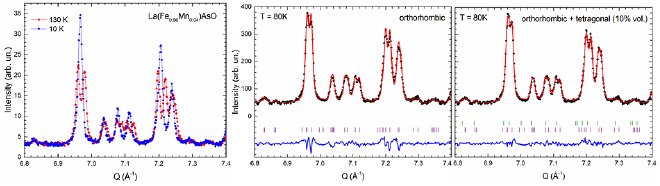
Figure 5. (On the left) Superposition of the diffraction patterns collected at 130 K and 10 K for a selected Q-region showing a widespread peak splitting (sample with x = 0.04). (On the right) Comparison of the corresponding Rietveld refinement plots demonstrating the appropriateness of the 2-phases structural model.
Download figure:
Standard image High-resolution imageThe evolution of the lattice microstrain with Mn-content is displayed in figure 6, where the Williamson–Hall plots for selected samples are superposed. It is evident that the highest strain is measured along [0 0 l] in all the inspected samples, consistently with the structural distortion displayed in figure 4, and hence it can be largely ascribed to the expansion of the tetrahedral FeAs layer along the c-axis. Noteworthy, the lattice strain tends to decrease with the increase of the Mn content.
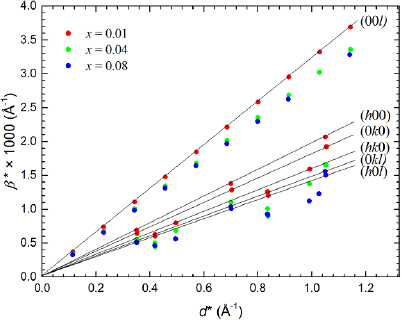
Figure 6. Superposition of the Williamson–Hall plots for the samples with x = 0.01, 0.04 and 0.08 showing the evolution of the lattice micro-strain on the Mn-content; for the sake of clarity, straight lines connecting a same family of planes are traced and indexed only for the sample with x = 0.01.
Download figure:
Standard image High-resolution imageFigure 7 shows the thermal evolution of the tetragonal 322 Bragg peaks into the orthorhombic 152 + 512 doublets for the samples with x ⩽ 0.04; as already mentioned, the peak splitting cannot be directly resolved with the D20 data, but a selective broadening is observed. These peaks have been fitted in the whole inspected thermal range and the corresponding Lorentzian isotropic strain values (a measure of their width) are plotted in figure 8 (normalized values). It is evident that the structural transition not only decreases in temperature, but also completes within thermal ranges that increase with the Mn content.

Figure 7. Thermal evolution of the tetragonal 322 Bragg peak into the orthorhombic 152 + 512 doublet (high-intensity NPD data collected at D20).
Download figure:
Standard image High-resolution image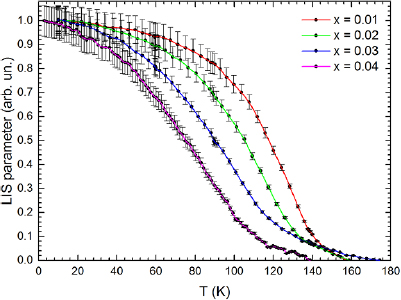
Figure 8. Thermal dependence of the Lorentzian isotropic strain (LIS) values (normalized values; lines are guide for the eye).
Download figure:
Standard image High-resolution imageAccordingly with previous analyses on both pure and substituted samples [13, 14, 26], the lattice microstrain in the tetragonal phase remains constant along the main crystallographic directions as Ts is approached, but increases significantly along [h h 0] (figure 9), that is along the direction of the nesting wave-vector between the electron and hole pocket. This behaviour clearly evidences the progressive destabilization of the tetragonal structure; in particular, lattice microstrain in the tetragonal phase reveals a local breaking of this symmetry along  , thus producing the orthorhombic distortion on cooling [26].

Figure 9. Superposition of Williamson–Hall plots showing the evolution of the lattice microstrains in the tetragonal phase on cooling. The inset shows the observed tensor isosurface representing the microstrain broadening characterizing the sample as the structural transition is approached.
Download figure:
Standard image High-resolution imageThe inset of figure 9 shows the tensor isosurface representing the microstrain broadening observed as the structural transition is approached. A large microstrain is observed along the c-axis, produced by the lattice distortion described in figure 4, increased by the thermal compression on cooling; more interestingly, an in-plane 4-fold tensor surface is observed, that is fully consistent with the microstrain expected for a 4/mmm → mmm structural transition [29].
The thermal expansion behaviour of the La(Fe,Mn)AsO samples was investigated by fitting the thermal dependence of the cell volume using a Grüneisen second-order approximation for the zero-pressure equation of state [30]:
where  and
and  ;
;  is a dimensionless Grüneisen parameter of the order of unity;
  is the compressibility and
  its derivative with respect to applied pressure;
  is the zero temperature limit of the unit cell volume;
  is the internal energy calculated by the Debye approximation:
where N is the number of atoms in the unit cell;  is the Boltzmann's constant;
  is the Debye temperature. The fitting was carried out assuming
  = 1.03 · 1011 Pa, which is the experimental bulk modulus value extracted from high pressure synchrotron x-ray powder diffraction measurements on SmFeAs(O0.93F0.07) [31], consistent with the theoretically calculated value for LaFeAsO (K0 ~ 9.8 · 1010 GPa) [32];
  ,
,  and
and  are free parameters.
  values turn out to be in the range 250 K–305 K in all cases, in agreement with the value calculated in pure LaFeAsO (
 = 282 K) from heat capacity data [33]. Figure 10 shows the resulting fitting curve for the La(Fe0.97Mn0.03)AsO sample, selected as representative; the Grüneisen law well accounts for the observed temperature dependence of the volume in the whole inspected temperature range; no departure is detected at low temperature, in agreement with the results obtained for the La(Fe1−xRux)AsO system [14].
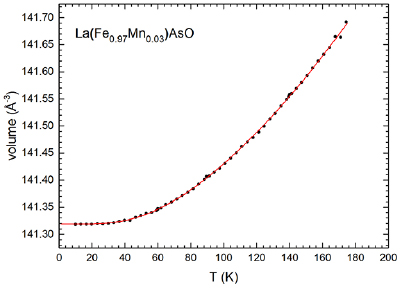
Figure 10. Thermal dependence of the primitive cell volume in La(Fe0.97Mn0.03)AsO; the solid line shows the best fit to a 2nd order Grüneisen approximation.
Download figure:
Standard image High-resolution imageThe lattice distortion solely induced by the structural transition (i.e. neglecting thermal expansion) is defined as spontaneous strain  ; the strain behaviour has thus been studied using the high resolution D2B data by applying the general equations for calculating the components of
  [34, 35]. At this scope, cell parameters for the tetragonal phase have been extrapolated at low temperature in the orthorhombic field, by fitting the experimental tetragonal cell edge a above the structural transition with modified equations (1) and (2). Hence in this case
  was fixed to 282 K, γ and K0 being the values obtained from the cell volume fitting and
  was a free parameter. The proper symmetry-breaking component of the spontaneous strain
  for the P4/nmm → Cmme structural transition is
  [4, 35], that in its general formulation corresponds to:
Note that the unit cell of the low-temperature orthorhombic phase is rotated by 45° in the xy plane with respect to that of the high-temperature tetragonal one; as a consequence,  does not represent the cell edge of the orthorhombic structure, but is an interplanar distance roughly parallel to the pristine tetragonal [1 0 0] direction. In our specific case
  simplifies to:
The  component has the same symmetry of the order parameter of the structural transition ηs (
 ηs). Figure 11 shows the dependence of ηs (obtained by normalizing the values of the symmetry breaking strain component
  ) for La(Fe0.96Mn0.04)AsO, selected as representative, consistent with a 1st order nature of the structural transition.

Figure 11. Thermal dependence of the order parameter in the orthorhombic polymorph of La(Fe0.96Mn0.04)AsO, consistent with a 1st order character of the structural transition; the line is a guide to the eye.
Download figure:
Standard image High-resolution imageAmong the other components,  is not-symmetry breaking, whereas
  and
and  are both constituted by a symmetry breaking component plus a non-symmetry breaking one. The symmetry breaking components
  =
=  (not shown) exhibit similar thermal dependences, but they do not vary linearly with
  (figure 12), implying a different strength of coupling between these components and ηs. A closer analysis reveals that:
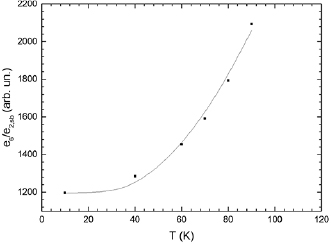
Figure 12. Plot showing  versus
  in La(Fe0.96Mn0.04)AsO as a function of temperature; the line is a guide to the eye.
Download figure:
Standard image High-resolution imageThe observed behaviour plotted in figure 12 is consistent with the shrinking and expansion experienced by the tetragonal basal plane with the symmetry breaking, since that  and
and  are parallel to the orthorhombic x and y axes, respectively.
3.2. Magnetic structure and magnetic transition
The magnetic moment characterizing LnFeAsO compounds is generally very low, never exceeding 1 μB [3]; for this reason magnetic scattering can be appreciated only in the high-intensity data. Using the NPD data collected at D20, the magnetic transition taking place at Tm was studied in samples with x = 0.01, 0.02, 0.03 and 0.04. Figure 13 shows thermodiffractograms displaying the thermal evolution of the magnetic peaks; comparing the plots one can see that the magnetic transition lowers in temperature with the increase of Mn content and that the peak intensity progressively decreases as well.
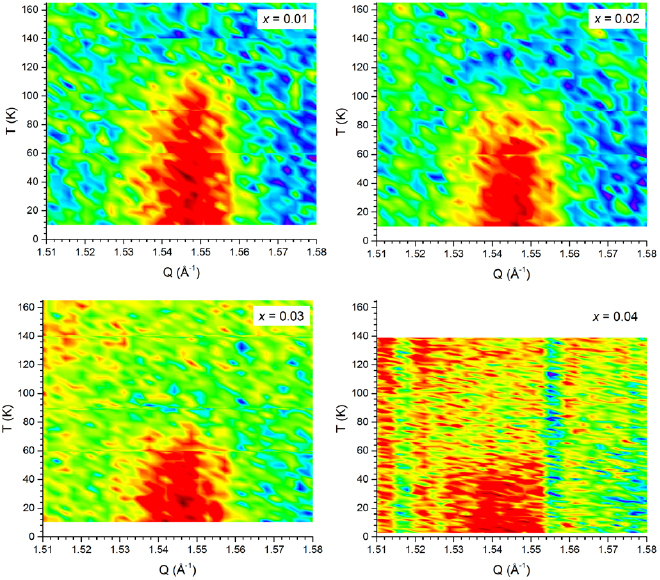
Figure 13. Thermal evolution of the magnetic Bragg peak in the inspected samples (D20 data).
Download figure:
Standard image High-resolution imageThe spin ordering is the same as observed in pure LaFeAsO, with a magnetic propagation wave-vector q = [1,0,1/2] and moments aligned along the a axis (figure 2). In all cases, the magnetic transition is continuous (2nd order) and the magnetic moment grows smoothly from zero below Tm (figure 14). The refined values for the magnetic moments are consistent with those reported by Qureshi et al [36] for pure LaFeAsO, ranging between 0.3 μB and 0.6 μB.
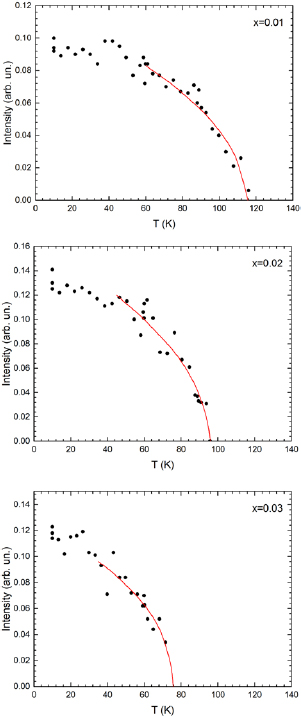
Figure 14. Thermal evolution of the integrated intensity for the magnetic Bragg peak located at Q ~ 1.55 Å−1 ( +
+  magnetic Bragg peaks; NPD data collected at D20); lines represent the fits obtained by equation (6) for t ⩾ 0.5.
Download figure:
Standard image High-resolution imageTo our knowledge, the critical exponent β has never been estimated for the magnetic transition taking place in REFeAsO compounds; nonetheless, β = 0.21 is obtained after fitting the data obtained by muon spin spectroscopy for pure LaFeAsO reported by Amato et al [37]. This value is in fair agreement with that obtained for BaFe2As2 (β = 0.206) [38]; remarkably, in this case it was found that the calculated value β resulted almost constant by fitting the full data set or, otherwise, within a reduced temperature range Δt ~ 0.9–1.0.
Being the magnetic Bragg peak intensity I proportional to the square of the sub-lattice magnetization, its thermal dependence follows the power law:
where I is the integrated intensity of the magnetic Bragg peak (the peak at Q ~ 1.55 Å−1), A is a constant and β represents the critical exponent. In our case, we fitted data for t ⩾ 0.5 (figure 14). For samples with x = 0.01–0.03 data fitting yields β ~ 0.22–0.26, quite consistent with the value obtained for pure LaFeAsO. For x = 0.04 the paucity of the experimental data prevents any accurate analysis. The resulting fittings are displayed in figure 14.
Table 2 resumes the data relevant to the magnetic phase as obtained by the analysis of the data collected at the D20 diffractometer.
Table 2. Data pertaining to the magnetic phase as obtained by Rietveld refinement and data fitting using equation (6) (data collected at D20).
| La(Fe0.99Mn0.01)AsO | La(Fe0.98Mn0.02)AsO | La(Fe0.97Mn0.03)AsO | La(Fe0.96Mn0.04)AsO | |
|---|---|---|---|---|
| m (μB) at T = 10 K | 0.61(7) | 0.54(8) | 0.45(9) | 0.34(7) |
| Tm (μB) | 115.5(1) | 95.7(1) | 71.5(1) | 52(2) |
These results indicate that magnetic interactions are short-ranged [39] and that the nature of the magnetic interactions is not significantly affect by Mn-substitution, but their strength. It is worth noting that the substituting high-spin Mn2+ ion (3d5) is characterized by a strong Hund's coupling; on account of its extremely stable external electronic configuration, it may conjectured that Mn2+ opposes any variation to its electronic state and in this way affects its local environment, in particular the average exchange field produced by the neighbouring Fe ions. For this reason, the magnetic moments interactions are weakened on average and, as a consequence, the magnetic transition lowers in temperature and the value of the ordered magnetic moment decreases.
3.3. The phase diagram
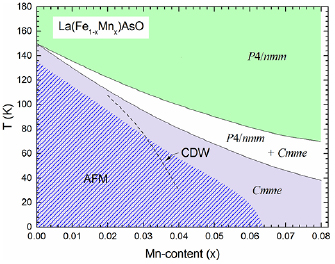
On the basis of the results obtained by investigating the thermal evolution of the crystal structure and of the spin ordering, a phase diagram for the La(Fe1−xMnx)AsO system can be tentatively drawn (figure 15). It becomes visible that the evolution of the structural (Ts) and the magnetic (Tm) transition temperatures with Mn-content is decoupled. At first, both temperatures decrease similarly with substitution, then, however, the magnetic ordering temperature decreases much faster than the structural transition temperature and starting from x ~ 0.6 magnetism is largely hindered down to its complete suppression. Moreover, one can now clearly state that magnetism sets only in after that the orthorhombic phase is well established, that is within the orthorhombic phase field. Conversely, the structural transition temperature almost homogenously decreases, but does not get suppressed within the inspected compositional range. This behaviour indicates that the structural transition is not originated by magnetic degrees of freedom. Charge and orbital degrees of freedom thus remain the most likely candidates driving the symmetry breaking. In a previous work, we detected the occurrence of satellite peaks in the orthorhombic polymorph of some La(Fe1−xMnx)AsO samples pertaining to this same series, evidencing the occurrence of a static charge density wave [21]; this result points to a charge density wave (CDW) instability playing a major role in the structural transition. In this context, it is worth to note that the very faint satellite peaks marking the incommensurate structure can be detected only by using high-resolution synchrotron x-ray powder diffraction; this is the reason why such diffraction lines are not observed in our NPD patterns.
Figure 15. Tentative phase diagram of the La(Fe1−xMnx)AsO system in the Mn-poor side, showing the stability fields for both polymorphs and their coexistence field; the hatched area represents the region of the phase diagram where long-range magnetic ordering takes place; the dotted line defines the region where a static CDW state was detected [21].
Download figure:
Standard image High-resolution image
By comparing the phase diagrams of the La(Fe1−xMnx)AsO and La(Fe1−xRux)AsO [14] systems, the huge effect of Mn-substitution on the structural transition temperature becomes evident. For example, the tetragonal phase is unstable above ~130 K in the La(Fe1−xRux)AsO system for x = 0.10, but the same result is obtained with x ~ 0.01 in the La(Fe1−xMnx)AsO. In the Ru-substituted systems properties are strongly affected by the disorder induced by Ru ions, which do not sustain any magnetic moment and act as nonmagnetic impurities [11]. The huge decrease of Ts observed in the Mn-substituted system clearly indicates that Mn does not induce only disorder; other effects are at play, especially the frustration of the electronic interactions surrounding the local environment of the dissolved Mn2+ ions.
4. Conclusions
The phase diagram of the La(Fe1−xMnx)AsO system has been drawn for the Mn-poor side on the basis of structural and magnetic data obtained by neutron powder diffraction. Mn substitution induces a huge change in the structural and magnetic properties of LaFeAsO. This behavior is likely related to the peculiar nature of the substituting Mn2+ ions (a 3d5 species), characterized by a strong Hund's coupling yielding a highly stable electronic configuration. As a result, the spin and orbital interactions as well as charge fluctuations within the surrounding Fe sub-lattice (driving the structural and the magnetic transition) are hindered or even suppressed. In conclusion, Mn substitution strongly upsets the underlying electronic structure and represents a peculiar way to shed light on the origin of the structural transition and related properties in the LnFeAsO compounds. This issue is fundamental in order to clarify and understand the tangled relationship between structural, magnetic, superconductive and crystallo-chemical properties.