

Abstract
We investigate the dynamic structure factor of the melt of the well known glass former, As2Se3, using inelastic x-ray scattering for temperatures, T,  K and momentum transfers Q from
  nm−1. An anomaly was observed at Q = 2.7 nm−1 (
 K) with, in the context of a simple model, both an abrupt change in frequency and an increased linewidth reminiscent of an anti-crossing in a solid. Comparison with structural information from reverse Monte Carlo modeling of x-ray diffraction data allows us to associate the disappearance of the anomaly at higher temperatures with a drop in the number of mechanical constraints per atom, nmc, to
  reminiscent of the threshold applicable for glass formation in rigidity theory. It is inferred that the surprising jump in the dispersion in the liquid may be correlated with a stiffness transition in a network glass.
Export citation and abstract BibTeX RIS
The As1−xSex system gained significant attention as a glass former [1] where the glass forming ability was sensitively dependent on x, as discussed in terms of rigidity theory [1–3]. It is therefore interesting to investigate the dynamics of the melt via measurements of the dynamic structure factor,  , where E is energy transfer, over the meso-scale length scales associated with glass formation, and to relate these results to possible implications for the glass formation.
The structure of liquid As2Se3 has been investigated both by experiment [4, 5] and calculation [6, 7]. At lower temperatures, just above the melting point, the liquid has semiconducting properties with a network structure where three-fold coordinated As and two-fold coordinated Se are covalently bonded. The system has asymmetrical bonding: atoms in this network interact with up to the second and third nearest neighbours through weak bending and torsional forces, respectively. At higher temperatures (>1300 K) and pressures (P > 5 MPa), liquid As2Se3 undergoes a semiconductor to metal transition. Ab initio molecular dynamics (AIMD) simulations for liquid As2Se3 [6, 7] revealed that the number of the nearest neighbour atoms at an As site decreases with increasing T and two-fold coordinated As becomes dominant in a metallic region. X-ray diffraction experiments on liquid As2Se3 [4, 5] confirmed the simulation result that the average nearest neighbour coordination number  decreases with increasing T. However, there has not been experimental work to investigate the liquid dynamics on shorter (nm and smaller) length scales, where they may be sensitive to changes in bonding and the semiconductor-metal transition.
Here we investigate the dynamics of an As2Se3 melt at a high pressure as T is increased. We use inelastic x-ray scattering (IXS) as a direct probe of the dynamic structure factor on nm length and ps time scales. We observe a surprising anomaly that we discuss in terms of an anti-crossing model applicable to a rattling motion of a guest atom in a large cage (e.g. [8]), and then relate our results, especially, the disappearance of the anomaly at higher temperatures, to rigidity theory [9, 10] using the atomic configurations obtained by reverse Monte Carlo (RMC) modeling [5].
The IXS experiments were conducted at the high-resolution IXS beamline (BL35XU) of SPring-8 in Japan [11]. Backscattering at the Si (11 11 11) reflection provided a beam of approximately 1010 photons s−1 in a 0.8 meV bandwidth onto the sample. The energy of the incident beam and the Bragg angle of the backscattering were 21.747 keV and approximately 89.98°, respectively. We used twelve spherical analyzer crystals at the end of the 10 m horizontal arm. The spectrometer resolution was 1.5–1.8 meV depending on analyzer crystal, as was determined by measurements of polymethyl methacrylate. The Q resolution,  , was set to be 0.45 and 1.0 nm−1 (full width) for
  and Q > 11 nm−1, respectively.
The As2Se3 sample of 99.999% purity and 0.1 mm thickness was mounted in a single-crystalline sapphire Tamura-type cell [12] which was placed in a high-pressure vessel. The vessel was filled with He gas (99.999% purity) at 6 MPa to stabilize the liquid state. Further information on the set-up of IXS experiments at high pressures is described in [13]. IXS spectra of liquid As2Se3 were measured at temperatures from 773 K to 1673 K. The background spectra were measured at 1273 K and 6 MPa using an empty cell. After background subtraction with the absorption correction and integration with respect to E, we deduced the normalized dynamic structure factor  of liquid As2Se3 from the observed spectra.
The ultrasonic sound velocity of liquid As2Se3 was measured at  K, using a quartz cell with a standard pulse echo technique. A PZT transducer operating at about 8.9 MHz was used to produce and detect ultrasonic waves. The time interval required for sound to travel between a delay line end and a reflector was measured using the time function of a LeCroy LT262 oscilloscope. By this method, changes in the sound velocity >0.2 m s−1 could be easily resolved. The details of the ultrasonic measurements are described in [14].
Figure 1 shows  at 1073 and 1473 K. At 1073 K,
  at
at  nm−1 exhibits a single peak of the width slightly larger than the resolution. This result suggests that the inelastic excitation corresponding to the longitudinal acoustic mode is merged into the broad quasi-elastic component. At
  nm−1 the inelastic excitation becomes visible as a shoulder on both sides of the quasi-elastic peak. On the other hand,
  at 1473 K exhibits a single broad peak at each Q.
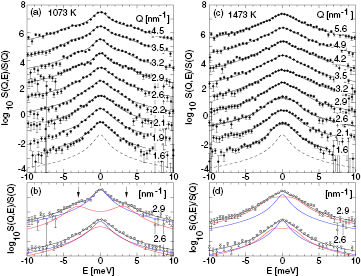
Figure 1.  of liquid As2Se3 at (a) 1073 K and (c) 1473 K. Black circles and solid lines denote the experimental results and the optimized fits with the model function, respectively. The data were measured at 6 MPa. Each spectrum is shifted by multiplying 10 for clarity and Q values are shown in the right hand side. The resolution function is shown by the broken line at the bottom. The optimized central peak (blue) and inelastic excitation (red) of the model function at (b) 1073 K and (d) 1473 K. The arrows at (b) 1073 K denote shoulder positions.
Download figure:
Standard image High-resolution imageTo obtain the excitation energy of the longitudinal acoustic mode, we carried out the least-square fitting using the model function composed of a Lorentzian and the damped harmonic oscillator (DHO) [15] as,

where  . A0 and
  are the amplitude and the linewidth of the Lorentzian, respectively. A1,
  and
and  are the amplitude, the linewidth and the excitation energy for the inelastic excitation. The symbol
  indicates convolution with the resolution function,
  . The optimized curves of these components are shown in figures 1(b) and (d). While we recognize that this simple model can not hope to capture the entire dynamics of the system, practically it provides good fits to the observed spectra.
Figure 2 shows the total structure factor obtained by x-ray diffraction,  , the dispersion relation of the excitation energy
  of the acoustic mode, and its linewidth
  at 1073 and 1473 K.
  disperses with increasing Q, being consistent with the Q dependence of the acoustic mode. The linewidth at 1473 K agrees well with a simple Q2 dependence, However, at 1073 K, there is significant deviation at low Q.

Figure 2.  of liquid As2Se3 in FSDP region at (a) 1073 K and (c) 1473 K. A solid line denotes
  obtained by x-ray diffraction experiments [5] and open squares denote the integration of IXS
  normalized to x-ray diffraction data at 10.6 nm−1. The integration and
  are smoothly connected with each other. The excitation energy of the acoustic mode
  (closed circles) and the linewidth
  (closed triangles) at (b) 1073 K and (d) 1473 K are plotted as a function of Q. The broken line in each panel (b) and (d) denotes the optimized Q2 dependence for
  at low Q.
Download figure:
Standard image High-resolution imageFigure 3 shows the Q dependence of  and
and  at each T.
  at the lowest Q disperses as slowly as the ultrasonic sound speed cs, and cs gradually slows down with increasing T. As shown in figures 3(a)–(f),
  abruptly increases between 2.6 and 2.9 nm−1 for
  K, whereas such a change is fully suppressed at
  K. Meanwhile, the linewidth shows an increase at the same momentum transfer, though the peak in the linewidth is extended over a wider Q range, as shown in figures 3(g)–(j).

Figure 3. (a)–(f) The optimized  values at T indicated in each panel are plotted as a function of Q. The line from the origin in each panel shows the energy corresponding to the ultrasonic sound speed (the speed at
  K is a smooth extrapolation of the ultrasonic data at
  K). Also shown are optimized fits using a linear chain model (the red broken line in each panel). (g)–(l) The optimized 2
 values at T indicated in each panel are plotted as a function of Q. The broken lines in each panel show the optimized 2
 curve and red arrows indicate the broad maximum in 2
 .
.
Download figure:
Standard image High-resolution imageThe abrupt change observed in  is different from Q dependence of the hydrodynamics–viscoelastic transition so far reported, where the acoustic excitation energy gradually increases with Q [16–21]. We interpret this in terms of an anti-crossing effect as is well known from the dynamics of crystals (see, e.g. [22]). This leads to an effective linewidth increase due to mode mixing, with both modes becoming visible simultaneously, and which can appear as broadening. In particular, an increase in
  is observed at approximately 2.3 nm−1 as shown in figures 3(g)–(j). Black circles deviate from the broken line at
  K but they follow the broken line fairly well at 1673 and 1473 K.
  for the optimized Q2 curve was a factor of four larger at
  K than at
  K.
K.
We analysed the experimentally obtained dispersion curve using a linear chain model with a rattler motion [8] that can represent an anti-crossing behaviour in a dispersion curve. This linear chain is constituted from a cage wall and a guest atom of mass M and m, respectively, and the lattice constant between the cage walls is d. The neighbouring cages interact with a force constant K1 while that between the guest atom and the wall is K2. To make an anti-crossing at  nm−1, we chose d = 0.24 nm, and took
  . See the detailed discussion in the supplementary material, available at (stacks.iop.org/JPhysCM/30/28LT02/mmedia). The least-square fits using this model are shown by the red broken curves in figures 3(a)–(f) and a discrete change at 2.7 nm−1 is well reproduced. The fixed d value is close to the covalent bond length in As2Se3. When a covalently bonded network is stabilized in liquid As2Se3, stretching, bending and torsional forces are expected to work on each atom in the network. When a covalent bond is regarded as a force between cage walls, bending and torsional forces may cause an effect equivalent to a rattler motion.
For covalently bonded chalcogenide glasses such as AsxSe1−x, the glass forming ability is known to depend on the average nearest neighbour coordination number,  , of constituent atoms, suggesting that connectivity between atoms plays a crucial role for stabilizing disordered network glasses. Rigidity theory for the network structure assumes that the system is the most stable when a number of mechanical constraints per atom, nmc, is equivalent to spatial degrees of freedom [1–3]. This condition gives
  as a critical value of
  . Rigidity theory explains the high glass forming ability of As0.4Se0.6 among AsxSe1−x by
  at x = 0.4 when As and Se maintain three-fold and two-fold coordinated configurations, respectively. Further, rigidity theory has predicted that covalent glasses undergo a stiffness transition from flexible to inflexible structures when
  crosses a critical value rc from
  .
.
To investigate relationship of the observed anti-crossing behaviour in liquid As2Se3 with a stiffness transition in the glassy system, we estimated nmc in the liquid. In the original rigidity theory for network glasses, bond stretching and bond bending constraints are obtained on the assumption that covalent bonds are stiff. To apply this theory to melts, T-dependent constraints have been considered using a two-state thermodynamic functions [9], or partial bond angle distributions (partial BADs) obtained by molecular dynamics simulations [10, 23]. Referring to these studies, we investigated partial BADs in atomic configurations obtained by our own RMC modeling for a system of 5000 particles [5]. In this modeling, partial coordination number fractions were constrained by the prediction of the AIMD simulation [6, 7]. Figure 4 shows partial and total BADs at 673 K and 1473 K. We chose the cutoff distance of 0.27 nm for each bond, as used in the AIMD simulation [6, 7]. As shown in the figure, BAD at 1473 K becomes broader than that at 673 K. We counted bond bending constraints per each atom, nbending, limiting bond angle ranges for each atomic triplet. We chose the angle ranges as 90–110° for As–As–As, 80–130° for Se–As–As, 80–120° for Se–As–Se (a central As) and 70–150° for a central Se from partial BADs at 673 K. We assumed that the bond angle ranges at a central As is narrower than at a central Se because As form a pyramid. On the other hand, bond stretching constraints per atom was taken r/2 (where r is the coordination number with a cutoff distance = 0.27 nm at each atom) as in the original rigidity theory. We could obtain a number of mechanical constraints per atom using the equation,  [9, 10]. Averaging the constraint numbers, we obtained nmc at each T.
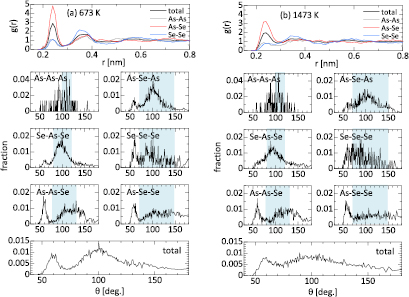
Figure 4. (a) The pair distribution function  and partial and total bond angle distributions obtained by RMC modeling for the x-ray diffraction structure factor at 673 K. A peak at 60° in As–Se–As and As–Se–Se BADs is more visible than those reported by an AIMD simulation for the glass [23] and this peak in each panel may be spurious. (b)
  and partial and total bond angle distributions obtained by RMC modeling at 1473 K. A coloured zone on each panel indicates an angle range for bending constraints.
Download figure:
Standard image High-resolution imageFigure 5(a) shows nmc (black circles) averaged over all atoms as a function of T. Also shown are nmc's averaged at As and Se sites by triangles and red circles, respectively. Black circles at  K are approximately three, equal to a dimensional number, and nmc decreases to two at 1573 K with increasing T. A melt-quenched glass is regarded as an undercooled liquid with a long (effectivley infinite, for this experiment) relaxation time. A cage structure where atoms thermally vibrate around their equilibrium positions within a picosecond period in liquid As2Se3 near the melting point must strongly correlated with a network in the glassy state. Hence it is expected that rigidity of the cage in liquid As2Se3 is closely correlated with a stiffness transition in glassy AsxSe1−x. In figure 5(b), we plot an average coordination number (black circles) obtained from nmc using the mean field approximation,
  [2]. Black circles at
  K are consistent with the ideal value of 2.4 and it decreases to two at 1673 K. Although
  obtained by x-ray diffraction experiments [5] is larger than 2.4 at T < 1200 K partly because of experimental errors, the present analysis implies that defects with higher coordination numbers contribute to it as reported in glassy As2Se3 [24].
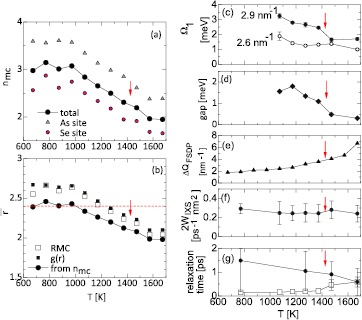
Figure 5. (a) T dependence of nmc (black circles). Also shown is nmc at each atomic site. (b) The average coordination number  in atomic configurations obtained by RMC modeling (open squares) and integration of
  (black squares) using the cutoff distance of 0.27 nm. Also shown is
  estimated from nmc (black circles). (c) The optimized
  at 2.6 and 2.9 nm−1. (d) A gap at 2.7 nm−1 indicating the optimized red broken line in figures 3(a)–(f). (e) Half width half maximum of FSDP
  . (f) The optimized 2WIXS for 2
 . (g) The relaxation time of a fast relaxation process
  (open squares) and that of the stretching mode
  (closed circles). The red arrow in each panel denotes T where
  discretely changes.
Download figure:
Standard image High-resolution imageA stiffness transition in glassy AsxSe1−x has been investigated [25–27], in terms of the intermediate phase consisting of rigid nanodomains and inter-domain space predicted by advanced rigidity theory [3], and the phase has been confirmed in chalcogenide glasses [28, 29]. Here we considered that a rigid nanodomain can originate from a cage in a liquid. Figure 5(e) shows the half width half maximum  of the FSDP in
  of liquid As2Se3 [5]. The coherence length
  is defined by
  , which represents the average size of a cage in the liquid state.
  decreases from 1.8 nm at 673 K to 0.9 nm at 1373 K in liquid As2Se3.
Next, we estimate a structural relaxation time  in liquid As2Se3. 2
 approximately follows 2
 , where WIXS is a constant up to 5 nm−1 as predicted by hydrodynamics equations [30]. We carried out the least-square fitting for 2
 at
at  nm−1, as shown in figures 3(g)–(i), and determined 2WIXS as in figure 5(f). The visco-elastic theory predicts the Maxwell relation [30],
  , where
  is the relaxation strength. We approximated
  as
as  , where cp is the dynamical sound speed obtained by IXS. We take
  at 2.9 nm−1 and obtain
  as shown in figure 5(g).
  of approximately 0.2 ps at
  K shifts to 0.5 ps at 1473 K, being correlated with the T dependence of
  at 2.9 nm−1 and a energy gap at 2.7 nm−1 that was obtained by the optimized parameters9, as shown in figures 5(c) and (d), respectively.
We compare  with the lifetime of the stretching mode
  in liquid As2Se3 obtained by IXS. In
  ,
,  was determined by fitting the second inelastic excitation at high Q using the model function with two damped harmonic oscillators10. As shown in figure 5(g),
  is approximately 1 ps at
  K. This means that a cage structure in the liquid is stable during 1 ps at
  K, and the cage will be transformed into a rigid nanodomain in the glass. From
  of 0.2 ps much shorter than
  at
at  K,
K,  should be the relaxation time between cages.
  approaches
  at
at  K. The coincidence of
  and
and  at 1673 K implies that cages are not distinguished from each other because of weakening of the covalent bonds as metallic properties are enhanced. From these results in liquid As2Se3, it is expected that rigidity of a cage with a nanometer size and a picosecond life time may change, as T is elevated.
In summary, the IXS experiments revealed that the acoustic excitation energy in liquid As2Se3 exhibits an anomaly for  K that has a strong similarity to an anti-crossing behaviour in a solid. This behaviour disappears for
  K. The temperature dependence is well correlated with a decrease in the number of mechanical constraints (nmc) estimated, from 3 to 2.2, as determined from RMC simulations. In analogy with rigidity theory used in network glasses, we interpret that an atomic time scale rigidity of cages in liquid As2Se3 is correlated with nmc obtained from RMC simulation. We estimate the size and lifetime of a cage in liquid As2Se3 at 1373 K as approximately 1 nm and 1 ps, respectively. The present results suggest that seeds of rigid nanodomains in the glassy state may originate in the liquid state.
Acknowledgments
The authors would like to thank Japan Society for the Promotion of Science (JSPS) for a Grant-in-Aid for Scientific Research (A) (20244061). The synchrotron radiation experiments were performed at the SPring-8 with the approval of the Japan Synchrotron Radiation Research Institute (JASRI) (Proposals 2012A1156, 2012A1155, 2012A1154, 2009B1286, and 2005B0414).
Footnotes
- 9
The optimized
 and at 1073 K were 7.5 and 3.4 ps–1, respectively, and these become 5.3 and 2.4 ps–1 at 1673 K, respectively.
 - 10
The consistency between the optimized
and the peak energy of the power spectrum of the velocity autocorrelation function obtained by the AIMD was confirmed although the AIMD results slightly underestimate the excitation energy of the stretching mode.


