
Abstract
We present results of magneto-focusing on the controlled monitoring of spin polarization within a one-dimensional (1D) channel, and its subsequent effect on modulating the spin–orbit interaction (SOI) in a 2D GaAs electron gas. We demonstrate that electrons within a 1D channel can be partially spin polarized as the effective length of the 1D channel is varied in agreement with the theoretical prediction. Such polarized 1D electrons when injected into a 2D region result in a split in the odd-focusing peaks, whereas the even peaks remain unaffected (single peak). On the other hand, the unpolarized electrons do not affect the focusing spectrum and the odd and even peaks remain as single peaks, respectively. The split in odd-focusing peaks is evidence of direct measurement of spin polarization within a 1D channel, where each sub-peak represents the population of a particular spin state. Confirmation of the spin splitting is determined by a selective modulation of the focusing peaks due to the Zeeman energy in the presence of an in-plane magnetic field. We suggest that the SOI in the 2D regime is enhanced by a stream of polarized 1D electrons. The spatial control of spin states of injected 1D electrons and the possibility of tuning the SOI may open up a new regime of spin-engineering with application in future quantum information schemes.
Export citation and abstract BibTeX RIS

Original content from this work may be used under the terms of the Creative Commons Attribution 3.0 licence. Any further distribution of this work must maintain attribution to the author(s) and the title of the work, journal citation and DOI.
Introduction
There is considerable interest in utilizing the spin of electrons in future quantum information schemes. The use of semiconductors in this regard, with their flexibility, is particularly important both for spintronics and future information processing. The spin degree of freedom can most easily be monitored when electrons are restricted to lower dimensions and in terms of this the confinement of electrons to two-dimensions (2D) with their concentration controlled by a gate is extremely useful for such investigations. Although, the GaAs electron gas is one of the cleanest semiconductor systems with relatively small spin–orbit interaction (SOI), there are a few intriguing reports on the observation of the spin Hall effect [1, 2]. Additionally, some early work probed a zero magnetic field splitting in GaAs by means of the election spin resonance [3], Raman scattering [4] and Shubnikov–de Haas (SdH) oscillations [5]. In these investigations, the origin of the zero-field splitting was confirmed to be due to SOI [4–6] and the extracted strength of the SOI was greater than expected. These observations are encouraging and could open a new field of spin-engineering or spintronics using electrons in GaAs which has not received much attention due to the stronger SOI effects being present in the Indium based compounds such as InGaAs or InSb [7–9].
Although materials with strong-orbit interaction have been studied extensively for possible spintronics application [7–9], they generally suffer from relatively low mobility and short spin relaxation time. These limiting factors can be overcome by using high mobility 2DEG in GaAs with sufficiently long spin relaxation time [10]. In addition, having a control on spin polarsation and the SOI provides an added advantage for the GaAs electron gas to have potential applications in future spin based quantum schemes.
In the present work, we report a controlled method to generate polarized electrons within a 1D channel, and measure the degree of polarization and its subsequent effect on the spin–orbit interactions in the 2D system. We have utilized transverse electron focusing which has been proven to be a useful method in measuring the population of spin states [8, 9, 11–15]. We found that a large SOI (in terms of the 2D GaAs electron gas) is realized by injecting partially spin polarized current from a 1D channel while a negligible SOI is obtained with unpolarized current injection. Moreover, the observation is also important for the phenomena where spin injection is involved such as the spin Hall effect [1, 2] and injection from magnetic contacts [16, 17]. This technique of modulating the spin orbit interaction may be implemented in other systems by sending a polarised current with the assistance of 1D quantum wire realised by a pair of split gates, and enhancement in the SOI may be seen by measuring the split in odd-numbered focusing peaks.
Experimental
The devices studied in the present work were fabricated from the high mobility 2D electron gas (2DEG) formed at the interface of GaAs/Al0.33Ga0.67As heterostructures. At 1.5 K, the measured electron density (mobility) was 1.80 × 1011 cm−2 (2.17 × 106 cm2 V−1 s−1), corresponding to a mean free path over 10 μm which is much larger than the electron propagation length in this work. The experiments were performed in a cryofree dilution refrigerator with an electron temperature of 70 mK, unless specified, using the standard lockin technique. The results were reproducible with thermal cycling.
In the devices used here the injector and detector are defined with angled QPCs (quantum point contact, which is a short quantum wire) as shown in inset of figure 1 in both orthogonal (a) and linear configuration (b). The injector and detector QPCs are at right angle to each other forming an orthogonal focusing geometry, and the shape of the QPCs has been varied from 30°–90° in steps of 30° to change the effective length along the transport direction (for example, two different shapes, 90° and 60° are shown in the inset in figure 1(a)). By biasing the injector and detector independently and symmetrically, we made sure that a lateral electric field across the quasi-1D injector channel was not present as this could affect the focussing process, for instance resulting in a shift of focusing peaks due to the change of the effective separation between injector and detector. The effect was reproducible in different samples and in different focusing device geometries. The main results are obtained from the orthogonal focusing geometry, unless otherwise specified.
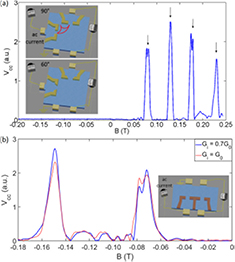
Figure 1. The experiment setup and device characteristic. (a) A representative result of orthogonal focusing geometry for 90° QPC; here Vcc is the voltage drop across the detector. Periodic focusing peaks are well defined and the position is in good agreement with calculated value as highlighted by the arrows. Odd numbered focusing peaks show pronounced splitting, whereas even ones do not split. Upper and lower inset show the illustration of experiment setup for the 90° and 60° QPC, respectively. The light golden pattens at the end of the mesa are Ohmic contacts, the dark yellow blocks within the mesa are electron-beam lithographically defined metallic-gates. Lithographically defined separation between the injector and detector is 1.5 μm (along the diagonal direction). The width (confinement direction) of the QPC is 500 nm (for 30° and 60° QPCs, the width is measured at the narrowest end) and the length (current flow direction) is 400 nm. The gap between the injector and detector is 200 nm, so when the injector and detector are operational, this gap remains in the pinched-off, thus fully reflecting the incident electrons. (b) A representive result from the linear focusing geometry with a separation between the injector and detector of 1.6 μm. Inset shows an illustration of experimental setup for the linear focusing geometry.
Download figure:
Standard image High-resolution imageResults and discussion
In the presence of a small positive transverse magnetic field  electrons are focused from injector to detector leading to focusing peaks periodic in
  with a periodicity of 60 mT using the relation [14, 18],
There is good agreement between the experimental and calculated values. Here e is the elementary charge and  is the reduced Planck constant, L is the separation between injector and detector. The pre-factor
  accounts for the orthogonal focusing geometry. A comparison between negative and positive magnetic field focusing result suggests the Quantum Hall effect and Shubnikov–de Haas (SdH) oscillations are negligible in the regime of focusing [18], and all the features are due to transverse electron focusing only. Apart from the well resolved focusing peaks as shown in figure 1(a), it is noticed that the first and the third peaks split into two sub-peaks, the splitting for the first peak is around 6 mT, while the second and fourth peaks remain unitary, this observation is similar to that reported for p-type GaAs [11–13], n-type InSb [9] and n-type InxGa1−xAs [8] and considered theoretically [19, 20].
QPCs with different shapes (90°, 60° and 30° QPCs) are used as electron injectors [14, 21, 22]; here the 90° and 60° QPCs inject partially spin polarized electrons while 30° QPC injects unpolarized electron [21, 22]. The unique shape dependence allows us to study the spin texture of the injected 1D electrons and any effects associated with it.
A detailed study of focusing measurement as a function of injector conductance is shown in figures 2(a)–(c) for 90°, 60° and 30° angled QPCs, respectively. For the ease of understanding the mechanism we fixed the detector in the middle of the first conductance plateau  , so that the results are decided by the injection process only. For 90° and 60° QPCs, splitting of the first focusing peak is pronounced when the injector is opened up such that the conductance varies from 0.7G0 (highlighted by red arrows in figure 2) up to the end of the second conductance plateau (2G0, marked by blue arrows). It is important to emphasize that the splitting of the first focusing peak does not change for the injector conductance up to 2G0, however, the splitting weakens and disappears as the injector conductance increases slightly above 2G0 [23]. It may be noted that the asymmetry between the sub-peaks is highly sensitive to the injector conductance below 2G0. When the QPC becomes sharp (30°) the result changes dramatically, such that the first focusing peak does not show any splitting. This result is in agreement with previous reports [18, 24] where pointed split gates were used for injecting the electrons. We note that the dependence of focusing spectrum on the shape of injector has not been reported previously.
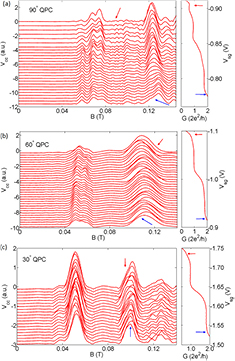
Figure 2. Focusing spectrum with different injector QPCs. (a)–(c) show the focusing results as a function of injector conductance for 90°, 60° and 30° QPC, respectively. Data have been offset vertically for clarity. The top (bottom) trace shown by the red (blue) arrow corresponds to the injector conductance shown in the right-panel in (a)–(c).
Download figure:
Standard image High-resolution imageI. Robustness of peak splitting
There is a possibility that the observed splitting of odd-numbered focusing peaks is due to angular spreading of the injected electron (depending on the details of the wavefunction within the QPC) or disorder induced current branching [25]. The electron paths diverging due to these scenarios are not spin related and are maximized if the electrons travel along a quarter circular cyclotron orbit. To rule out such possibilities in our case, we provide further information as below.
First, the experiment was repeated with a linear focusing device fabricated from the same wafer as shown in inset of figure 1(b). With a linear geometry two electron paths (due to different injection angle) that are diverging from the injector QPC come back together after travelling in a half circular cyclotron orbit, thus the effect of angular spreading of the injected electron is minimized. It is seen that the splitting of the first peak and lack of splitting of the second peak in a linear focusing device geometry is similar to that observed with the orthogonal focusing device geometry (figure 1). A change of the focusing periodicity compared to the orthogonal focusing geometry is due to the difference in the lithographically defined separation between the injector and detector.
Second, we noticed that the first focusing peak shows a pronounced splitting when the injector conductance is smaller than 2G0 ( ), however, such splitting is absent at large injector conductance value (e.g. 3G0 and 4G0) and only a single peak is observed with the orthogonal focusing geometry as shown in figure 3(a). It is also important to emphasize that the single peak at large injector conductance value aligns with the dip between the two sub-peaks rather than one of the sub-peaks. Assuming the peak splitting with small injector conductance is due to angular spreading of the injected electron or disorder induced current branching, then with even larger angular spreading at larger injector conductance the splitting should persist (for instance, in [25] the peak splitting is observable even at 6G0). However, this expectation contradicts the experimental result and indicates the observed peak splitting is unlikely to arise from electron branching, similarly the lack of an effect due to change of disorder.
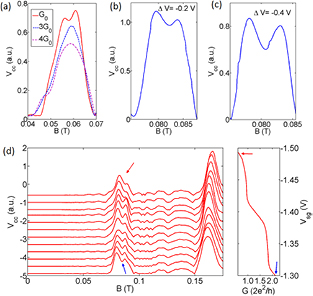
Figure 3. Robustness of peak splitting under different experimental conditions. Results in (a)–(d) were obtained from orthogonal focusing device with 90° QPCs. (a) Splitting of the first focusing peak was observed with the injector conductance fixed at G0, however, a single broad peak was observed when the injector conductance was set to 3G0 and 4G0, respectively. (b) and (c), the injector QPC was asymmetrically biased while the detector was symmetrically biased. Both the injector and detector are fixed at G0. The splitting of focusing peak was still observable after shifting the channel laterally by −0.2 and −0.4 V, respectively. A change in the position of both sub-peaks is noticed. (d) Splitting of the first focusing peak is still observable while the residual peaks weakened significantly after illuminating the device with a red LED. Data have been offset vertically for clarity.
Download figure:
Standard image High-resolution imageAdditionally, the intensity of sub-peaks does not necessarily become symmetric at the conductance plateaus if the peak splitting arises from the disorder-induced electron branching as shown in [25]. In our experiment, the peak becomes symmetric at conductance plateaus in all the cases as shown in figures 2 and 3.
Similarly, the smearing out of the peak splitting at higher injector conductance also excludes the possibility that the observed peak splitting is associated with the form of wavefuction. Assuming the peak splitting correlates with the wavefunction, then the increased number of nodes of wavefunction at higher injector conductance may be expected to create more sub-peaks, which clearly disagrees with the experimental result.
Third, an experiment with the quasi-1D channel shifted laterally via an asymmetric gate biasing of the injector and detector was performed. Figures 3(b) and (c) show the result with the quasi-1D channel of the injector shifted laterally by applying an offset of −0.2 and −0.4 V, respectively. The asymmetrically biased injector and the symmetrically biased detector were set to a conductance value of G0. The peak splitting is not affected by the lateral shift indicating the observation is a disorder-free effect. However, it is noticed that both the sub-peaks shift toward higher magnetic field due to a reduction in the effective separation L between the injector and the detector. According to equation (2), a change in L also affects the peak splitting [8]. This observation also highlights one of the limitations of linear focusing geometry where the injector and detector share the central gate. By increasing injector conductance (usually the detector conductance is fixed as is the gate voltage applied to the central gate), it inevitably introduces a lateral shift in the quasi-1D channel. Therefore, a change in peak position and splitting of peaks should be observed in the linear focusing device as well due to the unintentional lateral shift of the quasi-1D channel.
Four, the satellite peaks which differ from the focusing peaks in figure 1 are due to scattering centres which disappear after illuminating the device with a red LED at base temperature, however, the split in odd-numbered focusing peaks remains almost unaffected by the illumination, as shown in figure 3(d), which shows that the observed effect is disorder-free.
II. In-plane magnetic field dependence
To confirm the split peaks in our experiment are spin related, we performed focusing measurements in a tilted magnetic field. The experiment was performed in a 3He cryostat with rotatable sample holder at a base temperature of 300 mK. When the angle Θ between the 2DEG plane and magnetic field equals 90°, the field is normal to the 2DEG and when Θ decreases towards 0 an in-plane field component is introduced.
Results shown in figure 4(a) correspond to first (left panel) and second focusing peaks (right panel) at different Θ, respectively. The injector conductance is set at 0.8G0 at zero in-plane magnetic field. The two sub-peaks of the first focusing peak are pronounced in the whole range studied here with the peak splitting increasing as Θ decreases. It may be noted that as the in-plane component of magnetic field was gradually increased, the split in the first focusing peak was found to increase. Interestingly, the right sub-peak of the first focusing peak shows a disappearance-reappearance behaviour against increasing in-plane field and this behaviour is similar to result in hole gas [13]. The graph on the right panel of figure 4(a) shows the effect of in-plane magnetic field on the second focusing peak which splits into two when Θ is below 27° (corresponding to a total magnetic field around 0.5 T). It is important to note that the summation of heights of two sub-peaks of the second focusing peak is almost equal to its united counterpart.
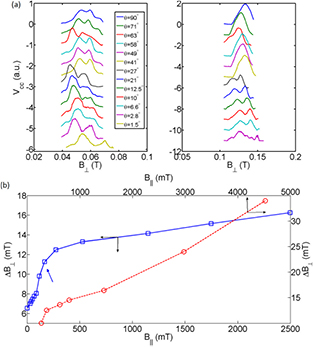
Figure 4. In-plane magnetic field dependence of focusing peak. (a) Left and right panel are for first and second focusing peaks at different in-plane magnetic fields, Θ is the angle between the magnetic field and the 2DEG plane. Splitting of the first focusing peak is enhanced with decreasing Θ, i.e. enhanced parallel component. The second peak starts splitting when Θ is 27°. (b) Splitting of first focusing peak (blue-square markers) and second peak (red-circle markers) against in-plane magnetic field. A sharp change in splitting rate of the first focusing peak is seen when  is around 0.2 T as indicated by the blue arrow.
Download figure:
Standard image High-resolution imageFigure 4(b) shows a plot of splitting of the first and second peaks  against in-plane magnetic field
  . It is noted that the splitting of the first peak experiences a sharp increase from 6.5 mT to around 11.5 mT when the in-plane field is increased up to 200 mT and then gradually rises to 16.3 mT in large in-plane field regime. The splitting of the second focusing peak follows a seemingly linear trend from 10–34 mT. The in-plane magnetic field dependence confirms that our observation is spin-related. The non-linear in-plane field dependence of peak splitting (or spin splitting) is an indication of competition between SOI and the Zeeman splitting [6, 26], and the theory [6] further suggested that the splitting should vary rapidly in the small field regime (where the SOI dominates) and slowly in the large field regime (where the Zeeman splitting dominates), which agrees well with our experimental result. Moreover, the anisotropy of Fermi surface (altering from a sphere to an ellipse in momentum space) in the presence of a large in-plane magnetic field [27, 28] may also contribute to the non-linear behaviour.
We can estimate the height of the two sub-peaks by reconstructing the first focusing peak with two Lorentzian peaks as shown in figure 5(a). The asymmetry between the sub-peaks shows that the spin polarization drops to zero at the conductance plateaus and remains finite elsewhere as shown in figure 5(b) which agrees with theoretical prediction [21, 22] and is expected when the observed sub-peaks are spin related.
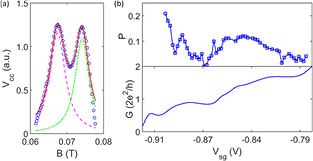
Figure 5. Spin polarization of injected electrons. (a) The focusing peaks are reconstructed with two Lorentzian peaks in order to extract peak height accurately. The blue-round markers are raw data for injector conductance at G0, the red solid line is the reconstructed peak, the magenta-dashed and green-dotted lines are fitting for the two sub-peaks. (b) Extracted spin polarization P as a function of injector conductance,  , where A1 and A2 are amplitudes of the two sub-peaks obtained from the fitting in plot (a).
Download figure:
Standard image High-resolution imageIII. Discussion on peak splitting
The splitting of odd-numbered peaks and united single even-numbered peaks [19, 20] together with the non-linear in-plane field dependence of the peak splitting [6] are indications of the SOI as shown in figure 6. The Fermi surface splits into two in the presence of SOI for spin-up and spin-down states, respectively. For the first focusing peak, the injected electrons follow two Fermi surfaces according to their spin orientation, as a consequence the cyclotron radii are different for the two spin states and two focusing peaks are expected. However, the situation changes dramatically for the second focusing peak where a reflection at the boundary is involved. If the incident angle of such reflection is ∼0°, which is crucial for the observation of a single second peak, the momentum k changes to −k while the spin orientation remains preserved [19, 20]. The swap of momentum together with the preservation of spin orientation will result in hopping between inner and outer Fermi surfaces as shown in figure 6(b). The spin-down electrons will initially occupy the inner Fermi surface so that they have smaller cyclotron radius. After the reflection they take the outer Fermi surface which corresponds to a larger cyclotron radius. On the other hand, the spin-up electrons will hop from outer to inner Fermi surface after the reflection. The hopping between the two Fermi surfaces eventually results in the re-union of the two spin states at the detector. If the splitting is due to linear Rashba SOI, the peak splitting  relates to the spin–orbit strength as below [19, 20],
where  is the electron effective mass, α is the Rashba coefficient and it estimated to be
  eVm in our devices. The estimated Rashba coefficient is considerably larger than the previous report in a GaAs electron gas [10] (and references within [10]). On the other hand, if the splitting is due to k3 SOI [6], the estimated peak splitting ∼23 μeV (with
  mT) agrees well with theoretical prediction [6] ∼20 μeV (with
  mT; see figure 1 of [6]). The difference in values might be due to the smaller electron concentration considered in [6]. Since all the devices were fabricated from the same wafer, therefore, in principle all the devices should exhibit the similar SOI (peak splitting). However, the experimental result reveals that the focusing spectrum depends on the shape of the injector.
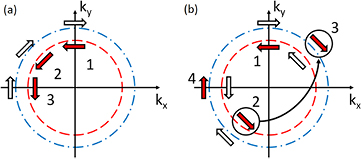
Figure 6. Focusing in k-space in the presence of SOI. The red and white arrows represent the spin-down and spin-up states, respectively. (a) Schematic for the first focusing peak; here the electrons travel along position 1–3. (b) Schematic for the second focusing peak; the electrons travel along position 1–4. The thick black arrow highlights the scattering event at the boundary.
Download figure:
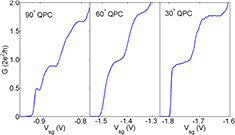
Standard image High-resolution imageThe shape of the injector primarily affects the spin polarization which is manifested as a change in the shape of the 0.7 conductance anomaly [21, 22, 29] as shown in figure 7. Conductance plateaus are well defined for 90°, 60° and 30° QPC. A pronounced additional feature occurs around 0.5G0 in the 90° QPC, a rather faint 0.7 structure is observed in the 60° QPC, and no feature other than the integer conductance plateaus is present in the 30° QPC. It is predicted [29] that in a longer QPC the interaction effect introduce a larger intrinsic spin polarization, so that the 0.7 conductance anomaly tends to appear at 0.5G0. On the other hand, spin polarization generated by a short QPC is negligible and the 0.7 anomaly smears out. In the studied devices, the lithographic defined channel length remains the same, tuning the angle of QPCs dramatically affects the effective length where electrons can strongly interact, which leads to a change in the shape of the 0.7 anomaly.
Figure 7. Conductance of QPCs with different shape. Typical conductance traces of the 90°, 60° and 30° QPC. A dramatic change of the shape in the 0.7 conductance anomaly is observed.
Download figure:
Standard image High-resolution image
It appears that the extent to which the 1D electrons are polarized alters the magnitude of the 2D SOI. A detectable SOI (observable via the peak splitting) is triggered with injected partially spin polarized electrons while a small SOI (lack of peak splitting) is obtained with unpolarized injection, indicating the possibility of modulating the SOI in the 2DEG via injection of the different spin species. A recent theoretical work suggested the connection between the 1D wire and 2D reservior can affect the experession of the SOI [30]. It is an open question as how this modulation occurs in a heterostructure, though we speculate the dynamic nuclear polarization which is directly proportional to spin polarization of the injected electrons [31] might be a possible mechanism.
Conclusion
In conclusion, we have demonstrated that interaction between electrons in quasi-1D channels leads to a finite spin polarization which in turn modulates the spin–orbit interaction. It is found that the spin–orbit interaction can be enhanced by injecting a spin polarized current into the 2DEG. The results provide new information on the zero-field splitting and correlation with related phenomena such as the spin Hall effect and magnetic injection. The evidence on engineering the spin orbit interaction in GaAs electron gas is a step towards realizing high quality spin-based systems which can selectively control the spin polarization and SOI. The results will stimulate further research work into the emerging areas of quantum technologies and spintronics which are closely linked to each other.
Acknowledgments
The work is funded by the Engineering and Physical Sciences Research Council (EPSRC, UK).