
Abstract
The depth-resolved chemical structure and magnetic moment of  , thin films grown on Si(1 1 1) have been determined using x-ray and polarized neutron reflectometry. Bulk-like magnetization is retained across the majority of the film, but reduced moments are observed within 45
 of the surface and in a 25
 substrate-interface region. The reduced moment is related to compositional changes due to oxidation and diffusion, which are further quantified by elemental profiling using electron microscopy with electron energy loss spectroscopy. The accuracy of structural and magnetic depth-profiles obtained from simultaneous modeling is discussed using different approaches with different degree of constraints on the parameters. Our approach illustrates the challenges in fitting reflectometry data from these multi-component quaternary Heusler alloy thin films.
Export citation and abstract BibTeX RIS

Original content from this work may be used under the terms of the Creative Commons Attribution 3.0 licence. Any further distribution of this work must maintain attribution to the author(s) and the title of the work, journal citation and DOI.
1. Introduction
The combination of magnetic and semiconducting properties in hybrid materials or heterostructures can underpin new spintronic device functionalities [1, 2]. The epitaxial compatibility between ferromagnetic metals, with TC well above room temperature, and mainstream semiconductors [3–6] may open new routes to overcome the generally observed low Curie temperatures in single-phase ferromagnetic semiconductors [7, 8]. For spintronics applications, half-metallic ferromagnetic (HMF) materials are particularly attractive in this context: their high Fermi level spin polarization (theoretically 100%) should boost the efficiency of many spintronic devices. Among the HMF materials, the Heusler alloy family Co2YZ (Y = Fe, Mn, etc and Z = Al, Si, Ge, etc) has been the most widely studied. The fully ordered unit cell consists of four inter-penetrating fcc sub-lattices, two occupied by Co, one by Y and one by Z elements ( structure). Full Y-Z sublattice disorder leads to the
  structure, for which Fermi level tuning with respect to the minority spin gap has been demonstrated experimentally [9]. Together with the high spin polarization, these properties are important to prevent the bulk half-metallicity being lost at room temperature [10, 11]. High quality
  -structured epitaxial films can be grown by low temperature molecular beam epitaxy (LT-MBE) on a variety of semiconductor materials [12–15], which does not diminish their half-metallicity [14, 16, 17].
Although these properties are very promising, the performance of spintronic devices based on HMF-semiconductor heterostructures depends critically on the interface between the two materials. Chemically and magnetically abrupt interfaces are required, and the detailed atomic configuration of the interface can have a profound effect [15, 18, 19] because the spin polarization in HMF thin films can be reduced, or even reversed, by non-ideal atomic configurations at or near their interfaces. For a multicomponent alloy such as  (CFAS) intermixing or chemical segregation can easily cause such effects. The epitaxial substrate can cause strain and seed anti-phase boundaries in the HMF epilayer [20]. Indeed, we have recently investigated such effects at the CFAS/Si(1 1 1) interface: there is clear evidence of strong out-diffusion of Si even after optimized LT-MBE, resulting in the formation of a structurally distinctive Si- and Co-rich region extending some 25
  from the interface [14].
Aberration-corrected scanning transmission electron microscopy (AC-STEM) allows the imaging of interfaces with atomic resolution. High angle annular dark field (HAADF) imaging combined with spectroscopic methods such as electron energy loss spectroscopy (EELS) can further add chemical specificity to such images, but these methods do not probe the magnetic profile. Density functional theory (DFT) can be used to predict the electronic and magnetic effects of non-ideal atomic structures arising at HMF/semiconductor interfaces [15]. However, direct experimental measurement of the depth-resolved magnetic properties of such interfaces and surfaces [21] is an important test of such an approach and is needed for understanding the correlation between the magnetic and chemical interfaces. This knowledge can in turn be used to aid material optimization for different spintronic applications.
In this work we exploit polarized neutron reflectometry (PNR) and and x-ray reflectometry (XRR) coupled with AC-STEM and EELS to probe the structural and magnetic profile of an epitaxial CFAS layer deposited on Si(1 1 1). We pay particular attention to the process of simultaneously modeling the PNR and XRR data (described in section 3) and highlight how rather different models can give fits of similar quality. Reliable modeling of the magnetic interface is achieved, which agrees with our previously published results from AC-STEM and DFT, whereby out-diffusion of Si to Co sites produces an interface region of reduced magnetization some  thick [14].
2. Experimental details
Nominally  thick CFAS films were grown by LT-MBE on
  mm2 Si (1 1 1) substrates using separate sources for Co, Fe, Al and Si to optimize the growth conditions, with the substrate at room temperature [12]. Prior to loading in the growth chamber, the substrates were chemically cleaned with an aqueous 1% HF solution to remove the native oxide. Further details on the sample preparation can be found in [14], which describes the same sample as used in this study.
PNR measurements were recorded at room temperature using a fixed wavelength of 
 on the D17 reflectometer at the Institut Laue-Langevin in Grenoble, France. A 1 T external magnetic field was applied parallel to the sample surface during the measurement to saturate the sample. Complementary XRR from the same samples was performed on a Panalytical X'Pert Pro MRD instrument using
  radiation with an incident slit providing a beam height of 0.075 mm at the sample position. A receiving parallel plate collimator with an angular acceptance of 0.27° was placed in front of a PIXcel 1D Detector.
The reflectometry studies were supplemented by AC-STEM and EELS. Samples were prepared using the cross sectional focussed ion beam (FIB) technique [22] before HAADF STEM images were obtained using a Nion UltraSTEM 100 microscope operating at 100 kV. Elemental composition profiles were obtained via EELS using a Gatan Enfina spectrometer within this microscope [14]. Quantitative elemental profiles were obtained by integrating EELS intensity maps (presented here for the interface region), while the EELS intensity images themselves can be interpreted qualitatively (done here for the near-surface region). The CFAS lattice parameter was measured using x-ray diffraction (XRD) with (2 0 0) and (4 0 0) reflections, as well as by STEM. Because of the  crystallographic ordering, all (1 1 1)-type reflections are systematically absent. Vibrating sample magnetometry (VSM) was used to assess the total magnetization of the CFAS film. The VSM was calibrated using Pd and hysteresis loops were recorded at room temperature, with the diamagnetic signal from the Si substrate removed by fitting a linear function to the high field data.
3. Reflectometry
Reflectometry studies are performed at grazing incidence, close to the origin of reciprocal space. Here the scattering vector,  [23], is small and insensitive to the atomic crystalline structure. The scattering is considered to be in the optical regime with the scattering potential defined by the refractive index, n. For x-rays the refractive index is proportional to the number density of the electrons [24], which have a form factor fi:
Here NA is Avogadro's number, re the classical electron radius and λ the x-ray wavelength,  the density, Ai the atomic mass and
  with Zi the atomic number and
  and
and  the anomalous corrections of element i which are related to the dispersion and absorption of the wave-field, respectively. The summation is over all the elements in the unit volume described by
  and laterally averaged over the sample. For neutron-nuclear scattering, the refractive index depends primarily on the laterally averaged coherent scattering cross section, bi, for each isotope, i;
For materials considered here, the incoherent and absorption neutron cross sections are several orders of magnitude smaller than the coherent scattering length, such that these contributions can be neglected. A reflectivity scan probes the normal component of the scattering vector as a function of angle and wavelength. The result is the Fourier transform of the refractive index, which is normally expressed as the scattering length density (SLD). For a multi-component material with density ρ, the x-ray SLD (XSLD) is given by
[23] where J is the number of different elements or isotopes of atoms i in the compound, Ai is the atomic weight of the element and NA is Avogadro's number. Equivalently, the number density N can be obtained from the lattice parameters as the inverse of the unit cell volume. The neutron SLD (NSLD) is found by replacing fi with bi in equation (3). To facilitate direct comparisons the XSLD and NSLD are both converted to units of  .
.
The phase problem precludes determining the structure directly and so models are generated from which the scattering is calculated. Our data have been fitted by repeated solving of the Schrödinger equation within the Parrat formalism using the freely available GenX package [25]. Refinement protocols based upon a figure of merit (FOM) are then used to adjust the model parameters to achieve a satisfactory fit to both x-ray and neutron reflectivity curves simultaneously. The FOM used in this paper is ![${\rm FOM}_{\log R1}\, =\, \sum_{i} [\vert \log_{10} (\sqrt{Y_{i}})\, -\, \log_{10}(\sqrt{S_{i}})\vert ] / \sum_{i} [\log_{10}(\sqrt{S_{i}})]$](https://content.cld.iop.org/journals/0953-8984/30/6/065801/revision3/cmaaa4c8ieqn023.gif) , where Yi and Si represent the data and the simulation respectively. This FOM is suitable for data spanning several orders of magnitude giving every data point equal weight and allowing a more balanced weighting over both probes. The sample is modeled as a series of slabs of defined thickness and refractive index. To account for roughness and/or inter-diffusion in such slab models of real layered structures, the Fresnel coefficients are modified by a Gaussian Debye–Waller factor.
, where Yi and Si represent the data and the simulation respectively. This FOM is suitable for data spanning several orders of magnitude giving every data point equal weight and allowing a more balanced weighting over both probes. The sample is modeled as a series of slabs of defined thickness and refractive index. To account for roughness and/or inter-diffusion in such slab models of real layered structures, the Fresnel coefficients are modified by a Gaussian Debye–Waller factor.
This commonly adopted approach to modeling reflectometry data often masks subtleties. Each layer or slab has an scattering length derived from its composition and density (equation (3)). It is not possible, therefore, from a single reflectivity measurement to separate these two parameters. In the case of complex alloy epilayers, care must be taken to ensure that appropriate values of the composition and density are used. The MBE process can often result in slightly non-ideal or non-uniform compositions, due to both film growth kinetics and intermixing with the substrate. Furthermore, epitaxial stress can contribute independently to changes in density which vary through a film as a consequence of different strain relaxation mechanisms. Native oxides or other surface effects can change lattice parameters in the uppermost few nm of a film [26]. It is then important to measure any changes in both in-plane and out-of-plane lattice parameters. One approach to separate the composition and density is to exploit the anomalous dispersion corrections in x-ray scattering and measure the reflectivity as a function of energy. Alternatively, the different sensitivities to the composition through fi and bi in separate XRR and PNR experiments, can allow the composition to be determined. Both of these approaches rely on the fact that the density will be a common parameter in any co-refined fit.
For magnetic materials the picture needs to take into account the neutron polarization. Although unpolarized x-rays are generally insensitive to the magnetic moment of the material, the neutron spin couples directly to any magnetic induction in the sample. For moments collinear to the external field direction (saturated case), the neutron spin is conserved on scattering and the coherent cross-section can be expressed as  where
where  is the magnetic contribution, with the magnetization m expressed in units of
  and
and  . The magnetic scattering length bm is added or subtracted from the nuclear scattering length for parallel or antiparallel alignment of neutron spin and magnetic moment, respectively. Thus, the composition, density and magnetic moment all contribute to the overall SLD which can be decomposed into separate structural and magnetic profiles. A combined x-ray and polarized neutron analysis should allow these parameters to be extracted if a unique model can be determined.
4. Modeling and results
The lattice parameter of the CFAS sample was measured using XRD by Kuerbanjiang et al [14] as 5.68  , also in agreement with the XRD measurements of Nakatini et al [27]. No evidence was found for distortion due to epitaxial stress. The magnetic hysteresis loops obtained in VSM, recorded with the field applied along the easy
  and hard
  in-plane crystallographic directions, are shown in figure 1. Additional MOKE measurements (not shown) confirm the in-plane magnetocrystalline anisotropy of the sample. Along the easy axis, the magnetization reversal is sharp and square (inset to figure 1) with coercive field
  Oe.
Oe.

Figure 1. Magnetometry data for CFAS film on Si(1 1 1) aligned along the easy axis  in red, and along the hard axis
  in black.
  emu. The inset shows data along the
  direction, focussed to show the square hysteresis loop and low coercivity
  Oe.
Oe.
Download figure:
Standard image High-resolution imageIn order to explore the depth-dependent magnetization via PNR and XRR, two starting models of the sample were constructed. The first model is based on a typical slab structure, as discussed in section 3, and is called model 1. This model comprises semi-infinite Si bulk, the CFAS film, and separate surface and substrate-interface regions, according to a slab structure of substrate/interface/CFAS/surface~1/surface~2. The interface region was defined by a single additional slab while the surface region required two slabs to obtain good fits. For model 2, the same layer structure is used, but the substrate-interface structural information is directly replaced by profiles obtained from AC-STEM and EELS. The depth dependent composition determined from EELS [14] was converted point-by-point into corresponding total f and b scattering lengths using the relative concentration and tabulated elemental values for x-rays with energy 8.05 keV and for neutrons, assuming the most abundant isotope. The EELS composition and resulting SLs are shown in figure 2. Using the nominal composition of CFAS, the scattering length for neutrons is  , and for x-rays
  , with substantial real and imaginary parts. To incorporate the derived profiles into the fitting package the SLs were parametrized using a double Boltzmann function. This was chosen arbitrarily for its simplicity and ease of coding into GenX and is not intended to represent any physical processes associated with intermixing or out-diffusion. Additional single Boltzmann functions with adjustable width and position allowed the density profile and magnetic contributions of the interface region to be incorporated into the final SLD according to equation (3). Inspecting the EELS profiles in figure 2 reveals clear Si out-diffusion and some smearing of the interface, but also a definite structure to the Co and Si profiles with two distinct composition regions ('sub-layers') at the Si/CFAS interface.
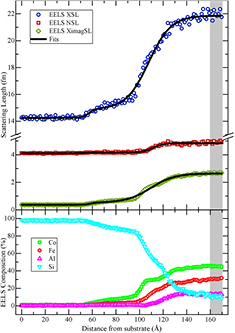
Figure 2. Scattering length (SL) profiles at the CFAS/Si(1 1 1) interface (upper panel, symbols) and double Boltzmann function fits (solid lines). Both x-ray (real part: blue circle, imaginary part: green diamond) and neutron (red square) SLs were calculated. The lower panel shows the EELS composition data from which the SL curves were obtained. The composition of the main CFAS film was extracted by averaging the grey shaded region of the EELS data.
Download figure:
Standard image High-resolution imageWe also used the EELS data to define the bulk CFAS film composition in model 2: it is Co 46%, Fe 30%, Al 14% and Si 10% with an error of 5%, but only fixed concentrations have been used in the modeling. This differs slightly from the ideal composition which was used in model 1, namely Co 50%, Fe 25%, Al 12.5% and Si 12.5%. For model 2, the CFAS layer structure and oxidized surface were modeled with slabs as in model 1. During the fitting, in both models, the CFAS composition was fixed and only density and magnetic moment were allowed to vary along with the width and roughness of the slabs.
Figure 3 shows the PNR and XRR data, where PNR+ and PNR− denote the neutron polarization which is respectively parallel or anti-parallel to the external magnetic field. For both models all data sets are fitted simultaneously to facilitate the decoupling of composition, magnetism and density through the different sensitivities of the two probes. Both model 1 and model 2 clearly yield good fits to all the data, with a very slightly better FOM for model 1. The SLD profiles corresponding to the fitted models are shown separately for x-rays (XSLD), neutrons (NSLD) and magnetic moment (MSLD) in figure 4 (where model 3 will be discussed later). The location of the origin of the z-scale in figure 2 is somewhat arbitrary, so to facilitate comparisons between the SLDs we choose to fix the z position of the center of the well-defined magnetic layer. This approach avoids offsets in the apparent z = 0 position caused by substrate roughness.
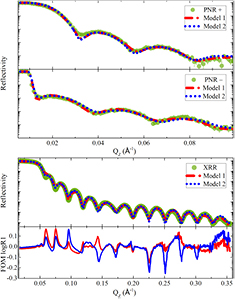
Figure 3. Simultaneous fit of PNR and XRR data for CFAS on Si(1 1 1). Data points are represented by green circles, fits to the data corresponding to model 1 and model 2 are represented by red dashed and blue dotted lines respectively. The lower graph is the FOM of the corresponding fits to the XRR data, shown here for comparison between model 1 and model 2.
Download figure:
Standard image High-resolution image
Figure 4. XSLD, NSLD and MSLD profiles obtained from fitting the reflectometry data with different constraints. Red dashes represent model 1, blue dots model 2 and the black line model 3. The grey region highlights the 25  interface region of model 2 taken from the centre of transition region between slab layers.
Download figure:
Standard image High-resolution imageTurning to the near-surface region, elemental maps based on EELS for Co, Fe and O are shown in figure 5, along with an AC-STEM image. There is a clear native oxide region near the surface around  thick, which is not crystalline and is deficient in Co. In fact the surface layer appears to be composed of mostly Fe and O, and the enhanced Fe concentration extends slightly beneath the oxide layer.

Figure 5. AC-STEM HAADF image and Co, Fe and O EELS maps of the near-surface region of a CFAS film. Yellow-red shows high intensity, blue-green low intensity.
Download figure:
Standard image High-resolution image
5. Discussion
Models 1 and 2 are based on slightly different assumptions, which highlight the coupling of the parameters in the fitting process: they differ in the compositional profile of the interface and in the assumed bulk film composition. This is reflected in the optimized XSLD and NSLD profiles being different in magnitude and shape (figure 4). However, the MSLD shapes are very similar, suggesting that the decoupling of magnetic profiles has been successful. The magnetic thickness of the CFAS layer is  with an apparent non-magnetic substrate interface layer extending over approximately
  (shaded region in figure 4). This length scale is similar to that derived from AC-STEM and DFT in our previous report [14], explained by out-diffusion of Si and its preferential replacement of Fe. As progressively more Si replaces Fe and Co, the magnetic moment per unit cell decreases steadily.
There is a slight difference in the magnitude of the MSLD in the main CFAS layer between model 1 and model 2. This originates from variations in the number density N, which is the only common structural parameter for all SLDs in the main CFAS film for all probes. Due to the fixed composition, and therefore fixed scattering length, the density may vary to achieve a better overall fit for structure and magnetism. For model 1 the fitted MSLD corresponds to a bulk CFAS magnetization of  which is the ideal value at zero temperature for CFAS according to the Slater–Pauling rule [28]. However, the fitted number density gives an effective lattice constant of 5.89
  , higher than the measured value by out-of-plane XRD, meaning that the volume containing the
  increased as well. In contrast, the MSLD in model 2 corresponds to a magnetization of
  with a lattice constant of 5.78
  . The error included in these values indicates the range of values for which an equivalent FOM was obtained. This illustrates the coupling of the parameters while seeking the best compromise to fit magnetic profiles simultaneously with fixed scattering length profiles for x-rays and neutrons. In order to better compare the fitted moments of the different models, we use the formula unit volume as given by XRD (
 ) to normalize the MSLD to a common density. For model 1 we obtain
  , while using a lattice parameter of 5.68
  and model 2 results in a moment of
  . For further comparison, the total magnetic moment of the sample can be estimated from the VSM magnetization at saturation, with a caveat that these measurements were not simultaneous with the PNR experiments and progressive sample oxidation may have changed the effective volume of ferromagnetic CFAS. In addition, diamagnetic and paramagnetic contributions to the signal are difficult to estimate absolutely and the exact sample volume is difficult to measure. We estimate a room temperature magnetic moment of
  using a sample thickness from the reflectometry fitting together with the measured lattice constant of 5.68
  . This value is in agreement with model 1, while the magnetization of model 2 is at the lower boundary of the error margin.
Despite the similar shape to the MSLD profiles, the XSLD and NSLD profiles are surprisingly different between model 1 and model 2. In particular, the Si/CFAS interface XSLD and NSLD profiles appear quite distinct, and the XSLD and NSLD values differ in the CFAS layer itself. Model 1 fits the intermixed interface region with a large roughness on both the substrate and interface slab, which makes it very ill-defined. In fact, exploring the parameter space of model 1 shows that the interface roughness is coupled to the value of the bulk CFAS SLD: a larger roughness produces a lower NSLD and XSLD. Since the composition is fixed, the lower SLD implies a smaller number density  . This, in turn, requires the fit to increase the magnetism/formula unit to match the neutron magnetic splitting. Therefore, the large roughness appears to be why the XSLD and NSLD values for CFAS are reduced in model 1 when compared to model 2. The composition and shape of the interface region in model 2 is pre-defined from the EELS data, with two sub-layers where the overall lower roughness of the interface produces higher SLD values in the bulk of the CFAS film. With respect to the separation of density, composition and magnetism, the situation is more complex. The difference in composition between the models, does not lead to differences in the x-ray scattering length values due to the similarities in Z such that, for this specific case, the
  must increase to fit the x-ray data. However, the increase in the neutron scattering length, due to the change in fixed composition (taken from EELS), effectively limits the amount that the
  can increase by. To compensate for this, the moment decreases still further, leading to the observation of slightly lower moments than expected. Note, that this does not directly affect the PNR − critical edge for total reflection, which is determined instead by the NSLD of the substrate. The near-surface region is characterized by a strong peak in the NSLD for both models, followed by a lower plateau and quite sharp decline to zero (model 1) or prolonged decline to zero (model 2). There is no near-surface peak in the XSLD, which drops in two main stages, again with a longer decline to zero for model 2. The sub-surface enhancement of the NSLD which appears in both models can be explained with the aid of the EELS analysis. The absence of Co in the surface layer is confirmed in figure 5. This creates many free lattice sites which can be filled with Fe, and there is direct evidence for the enhancement of Fe composition. Since the Fe neutron scattering length is almost a factor of four higher than Co, the NSLD increases. But because Fe and Co have almost identical scattering length f for x-rays, no such peak is expected in the XSLD. The overall thickness of the surface region is around
  which agrees with model 1. The extended surface tail (
 ) in model 2 is likely to be an artifact of the fitting. Macroscopic surface roughness larger than the projected coherence length of the x-ray beam (
 ) and the possibility of surface impurities, causes the need for extra slabs in the model to satisfy the fit of the XRR due to it being weighted by more data points. The FOM plot in figure 3 shows the difference between the data and simulated fit for both model 1 and model 2. This extended surface minimizes the FOM of model 2 by creating a better fit to the first two fringes of the XRR data. Neutron reflectometry is less sensitive to these low density surface variations. However, this interpretation of an extended surface needs to be treated with caution due to the lack of q-resolution in the data, corresponding to an insufficient amount of data points to decouple interference fringes caused by small layers.
The described modeling procedures suggest that fixing the interface composition profile (model 2) has a surprisingly strong effect on the behavior of the remaining layer and surface parameters. Therefore we sought to include the compositional input from EELS in a less strongly constrained model (we did not obtain numerous EELS composition profiles from different regions of the film). The experimental, non-ideal bulk CFAS composition was retained but the fixed interface profiles were relaxed by modeling them with a double slab. This 'hybrid' model, model 3, produced a slightly better FOM than either of the other two models and reproduced the MSLD value of (the freely fitted) model 1. The XSLD, NSLD and MSLD profiles are shown in figure 4. The intermixed interface retains its distinctive sub-layer shape but with overall lower substrate roughness. Both the XSLD and NSLD are very similar in magnitude between models 2 and 3 as expected. By relaxing the constraints on the interface parameters in model 3, the MSLD becomes more similar to that of model 1. We therefore conclude that the best refined sample information is contained within this new model 3. Taking the MSLD of model 3, the measured lattice constant 5.68  [14], and understanding that the formula unit is represented by the EELS composition, we obtain
  . This value is consistent with the VSM results.
6. Conclusions
This work has highlighted how different physical models for CFAS epilayers on Si(1 1 1) can give rise to different SLD profiles, which all describe well experimental PNR and XRR data. This phenomenon is expected to arise for many complex alloy epilayers such as the quaternary Heusler alloys, where composition and density cannot be assumed to be ideal. Here we have used additional chemical profile information from AC-STEM and EELS to help constrain and interpret three different models. These additional constraints provided detailed insights into coupling between the parameters, which would have resulted in a misinterpretation of the data.
An Fe enriched oxidized surface is found which extends over 45  and shows a gradual decrease in magnetization. The structural observation from EELS is confirmed by the SLD profiles from XRR and PNR. Bulk magnetization is retained throughout the bulk of the CFAS layer. However, a standard slab model with ideal CFAS composition did not describe the sub-layer structure of the Heusler alloy / semiconductor interface, which is crucial for spin injection. An alternative modeling approach whereby the alloy composition profile near the interface was fully constrained by EELS chemical profiles provides a more reasonable structural model, but a small ambiguity remains on the value of magnetization due to strong coupling of parameters. A hybrid model, based on EELS composition but allowing optimization of a double-slab interface, fitted the XRR and PNR data with the best FOM and produced an interface structure in agreement with previous observations. The similarity of the magnetic profiles from all models shows that the decoupling of the magnetic structure in the CFAS film was successful. Next to detailed information on magnetically inactive layers, a reliable magnetic moment is obtained for the bulk of the CFAS layer.
Acknowledgments
This work was funded by the Engineering and Physical Sciences Research Council (EPSRC) through Grant Nos. EP/K03278X/1 and EP/K032852/1. The SuperSTEM Laboratory is the UK National Facility for Aberration-Corrected STEM, supported by the EPSRC. We are grateful for the assistance of David Walker and the x-ray Research Technology Platform at the University of Warwick for help in collecting the x-ray reflectivity data.