

Abstract
This work studies the compound nucleus' de-excitation during spallation nuclear reactions, with focus on the behavior of the Coulomb barrier for emission of charged particles and the level density parameter at the fission saddle point, establishing for the first time a relationship between these magnitudes and the level density. This relationship manifests itself through two differential equations explicitly dependent on the excitation energy and the level density parameter of the nucleus after the emission of light particles. These equations were implemented into the CRISP code and used to simulate proton induced spallation reactions on  and 238U, respectively, comparing the results with data coming from GSI experiments as well as from other codes and obtaining satisfactory results that confirm the reliability of the new models.
Export citation and abstract BibTeX RIS
1. Introduction
The knowledge of level densities is crucial for testing the validity of models of nuclear structure, and a lot of theoretical and experimental work has been made [1, 2], leading to several models to fit experimental data. These models take into account the shell and pairing effects, as well as the rotational–vibrational character of nuclei, which, in one way or another, has been implemented in several computational codes [3], especially those dedicated to the study of spallation reactions.
Based on the close relationship between the nuclear structure and the level density, the latter must determine, in some way, the behavior of most of the quantities, such as the Coulomb barrier (CB) for charged particles' emission and the level density parameter at the fission saddle point. In this respect, CB measures the amount of energy ΔΛ needed to put or remove one unit of electric charge from the nucleus, so that for the ground state the electrostatic formula corrected for barrier penetration should be enough to calculate ΔΛ, while for excited states (when the nuclear structure has changed), a dependence on the excitation energy must appear.
A change of the excitation energy means a variation of nuclear temperature, which is related to the level density through its thermodynamic definition. Then it is possible to think about the existence of some relationship reflecting the fact that a change in CB is due to a change in the nuclear structure. Since the level density parameter characterizes the behavior of the level density, it is almost intuitive to try to establish a relationship between the level density parameter at the saddle point and the level density model used in the calculations.
Nevertheless, both quantities commonly receive the treatment of adjustable parameters in the codes devoted to studying spallation nuclear reactions [4, 5] and their relationship with the level density remains unexplored. Thus, CB has the form VC = V0f(U), with V0 = κVE, where VE comes from electrostatics and κ is a correction that takes into account the barrier penetration (tunneling effect). The factor f(U) is another correction introduced to reflect the expected reduction of the barrier due to the expansion and surface oscillations of an excited nucleus, which is treated in several ways [6, 7] that, in general, are not related with the level density. Something similar happens with the level density parameter at the fission saddle point af.
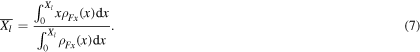
That is why the objective of this work is to study the relationship between the level density and both the Coulomb barrier for charged particles' emission and the level density parameter at the saddle point. In this regard, expressions corresponding with the partial widths for light particles' emission and occurrence of fission will be used together with the level density model of Egidy and Bucuresco [8], based on the back shifted Fermi gas (BSFG), to derive two differential equations that allow the calculation of these magnitudes.
The structure of the present work is as follows: sections 2 and 3 develop new methods for calculation of CB and the level density parameter at the fission saddle point, respectively. Section 4 describes the features of the statistical module of the CRISP code, as well as the changes made to incorporate the ideas of sections 2 and 3. Section 5 shows the results of the simulations using the new version of the code. Finally, section 6 highlights the results of the work, together with an assessment of them, including a comparison with other de-excitation models and establishing some directions for future work and development of the code.
2. Coulomb barrier calculation
Historically, spallation nuclear reactions have been treated by a mechanism which includes two stages [9]: a sequence of binary collisions initiated by the incident nucleon, known as the intranuclear cascade (INC), followed by the decay, through several channels, of the excited compound nucleus. The second step of the model takes into account the evaporation-fission competition, and the partial width associated with the emission of light particles is [10, 11]

where Bl is the light particle's separation energy, ρP and ρF are the level densities of the nucleus before and after the emission, respectively, r0 is the Bohr radius, A the mass number before the emission, ml the mass of the emitted particle and gl the occupation number, this expression strongly depends on both the level density ρ and the Coulomb barrier height Vl.
After some operations, it is possible to write (see the appendix)

where  ,
,  and
and

being U the excitation energy, while al and EFl are the level density parameter and the energy correction after emission of the particle l (using the subscripts n, p and a for neutrons, protons and alpha particles, respectively).
The light charged particles' to neutrons' emission ratio is

where

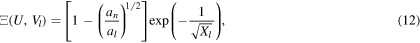
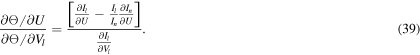
while In is the same as equation (5), changing Xl for  . Now, considering Θ = Θ(U, Vl) leads to (see the appendix)

where
For Xl values such that  arises the following expression,

as long as the derivative of Vl respect to U is (see the appendix)

Equation (9) has two unknowns, namely, dVl/dU and Ξ(U, Vl), so more information is needed to solve the problem. This information comes from the assumptions made on the asymptotic behavior of Vl. In this way, assuming that Vl is a monotonically decreasing function which tends to a stationary value at high energies results in

generalizing the accepted idea that CB decreases with increasing excitation energy [6, 7]. If one accepts the conditions given in (10), then it is possible to estimate Ξ(U, Vl) as described below.
At high energies equation (9) takes the form

Combining equation (11) and the exponential introduced in equation (8) leads to the following proposal:
finally getting that
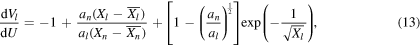
which allows the calculation of the Coulomb barrier height as a function of the excitation energy, starting from the initial condition Vl(U0) = V0 = κVE, with  , being
  the highest value between Bl and Bn, whilst κ is 0.70 for protons and 0.83 for alpha particles.
Figure 1(a) shows CB for proton emission as a function of the excitation energy for several nuclei, obtained from equation (13), while figure 1(b) shows the same, but using a different approach given by equation (28) (see section 4). Comparing both figures it is concluded that for a given nucleus at a certain value of the excitation energy, equation (13) produces lower values of CB, what increases Xl in equation (2) and consequently Θ(U, Vl). So that, if implemented within a computational code, equation (13) should lead to higher values of the probability of emission of light charged particles (see section 5).

Figure 1. Coulomb barrier height for proton emission. (a) Values obtained using equation (13). (b) Values obtained using equation (28).
Download figure:
Standard image High-resolution imageOf course, the choice of Ξ(U, Vl) remains, to some extent, arbitrary, because the total derivative of Θ(U, Vl) is unknown. Nevertheless, regardless of the selection, Ξ(U, Vl) will always become important at high energies, to compensate for the behavior of the first term of the right side of equation (9), so that it is zero at low energies. Then it is possible to say that the curves Ξm(U, Vl) are, at least, close in the sense of zero-order proximity, and the absolute value of the difference between any two functions of the set is small [12].
A natural choice would be Ξ(U, Vl) = 0, but this option, together with the conditions of equation (10) would force the level density parameter to be a function of the excitation energy, in such a way that

which is not the case with this work, where it is independent of the excitation energy. The same need for an energy-dependent level density parameter has been previously pointed out as a necessary condition to account for the damping of the shell effects [13].
Now it is possible to understand why the function Ξ(U, Vl) remains with a certain degree of arbitrariness. It has to guarantee compliance with the conditions given in (10), regardless of the choice of the level density parameter.
3. Level density parameter at the fission saddle point
The partial width associated with the occurrence of fission has the form [14]

where  is the nuclear level density at the saddle and Bf is the fission barrier height, while the ratio between the widths of fission and neutron emission is

with

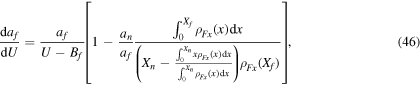
being Xf = af(UP − Bf). Considering Θf = Θf(U, af) and following a similar path to the one taken in section 2 it turns out that
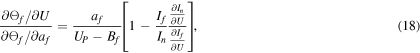

whilst

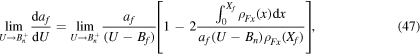
This time, the condition imposed to af is that it must be a stationary function at high energies; that means

which is fulfilled by equation (18) if the additional condition

is also taken into account. Then it is possible to establish that

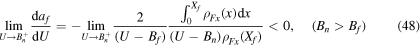
Figures 2(a) and (b) show the level density parameter at the fission saddle point and the Γf/Γn ratio for several nuclei. In figure 2(a) the behavior of af in the low energy limit is determined by the relationship between the neutron separation energy Bn and the fission barrier Bf, obtaining that (see the appendix)


where Bf/n is the highest value between Bn and Bf.

Figure 2. (a) Level density parameter at the saddle point as a function of the excitation energy. Values obtained using equation (23). (b) Γf/Γn ratio for several nuclei. Values obtained using equation (16).
Download figure:
Standard image High-resolution imageEquations (24)–(26) were obtained considering that for values of Xn and Xf less than one the level density becomes constant [8]. These equations, together with the information presented in table 1 allow to say that for those nuclei with Bf > Bn the values of af decrease when  (daf/dU > 0). For 238U, although Bf > Bn, it also happens that Bf ≈ Bn; then a mixed behavior occurs, initially daf/dU < 0 and af grows while
  reaching a maximum, after which an extremely abrupt fall begins (not shown in the figure). Finally, for 232Pu the value of Bn is appreciably greater than Bf, then daf/dU < 0 and af grows while
  , being the growth much faster than in the case of 238U.
Table 1. Fission barrier Bf and neutron separation energy Bn for several nuclei. Values in MeV.
| 232Pu | 238U | 232Th | 208Pb | 197Au | 184W | |
|---|---|---|---|---|---|---|
| Bf | 3.60 | 5.70 | 7.10 | 31.70 | 28.80 | 23.50 |
| Bn | 7.12 | 5.60 | 5.68 | 6.10 | 6.61 | 6.64 |
Shell effects are also observable in figure 2(a), which shows that at high energies af seems to be directly proportional to the mass of the nucleus, while below 80 MeV the proximity to the closed shell reduces these values, in such a way that for a given energy, the value of af for 208Pb is the lowest when compared with 197Au and 184W. In the same way, the ratio Γf/Γn for 208Pb is always the lowest in figure 2(b).
Other calculations of af and Γf/Γn can be found in [13, 15, 16] and references therein. In [15] the general behavior of af for 240Pu is similar to the curve for 232Pu presented here in figure 2(a). The same happens with the ratio Γf/Γn for 202Pb in [15] and 208Pb in figure 2(b), with the particularity, that the values corresponding to 208Pb are much lower, which could be related to its doubly magical character. References [13, 16] offer data on the level density parameters as well as on the models to calculate them. The level densities at the fission saddle points are calculated according to the microscopic HFBCS model [17], (which includes shell, pairing and deformation effects related to the fission barrier structures in a consistent manner) and can be quantified in terms of the ratio af/a between the level density parameter at the fission saddle point and the level density parameter of the equilibrium ground-state configuration.
The use of a microscopic model of the level densities should lead to a more consistent description of the saddle points than that offered by phenomenological models such as the BSFG [13]. Then it is not surprising that when making a comparison between the results of both models some discrepancies are observed, mainly at low energies. Such is the case of figure 3, which shows the ratio af/a for 238U reported in [13] together with the one obtained in the present work. At high energies, the results of both models should be the same. It is important to note that the model used in [13] does not consider the possibility of the damping of the collective effects at increasing excitation energies, which could lead to a greater than expected difference between the models.

Figure 3. af/a ratio for 238U. Results of the present work together with data taken from the Reference Input Parameter Library-2 (RIPL2) [13, 16].
Download figure:
Standard image High-resolution image4. The CRISP code
CRISP (Colaboração Río-Ilhéus-São Paulo) [18] is a computational code to simulate nuclear reactions at intermediate energies (40 MeV–4 GeV). It is composed by several modules dedicated to the study of the different stages in which a nuclear reaction is divided (INC [19], evaporation–fission competition [20] and fission fragments distribution [21, 22]). There is also possible to study multi-fragmentation reactions. All modules are under continuous study and development [23–29].
The statistical module of CRISP works with an excited nucleus coming from the INC, calculating several magnitudes, such as the separation energies of the light particles to be emitted (neutrons, protons and alpha particles), the Coulomb and the fission barrier height, the level density parameters corresponding with the initial nucleus, the fission saddle point and the residual nucleus after emission. Then the probabilities of fission and light particles' emission are calculated, and one of the outputs is randomly selected. In the case of fission, the process stops, saving the data of the fissioning nucleus. For light particles' emission, the program recalculates all the magnitudes. This process continues until the excitation energy of the residual nucleus is below the neutron binding energy, when events such as gamma emission become competitive.
Although it is possible to find a lot of information about the code in the references, it is useful to highlight some of its characteristics. In this way, for nuclei such that  the fission barrier height is calculated using data reported at the Reference Input Parameter Library-2 (RIPL2) [16], whereas that the following parameterization is valid when

Where  . This parameterization is based on the work of Möller and Nix [30, 31]. Here, f0 is a function of the critical fissility and also other parameters that take into account the competition between nuclear and Coulomb forces, ES defines the surface energy of the nucleus, and C(A) is introduced to include the shell effects. In the case Z < 68 fission is not considered.
The code includes two different forms of the level density: one very similar to the one used by Dostrovsky [5–7] and another based on the BSFG model, presented by Egidy and Bucuresco [8], in which the nuclear masses allows the calculation of the level density parameter in two ways: independent and dependent on the excitation energy. In this work, for the case of BSFG level density, was adopted the variant in which the level density parameter is independent of the excitation energy.
For Dostrovsky parameterization (DP), the level density parameter at the fission saddle point is calculated according to af = rf an where rf is a dimensionless parameter depending on Z2/A. On the other hand, af for BSFG parameterization (BsP) is determined using equation (23). Coulomb barrier height for DP comes from

where Blig is the nuclear binding energy. Whereas that in BsP the Coulomb barrier height is calculated using equation (13), being also possible to link equation (28) with BsP.
The excitation energy after  steps of the evaporation chain is

where  is the kinetic energy of the particle, which is obtained attending to the level density parameterization. In the case of DP, is determined considering a Maxwell distribution [10]. On the other hand, to be consistent with the changes made, a different way of calculation of the kinetic energy was adopted for BsP. First, the program generates a random number δ. Then, the integral given by equation (5) is calculated, keeping the same upper limit and changing the lower limit to
  , where Em is the maximum value for the kinetic energy of the emitted particle, given by the condition [10]
  . In the present work it was considered that
  . At this moment an iterative process starts, in which the integral of equation (5) is evaluated, increasing the lower limit xlw, until the moment when
  . Finally, the kinetic energy is determined from the condition

5. Results
In order to know the influence of the new parameterization, equations (13), (23) and (30) were implemented into the CRISP code, and used to simulate the reactions  and
and  at 1000 MeV. Firstly, the INC, whose resultant nuclei were used as entry of the evaporation phase. Figure 4 shows some general features of the nuclei at the beginning of evaporation for these reactions.

Figure 4. Residual nuclei at the beginning of evaporation (coming from INC).
Download figure:
Standard image High-resolution imageFigures 5(a) and (b) show the average values of the number of emitted neutrons, protons and alpha particles as a function of the excitation energy of the initial residual nucleus, which correspond to three parameterizations of CB: V0, with no energy correction, VD, given by equation (28) [6, 7], and VN, obtained from equation (13). In both cases, the number of neutrons remains more or less the same, no matter the parameterization, partly because the barrier height for neutrons is always zero. V0 and VD parameterizations lead to a slightly higher number of neutrons until energies around 500 MeV when VN starts to give higher values. For protons, VN offers the highest multiplicity, while V0 and VD give similar results. In the case of the alpha particles, VN also leads to the highest values. So the use of the VN parameterization produces the highest values of the average number of emitted protons and alpha particles, what is in agreement with the predictions made in section 2. Table 2 confirms these ideas, showing the multiplicity of the particles emitted during the evaporation.

Figure 5. Average values of the number of emitted particles as a function of the excitation energy of the initial residual nuclei. Fission was not considered. (a) p + 208Pb at 1000 MeV. (b) p + 238U at 1000 MeV.
Download figure:
Standard image High-resolution imageTable 2. The multiplicity of the emitted particles during the evaporation phase of the reactions p + 208Pb and p + 238U at 1000 MeV. Results obtained using three parameterizations of CB together with the BsP without considering fission. (Values in MeV.)
| Reaction | p + 208Pb | p + 238U | ||||
|---|---|---|---|---|---|---|
| Model | V0 | VD | VN | V0 | VD | VN |
| Neutron | 18.06 | 17.89 | 17.27 | 18.92 | 18.83 | 18.17 |
| Proton | 1.76 | 1.72 | 3.62 | 1.26 | 1.25 | 3.25 |
| Alpha | 0.54 | 1.08 | 1.87 | 0.34 | 0.69 | 1.28 |
The content of table 3 is the same as in table 2, but considering fission during the simulations. It is possible to observe how fission reduces the number of emitted particles (indeed, fission represents a sudden cut in the evaporation chain), mainly in the case of 238U.
Table 3. Same as table 2, but considering the occurrence of fission.
| Reaction | p + 208Pb | p + 238U | ||||
|---|---|---|---|---|---|---|
| Model | V0 | VD | VN | V0 | VD | VN |
| Neutron | 18.02 | 17.87 | 17.26 | 7.48 | 8.97 | 13.22 |
| Proton | 1.75 | 1.71 | 3.62 | 0.34 | 0.63 | 2.61 |
| Alpha | 0.54 | 1.07 | 1.87 | 0.10 | 0.37 | 1.04 |
Table 4 and figure 6 show data corresponding with the kinetic energy distribution of the emitted particles. It is possible to observe that, for neutrons, the distributions are very similar; nevertheless, the values given by VN are slightly lower. In the case of protons, the mean values of V0 and VD are very close and higher than VN. Finally, the mean value of V0 for alpha particles is the highest, VN the lowest and VD is between them.

Figure 6. Kinetic energy distribution of the emitted particles, considering fission. (Values in MeV.)
Download figure:
Standard image High-resolution imageTable 4. Mean values of the kinetic energy of the particles emitted during evaporation, resulting from the combination of 3 parameterizations of CB with the BSFG model for level density and considering fission. (Values in MeV.)
| Reaction | p + 208Pb | p + 238U | ||||
|---|---|---|---|---|---|---|
| Model | V0 | VD | VN | V0 | VD | VN |
| Neutron | 2.51 | 2.43 | 2.27 | 3.10 | 3.04 | 2.52 |
| Proton | 12.48 | 11.12 | 5.35 | 14.17 | 12.38 | 5.69 |
| Alpha | 23.51 | 19.79 | 16.04 | 25.70 | 21.40 | 17.39 |
This information, together with the one given in table 2 and figures 5(a) and (b) allows establishing that, the higher the multiplicity of one kind of particle, the lower the mean value of the kinetic energy associated to it when emitted. That's why VN, who gives the highest values of the multiplicity for protons and alphas, leads to the lowest ones for the mean kinetic energy. Then, the almost constant value of the neutron multiplicity occurs because any change in the charged particles' multiplicity, is directly related with a variation on the kinetic energy of this kind of particles, without affecting the neutrons' behavior.
Figures 7 and 8 show the isotopic distribution of the spallation products, obtained using both the previous (VD-dostrovsky) and the new (VN-BSFG) parameterization included in the CRISP code, which are compared with experimental data [32, 33]. Here the junction VN-BSFG determines CB from equation (13), af from equation (23) and the level density parameter of the nucleus before and after the emission is calculated according to [8]; while the coupling VD-dostrovsky obtains VC from equation (28), af = rfan and the level density parameter of the nucleus before and after the emission comes from [6, 7]. The combination VN-BSFG offers the best results, mainly for the reaction  at 1000 MeV. The pair VD-dostrovsky does not correctly reproduce the experimental data because it overestimates the occurrence of fission, which immediately leads to an underestimation of the isotopic distribution of the spallation products.

Figure 7. Isotopic distribution for the reaction p + 208Pb at 1000 MeV. Experimental data taken from [32].
Download figure:
Standard image High-resolution image
Figure 8. Isotopic distribution for the reaction p + 238U at 1000 MeV. Experimental data taken from [33].
Download figure:
Standard image High-resolution image6. Conclusions
The combination of the BSFG model for the level density with the partial widths for fission and particles' emission allowed the creation of two new parameterizations, one for the Coulomb barrier and another for the level density parameter at the fission saddle point. These parameterizations are explicitly dependent on the excitation energy and the level density parameter of the nucleus after the emission of light particles. As a result, the number of light charged particles emitted is higher, and the values of af reflect the influence of the shell effects at low energies.
The work performed in section 2 lies in the framework of the Weisskopf–Ewing formalism (WE) [11] for the emission of light particles. Then a question arises on whether to use or not this formalism, knowing that the Hauser–Feshbach (HF) formalism [34] allows a more rigorous treatment of angular momenta and spins of nuclei and outgoing particles involved in a nuclear reaction.
It happens that, despite offering a more rigorous treatment of angular momentum, HF is not the most common choice between the codes devoted to studying spallation [3] (ABLA [35–38], CRISP [5, 18–28], SMM [39], EVAP [7, 40–42], GEM [43, 44]), where WE is used instead. A remarkable exception to this is the GEMINI code [35, 45].
The origin of this behavior lies in the high computational cost of the implementation of the HF formalism (simulations are pretty much longer than the WE equivalents) as well as in the fact that the intrinsic angular momentum of the compound nucleus formed in spallation reactions is typically low in comparison with fusion reactions. Indeed, the original version of GEMINI studied fusion, that is why HF remained in the new version for studying spallation (GEMINI++) [35].
There are several studies in which it is possible to compare different de-excitation models, such is the case of [46], where GEMINI++ (uses HF for evaporation) and SMM (works with WE) used data coming from the intranuclear-cascade model INCL4.5 [47] for simulating several reactions, including spallation. Both combinations showed strengths and weaknesses, although the INCL4.5/GEMINI++ model gave better general results when compared with experimental data.
Nevertheless, it was not possible to identify the formalism for evaporation as the only source of the discrepancies. Other possible causes are
- the parameterization of some ingredients of the models, such as nuclear level densities, Coulomb barriers, and collective enhancement;
- the proper adjustment of the free parameters included in the codes;
- the inclusion or not of a pre-equilibrium stage between cascade and de-excitation;
whose influence will depend on the observable under study. Then the origin of the discrepancies lies in all the set of models that make up a computer code, so the individual influence of each model is overlapped, being quite unlikely that just one of them is responsible for the differences observed when comparing with experimental data, which is common in the codes studying nuclear reactions.
Some of these ideas are confirmed by figures 9 and 10, which compare the new parameterization of the statistical module of CRISP with other de-excitation models that were coupled to the INCL4.5 code to simulate the reactions. The data corresponding to the different couplings come from the IAEA Benchmark of Spallation Models [48], which offers extensive theoretical and experimental information on spallation reactions. The junction  gives the best results. However, there are regions where all models reasonably describe the experimental data and others where they diverge, showing that all codes can be improved [48, 49]. Thereby the description of the isotopic distribution of the spallation products offered by CRISP is in correspondence with that given by most of the de-excitation models, confirming the reliability of the new parameterizations.

Figure 9. Isotopic distribution for the reaction p + 208Pb at 1000 MeV. Comparison with other models. Data taken from the IAEA Benchmark of Spallation Models [48].
Download figure:
Standard image High-resolution image
Figure 10. Isotopic distribution for the reaction  at 1000 MeV. Comparison with other models. Data taken from the IAEA Benchmark of Spallation Models [48].
Download figure:
Standard image High-resolution image
At this point, it is important to stress again that the objective of this work is to study the relationship between the level density and magnitudes such as CB and af. So that to implement the new models only the sections of code directly related to them were modified, without changing any other parameters, so no attempt was made to achieve better agreement with the experimental data, which could be the goal of future works.
On the other hand, it is also possible to get information from the general expression corresponding to the probability per unit time W()d that a nucleus P with excitation energy U, emits a light particle l with kinetic energy between and + d, resulting in a nucleus F with excitation energy (U − Bl − ) [10]. Integrating this expression for all the possible values of results in the partial width corresponding to the emission of the particle l:

where  is the cross section for the reverse process.
For incorporating equation (31) into the codes is necessary to determine σ(U, Vl, ...), whose form will depend on the formalism for studying evaporation (WE or HF) and will always include U, Vl and , so that the partial width for light particle's emission will have the form Γl = Γl(U, Vl, ...) while the ratio Θ = Γl/Γn will be of the form Θ = Θ(U, Vl ...), leading to the results of section 2.
The final equations would vary, but the main conclusion remains the same: there is a relationship between CB and the level density. The same line of thinking applies to the level density parameter at the fission saddle point.
The inclusion of the HF formalism would help to determine which observables are sensitive to a rigorous treatment of the conservation of both the angular momentum and the parity. Currently, this is not possible in CRISP, so one of the future objectives would be its implementation, which is, in fact, a demanding work.
The new methods for calculation of VC and af were implemented into the CRISP code and used in the simulation of spallation nuclear reactions, leading to an acceptable description of the isotopic distribution of the spallation products of the reactions p + 208Pb and p + 238U at 1000 MeV. Nevertheless, some discrepancies appeared. In the case of p + 208Pb, there is a displacement between the theoretical and the experimental spallation parabolas; as well as in the case of p + 238U, which offers poorer results for nuclei with an atomic number near to 92. The source of the differences lies in the causes previously exposed, especially the treatment of collective effects [13].
The BSFG was the base to develop the models, although it is possible to adapt them to any other level density parameterization, which is currently being doing with DP as well as with the variant of BSFG with the level density parameter dependent on the excitation energy [8]. Then it is possible to say that the main result of the present work is to show that there is a relationship between the level density and magnitudes such as CB and the level density parameter at the fission saddle point, which was not studied before.
Acknowledgments
O Tumbarell would like to thank CAPES (Coordenação de Aperfeiçoamento de Pessoal de Nível Superior) for the financial support. F Guzmán would like to thank the SBF (Sociedade Brasileira de Física) for the financial support of PLAF/SBF/CNPq in the frame of the Cátedra Itinerante program. And finally, the authors thank the financial support of Conselho Nacional de Desenvolvimento Científico e Tecnológico(CNPq).
Appendix
A.1. Deduction of equation (2)
The level density model used in this work is the BSFG, defined as [50]

where U is the excitation energy, EP the energy correction, a the level density parameter and σ the spin-cutoff parameter, given by [8]

then, equation (32) becomes

with UP = U − EP. Using (34), equation (1) takes the form

being

Al the residual nucleus' mass,  and
and  , while al and EFl are the level density parameter and the energy correction after emission of the particle l (using the subscripts n, p and a for neutrons, protons and alpha particles, respectively). The substitutions
  and
and  transforms (35) into equation (2).
A.2. Deduction of equation (6)
Considering Θ = Θ(U, Vl) its partial derivatives are


which leads to
Besides,


and  is the same as equation (40), changing l for n. Therefore, (39) turns into equation (6).
A.3. Deduction of equation (9)
Let Θ be a function such that Θ = Θ(U, Vl), then, considering Vl = Vl(U) the total derivative of Θ is

leading to


where the last two terms of the right side of equation (44) are functions of U and Vl. Then it is possible to establish that

Once the function  has been estimated, Vl is calculated by numerical integration of the equation (45). Following a similar path to the one exposed before it is possible to obtain the equations corresponding to the level density parameter at the saddle point.
A.4. Deduction of equations (24)–(26)
Explicitly, equation (23) has the form
with ρFx(x) given by equation (3). For the sake of simplicity, the value of the energy correction was included inside Bf/n.
When  ,
,  . For
. For  it is possible to assume that the level density takes a constant value [8], then the function ρFx takes the constant value ρFx(Xf/n) and it can be extracted from the corresponding integral in (46). Here Bf/n is the highest value between Bf and Bn, while
  and af/n = af, an; depending on Bf/n.
If Bn > Bf,  when
when  , while Xf > 0. Taking into account the previous paragraph equation (46) becomes
where the absolute value of the second term of the right side of equation (47) is much higher than the first, leading to
which is the equation (24). In a similar way it is possible to obtain the expressions given in equations (25) and (26).