
Abstract
An extensive study on the green auroral emission characterization is presented based on a single dielectric barrier discharge geometry argon plasma jet driven by a kHz sine voltage. The plasma was generated by using 99.999% pure argon and the observed 557.7 nm green line resulted from the excited O(1S) state. An optical emission spectroscopy method using line ratios of argon was used to obtain the electron density and electron temperature under different conditions in the downstream region. The characteristics of discharge and green emission with variations in interelectrode distance, applied voltage (power) and flow rate are discussed. The spatially diffuse distribution of O(1S), owing to its long lifetime, is shown by the short exposure imaging. Two discharge regimes are presented, accompanied by two distinct branches of the green emission intensity, with a clear conclusion that the 557.7 nm emission is favored in the low electron temperature environment. In this work, the intense and diffuse green plume only forms when the downstream electron density is approximately lower than 1 × 1014 cm−3 and the electron temperature is lower than 1.1 eV. By charging the two electrodes in two opposite ways, it is shown that the green emission from oxygen is favored in the case where the electric field and the electron drift are not continuous.
Export citation and abstract BibTeX RIS

Original content from this work may be used under the terms of the Creative Commons Attribution 4.0 license. Any further distribution of this work must maintain attribution to the author(s) and the title of the work, journal citation and DOI.
1. Introduction
It is well known that the 557.7 nm green auroral emission, stemming from the dipole-forbidden atomic oxygen transition between two metastable states O(1S) → O(1D), usually appears in the upper atmosphere in nature [1]. As one of the most important parts of auroral physics, creating artificial emission of the 557.7 nm line was studied [2–5]. Given that there is a strong abundance of reactive oxygen species in the region where the green auroral emission appears, it is possible to use it as an indicator of the presence of reactive oxygen species important for applications such as sterilization, wound healing and cancer treatment [6–8]. The intensity of auroral emission benefits from two factors: better generation of O(1S) and larger transition probability from O(1S) to O(1D). It is difficult to observe such a line in the open atmosphere because of the high collision rates of particles and an abundance of molecular oxygen which is able to quench O(1S) atoms. That is to say, the production of O(1S) is favored when atomic oxygen is more abundant than molecular oxygen [9]. In addition, the excimers formed by the O(1S) atoms with foreign species such as N2 or Ar can make this forbidden transition probability much larger, which might gain from the collision-induced emission [5, 10]. That is why, in recent years, researchers observed the 557.7 nm line in dielectric barrier discharges (DBDs) at atmospheric pressure with N2 (or N2 + O2) as the working gas [11–13] or in Ar plasma jets [14], even though the emission intensities were either too faint to be seen by the eye or the green plasma plumes were very short.
Recently, Jaiswal et al achieved intense green auroral emission and long plume from an Ar plasma jet driven by a kHz AC power supply [15, 16]. Liu et al also reported it with a pulsed power supply and they speculated that low density of electrons might be the precondition of the appearance of green emission [17]. Both works utilized the oxygen impurity in the Ar working gas. When the O2 concentration in Ar plasma is very low, the degree of its dissociation is rather high. Oxygen atoms determined by the ground state O(3P) and the first metastable state O(1D) are the chief existence forms, which are also the main precursors of O(1S) in low pressure discharges [18]. Electrons and Ar metastable states are the two most important active species in this gas system, where they can play different roles in the dissociation of molecules and excitation of atoms, affecting the plasma properties. Jaiswal et al did some work on the electron density and electron temperature obtained from the green afterglow, concluding that electron impact is a more probable way for generating O(3P) and stepwise exciting it to O(1S), while the crucial function of Ar atoms is to form the excimer ArO(1S) [19]. Nevertheless, the electron behavior was not given much consideration, for instance, the relationship between the electron properties and the variation of green emission intensity has not been fully discussed. It is still unclear what kind of circumstance is best for the green auroral emission in high gas pressure conditions. In addition, the above intense green auroral emissions reported in Ar or N2 plasma jets are more easily observed in the lower electrode powered jet structure where the high voltage electrode is located downstream of the gas flow. There is a lack of analysis of the essential differences brought by different electrode arrangements which easily drive varied discharges.
In [14, 15, 17, 19], a two-ring double DBD jet structure was used and the afterglow always looked diffuse without obvious change of discharge morphology. Judée et al reported that the plasma characteristics are 7%–16% higher in the single DBD configuration compared to the double DBD configuration for the same plasma power [20].
This paper reports on the green emission characteristics under a single DBD plasma jet in Ar. The focus is on the plasma mode transition associated to the characteristics of the green auroral emission (the 557.7 nm emission from O(1S)). By varying the input power we achieved different discharge modes, diffuse or diffuse + filamentary, which has a significant impact on the electron density and electron energy distribution, as well as the green emission intensity. The analysis shows that the emission from the 557.7 nm line benefits from the electrons with relatively low energy.
Based on the spectral analysis methods shown in section 3, the influences of variations in interelectrode distance (section 4.1), discharge regime (section 4.3) and flow rate (section 4.4) on the green emission are discussed in terms of electron parameters. The spatial propagation and temporal evolution of the green plasma are explored by fast imaging in section 4.2. The effect of electrode arrangement is analyzed in section 4.5.
2. Experimental setup
The schematic illustration of the experimental setup is shown in figure 1. The jet was constructed in a coaxial geometry. The central stainless-steel tube was not only an electrode but also a gas inlet. The ring electrode was made of copper foil with a width of 5 mm. The distance between the end of the inner electrode and the start of the outer (ring) electrode was variable, but the standard gap was 10 mm. The inner diameter of the glass tube was 2.25 mm and the outer diameter of the metal tube was 2 mm. The purity of Ar working gas was 99.999% and the gas flow rate was controlled by a mass flow controller. The oxygen impurity was no more than 5 ppm according to the gas specification from Linde Gas, the Netherlands. The gas line was made of PTFE. A 25 cm long glass tube connecting with a 3 m long bendable rubber tube was used to prevent admixing of air into the Ar atmosphere inside the capillary influencing the discharge.
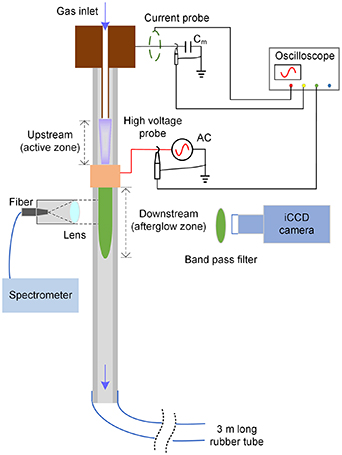
Figure 1. Schematic diagram of the experimental setup.
Download figure:
Standard image High-resolution imageThe plasma jet was driven by a sine-wave power supply (Amazing1 PVM500) with adjustable voltage from 0 to 10 kV and operated at 30 kHz. One of the electrodes was connected to this power supply and the other was grounded. Ring electrode powered configuration was the default arrangement in our work unless specifically stated. Electrical measurements were obtained with the aid of a high voltage probe (Tektronix P6015A) measuring the amplitude of the applied voltage and a Rogowski coil (MagneLab CT-F1.0-BNC) measuring the current from the ground side. A measurement capacitor Cm (0.9 nF) being used to acquire Lissajous figures was in series in the circuit from the ground side.
The plasma was separated by the ring electrode to form two regions: the upstream region (active zone) and the downstream region (afterglow zone). A spectrometer (Ocean Optics HR2000+) with a resolution of 0.23 nm, slit 10 μm was used to get optical spectra in the wavelength range of 415–855 nm, acquiring most data for this work. When a wider wavelength range or a high signal-to-noise ratio for the continuum emission was required, a spectrometer (AvaSpec-ULS2048CL-EVO-RS) with a lower resolution of 0.60 nm and a larger slit of 100 μm was used. The integration time of both spectrometers was set to 1 s. An optical fiber coupled with a collimating lens was used to collect the light emitted from the plasma. The diameter of the lens is 6 mm. The default position of the optical fiber, i.e. the central axis of the lens, was downstream 5 mm away from the lower edge of the ring electrode. The long exposure images that are presented in color in this manuscript were taken with a digital camera (SONY DSC-RX10M3). An iCCD (Princeton Instrument PI-MAX 4) was used to capture short exposure photographs. When the dynamics of green emission need to be captured, a band-pass optical filter around 557 nm (Thorlabs FBH560-10) was placed in front of the iCCD camera.
3. Analysis: electron properties from optical emission spectroscopy (OES)
OES is the primary method of analysis of plasma properties in this work. A typical spectrum of the downstream discharge, when the green emission is intense, is shown in figure 2. Besides the weak lines from OH, N2 second positive system ( , 300–400 nm) and Ar lines from 2p → 1s (Paschen notation) transitions, there is still an apparent 557.7 nm line located in the green visible region. The asymmetrically broadened profile of this line is due to the emission of ArO excimer.
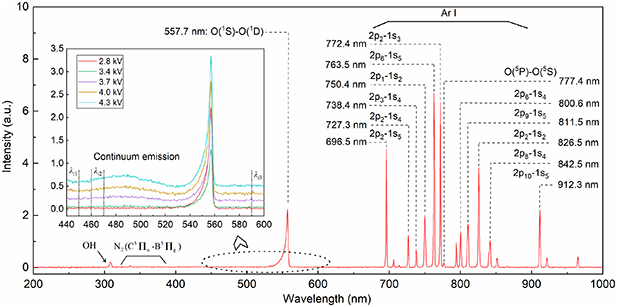
Figure 2. A typical spectrum of downstream Ar plasma in our measurements. The subpicture in it compares the continuum emissions at different voltages.
Download figure:
Standard image High-resolution imageFor a plasma jet in a configuration like in this work, electron densities in the upstream region (region between the two electrodes) and the downstream region can greatly vary. Upstream electron density is higher due to a higher electric field strength and ionization rate, meaning that we cannot regard these two regions as a whole with high plasma uniformity [21, 22]. Therefore, if we calculate the electron density ne from the discharge current, it will not reflect the density in the downstream region. In this paper, we focus on downstream electrons because the afterglow zone is where the green emission is visible to the naked eye and the downstream region is used in applications.
Continuum emission is useful for the analysis of electron density (ne). For the cases where the ionization ratio is small (e.g. ne /nAr < 10−5), continuum emission is mainly generated by the collisions of remaining electrons with atoms [21] and it is found that the emission intensity is proportional to the square of ne [23], thus we have

where Icontinnum is the continuum emission intensity and k is the proportionality coefficient. Through this expression, we can assess the relative ne by observing the continuum emission intensity when a rapid assessment of the trend of ne is required. In this research, we select three λ intervals from pure continuum emission, namely 440–450 nm, 460–470 nm and 590–600 nm shown as λi 1, λi 2 and λi 3 in figure 2. The continuum spectra are averaged over these λ intervals for each set of parameters and the resulting Icontinuum values are used to get relative ne values.
In atmospheric pressure Ar discharges, the line-ratio technique is one of the most widely used approaches for a fast estimation of ne and Te, especially in experiments with one single variable, e.g. voltage or flow [24–27]. To gather further information on electron properties, a line-ratio method that has been proposed in [28], with a collisional-radiative (CR) model developed in [29], is adopted to determine absolute ne and Te values with the emission lines from Ar(2p) levels under different experimental conditions. For two Ar(2p) levels 2pi and 2pj , their population ratio is related to the experimental line intensity ratio by [28, 30]
where  and
and  are the population densities of these two 2p levels, I1 and I2 are the intensities of emission lines in the transitions 2pi
→ 1sk
and 2pj
→ 1sl
, respectively. A is the Einstein coefficient related to the specific transition.
are the population densities of these two 2p levels, I1 and I2 are the intensities of emission lines in the transitions 2pi
→ 1sk
and 2pj
→ 1sl
, respectively. A is the Einstein coefficient related to the specific transition.
For atmospheric Ar plasmas, the dominant production process of Ar(2p) is electron impact excitation from Ar(1s); while the dominant depopulation processes are the collisional quenching by the atoms and electrons [29, 30]. Thus, the population ratio of these two Ar(2p) levels can also be expressed, according to the rate balance equation when a quasi-steady state is assumed, as [30]
where ngs is the density of Ar atoms in the ground state,  and
and  are the electron impact rate coefficients from Ar(1s) levels to Ar(2p) levels, which are functions of Te.
  and
and  are the quenching rate coefficients of 2pi
and 2pj
levels by collision with electrons.
are the quenching rate coefficients of 2pi
and 2pj
levels by collision with electrons.  and
and  are the quenching rate coefficients of 2pi
and 2pj
levels by ground state Ar atoms.
are the quenching rate coefficients of 2pi
and 2pj
levels by ground state Ar atoms.
By comparing the measured population ratios from equation (2) with the predicted ones from equation (3) where the population ratios as functions of Te and ne , we can obtain the absolute values of Te and ne for our Ar plasma. As more details of this method and the corresponding CR model are given in [29–31] and all the rate coefficients in equation (3) are also given in [29], this is only a brief description here. In this work, we selected four Ar lines 696.5 nm, 706.7 nm, 750.4 nm and 751.5 nm to determine the line ratios for Te and ne calculations:
Their upper levels are 2p2 2p3, 2p1 and 2p5 respectively. The atom quenching coefficient of 2p3 is much larger than that of 2p2 while their electron quenching coefficients as well as excitation rate coefficients are similar. Thus,  is negatively correlated with ne [30]. The ground state excitation of 2p1 has a larger rate coefficient than that of 2p5 while 2p5 has a larger excitation rate coefficient from 1s levels, thereby
  increases with Te [31].
During each OES measurement, the background spectral noise with plasma off was subtracted from the measured spectrum. The baseline introduced by the continuum emission was also subtracted for each line peak. The spectral intensities were calibrated in terms of the response curve of the spectrometer when line ratios were utilized.
4. Results and discussion
4.1. Discharge appearance and green emission characteristics under different interelectrode distances
The green emission in this work comes from a single spectral line at 557.7 nm, belonging to the transition O(1S) to O(1D). It is therefore a fingerprint of low-energy excited states of atomic oxygen in the plasma effluent. This section examines the conditions in which it appears.
The assumption is that the length of the active zone should change the distribution of the electric field and injected power density, thus possibly manipulating the morphology and performance of discharge as well as the downstream green line intensity. For this reason, we separately set the interelectrode distance (referred to as HG distance) to 5 mm, 10 mm, 15 mm and 20 mm. Measurements were taken every 300 V from the minimum sustaining voltage.
Figure 3 shows the appearance of the discharges through long exposure images in color. Overall, irrespective of the interelectrode distance, when the voltage was near the lowest voltage, the green emission was intense enough to be observable by the eye. When the HG distance was 10 mm or 15 mm (figures 3(b) or (c)), the plasma plume was wide and diffuse when the voltage was near the minimum sustaining voltage. With the increase in applied voltage, a mixed plume of diffuse and filamentary (constricted, showing narrow channels) (DAF) was generated, showing a gradual appearance of a central intense channel in the downstream region. Similar discharge phenomena were also found in [32, 33] where single-electrode structures were used. For the discharges with HG distance of 20 mm (figure 3(d)), the downstream filament was generated for all applied voltages.
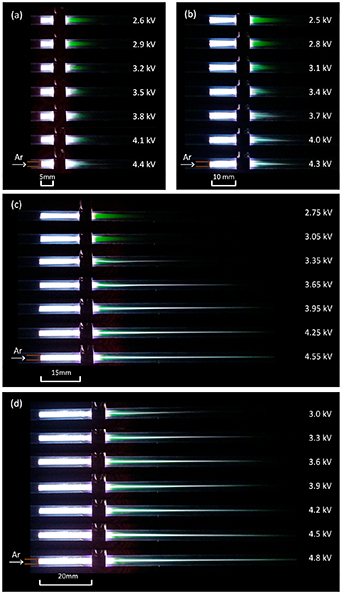
Figure 3. Green plasma discharges under different interelectrode distances. (a)–(d) correspond to 5 mm, 10 mm, 15 mm and 20 mm, respectively. The inner electrode marked in the figures also served as the gas inlet. The Ar flow rate was 4 l min−1. The applied voltage increased every 300 V from the minimum sustaining voltage. The outer (ring) electrode was charged, while the inner electrode was grounded. The exposure time of the camera was 0.025 s.
Download figure:
Standard image High-resolution imageFigure 4 shows that when the HG distance is 5 mm or 10 mm, the 557.7 nm emission intensity exhibits a different trend for the voltages below 3.5 kV and above that threshold, which has not been reported in previous works. However, it monotonically grows with voltage when the HG distance is 20 mm, where the constricted discharge exists for the entire voltage range. Although we cannot see purely diffuse green plasma plumes at higher voltages in any of these cases, the 557.7 nm line is still intense, meaning that the green emission is present, just less intense than radiation coming from Ar transitions.
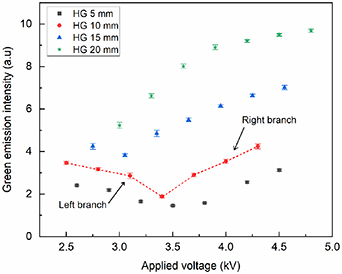
Figure 4. The 557.7 nm line intensities for different interelectrode (HG) distances. Each data point represents 20 measurements.
Download figure:
Standard image High-resolution imageWith the help of continuum emission, as described in section 3 and equation (1), we obtained the relative electron densities for the downstream region and plotted them as functions of voltage. This is shown in figure 5, where we normalize the obtained relative intensities by that of data point 'HG 10 mm, 2.5 kV'.
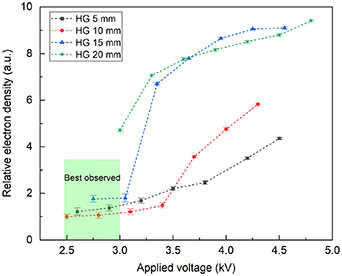
Figure 5. Trends of downstream relative electron densities obtained from continuum emissions as functions of applied voltage under different interelectrode distances. These values were normalized by the value obtained from the 'HG 10 mm, 2.5 kV' case. The green plasma is best visible below 3.0 kV applied voltage.
Download figure:
Standard image High-resolution imageBy comparing these four plots with the corresponding discharge appearance in figure 3, we can summarize that all the electron densities increase with voltage and the appearance of filaments (constricted channels) coincides with sharp increases in electron densities. From the curve showing data for HG 10 mm in figure 5, ne rises around sixfold from 2.5 kV to 4.3 kV, while the green emission intensity does not even double. The emission intensities at 2.5 kV and 4.0 kV are nearly the same although the electron densities are significantly different. Therefore we conclude that high ne is not a decisive factor for the 557.7 nm line intensity.
For the HG distance of 10 mm, the discharge includes the combinations of diffuse and DAF discharges, decreasing and increasing 557.7 nm line intensities as well as slow and fast growths of ne. Therefore, we will adopt the 10 mm HG distance for analysis in the next sections.
4.2. Discharge morphology
This section shows that the morphology of the emission at 557.7 nm differs from that of the rest of the emission. This is due to a large difference in the lifetime of the O(1S) state.
To illustrate the temporal evolution of the downstream discharge, figure 6 presents a series of short exposure iCCD images corresponding to one discharge period when the applied voltage is 4.0 kV and the HG is 10 mm, as it combines the DAF discharge. In both half cycles, we are able to see the narrow plasma front propagation in the downstream zone. For this region, the charged ring electrode plays a role in initiating streamers. Compared to the discharge in the negative half cycle, the plasma front in the positive half cycle is narrower and propagates over a longer distance, which is in line with the result in [32]. This is caused by the discrepancy of the electric field in front of the streamer head in the downstream region: the net electric field in front of a positive streamer is stronger than that of a negative streamer, which has been verified in [34, 35]. The average velocities of positive and negative bullets are respectively estimated to be 7.5 × 10³ m s−1 and 5.6 × 10³ m s−1, which are a little lower than that of in [32] because of different powers and jet structures. This result connects well with the observation from long-exposure images in figure 3, where a central constricted emission was found in these plasma conditions.

Figure 6. Temporal evolution of the downstream plasma plume without filter. The discharge was conducted under the following conditions: the applied voltage was 4.0 kV; the Ar flow rate was 4 l min−1; the interelectrode distance was 10 mm. Each photograph, accumulated by 10 frames, represents a 50 ns interval marked a–p in the voltage–current profile.
Download figure:
Standard image High-resolution imageTo solely acquire the emission around the 557.7 nm line, a filter (central wavelength is 560 nm, full width half maximum is 10 mm) was used in front of the camera. The spectrum in figure 2 shows that this is the only spectral line in the transmission range of the filter. The obtained images shown in figure 7 indicate that, in either positive or negative discharges, the emission at 557.7 nm is much more diffuse than the Ar-dominated emission presented in figure 6. There is no apparent ionization front propagating process that can be seen in one discharge period. The diffuse distribution of the green emission is the reason why the plume is diffuse when the discharge is operated in the voltage range where the green emission is the most prominent, as shown in figure 5.
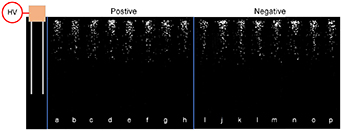
Figure 7. Temporal evolution of the green emission with a filter. The discharge was conducted under the following conditions: the applied voltage was 4.0 kV; the Ar flow rate was 4 l min−1; the interelectrode distance was 10 mm. A band-pass filter (CWL = 560 nm, FWHM = 10 nm) was placed in front of the iCCD camera. Each photograph, accumulated by 100 frames, represents a 50 ns interval marked a–p in the voltage–current profile in figure 6.
Download figure:
Standard image High-resolution imageThe observed effect is caused by the long lifetime of O(1S). The theoretical natural radiative lifetime for individual O(1S) is about 0.75 s in auroras [36]. In atmospheric pressure N2 discharge, the lifetime of O(1S) was estimated to be in the range of 1–20 ms by comparing the intensity ratio of 557.7 nm to the competing line at 297.2 nm with the theoretical ratio [37]. Given the existence of ArO(1S) excimer, if taking the increased transition probability by a factor of 576 calculated in [19] into account, the lifetime of ArO(1S) is also on the order of 1–2 ms, which is several tens of times the discharge period in our experiment.
Clearly, O(1S) and Ar O(1S) can survive much longer than most excited Ar species. Given their long lifetime and the fact that they are not charged, the dynamics of O(1S) and ArO(1S) should be connected to the transport by the gas flow—a combination of the working gas flow and the flow enhancement due to discharge. This should not be confused with the movement of the ionization wave forming the discharge, which is driven by the electric field. In the working gas flow, O(1S) and ArO(1S) can only move 0.28 mm within the duration between two discharges (around a half period, 16.7 μs) under a working gas velocity of 16.8 m s−1 (when the flow rate is 4 l min−1). The flow enhancement by discharge is mainly associated with the electrohydrodynamic force generated by the momentum transfer from charged particles to neutrals, i.e. electric wind [38–40]. However, it is reported that, in plasma jets, this can only increase the flow speed by the same order of magnitude, highly depending on the applied voltage and discharge duration [38, 41]. Thus, for our discharge, it is reasonable to assume that most O(1S) and ArO(1S) move at the submillimeter scale under the modified gas flow between two discharges. This leads to the conclusion that they will not move outside of the discharge zone within one voltage cycle, but slowly move through it during several voltage cycles, also diffusing radially along the way. In other words, the 557.7 nm emission that occurs in one voltage period reflects the O(1S) and ArO(1S) excimers generated in the previous few periods. This characteristic of the green afterglow is similar to the phenomena in nitrogen discharges where the spatial afterglow is sustained by the transport of long-lived species [13, 42, 43].
4.3. Analysis of the 'two branches' feature corresponding to two discharge regimes
As shown in figure 4, for small interelectrode (HG) distance the intensity profile of the 557.7 nm line shows two branches—a low voltage ('left') branch and a high voltage ('right') branch. In this section we will show that the injected power variation is the direct cause of different discharge regimes.
The analysis start with the profiles of Lissajous figures and calculated dissipated powers by these discharges, in figure 8. These results are obtained by averaging 15 discharge cycles, using the interelectrode distance of 10 mm. A typical voltage-current waveform (I–V plot) at 2.8 kV is also shown in figure 8. The dissipated power indicates a slower growth from 2.5 kV to 3.4 kV while a faster growth after 3.4 kV, which is correlated to the evolution of the electron density as a function of voltage, as shown in figure 5.
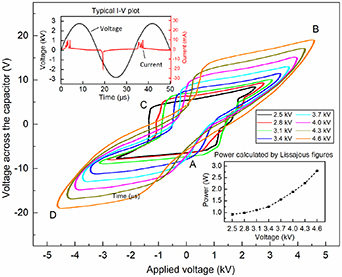
Figure 8. Lissajous powers for varying applied voltages and a typical I–V plot when the voltage is 2.8 kV. These results were obtained when the interelectrode distance was 10 mm, the Ar flow was 4 l min−1 and the applied voltage varied from 2.5 kV to 4.6 kV.
Download figure:
Standard image High-resolution imageIn Lissajous figures, the number of slopes of curves AB or CD respectively corresponds to the number of discharge current peaks in the positive or negative half cycle [44, 45]. When the applied voltage is relatively low, there are multiple positive peaks. With the increase in voltage, as well as injected power, the number of positive peaks gradually decreases to one. The voltage variation does not impact the number of negative current peaks which is always kept as one. Due to the asymmetry of this electrode structure, unequal amplitudes of discharge currents are also evidently observed: the instantaneous current amplitudes in the negative half cycle are larger than those in the positive half cycle, which can be seen from the voltage-current waveform.
The differences in current between positive and negative half cycles are relevant to the direction of drift and diffusion of electrons in the upstream zone. In the negative half cycle, the electrons are created in avalanches and drift toward the bare metallic electrode, where they can be absorbed. In contrast, in the positive half cycle, the electrons drift away from the grounded inner bare metallic electrode to the ring electrode covered with the dielectric, where they can be adsorbed by the glass inner wall, inhibiting the development of the electron avalanches [46]. Still, the discharges particularly in the active zone are driven by the streamer mechanism, which has been verified in many studies where the current differences were also observed [32, 47, 48].
As Ar emission dominates this discharge, we select three typical Ar lines (696.5 nm, 763.5 nm and 772.4 nm) to trace the variation of the population of Ar atoms in excited states as their lower levels are 1s3 and 1s5 metastable states. Figure 9(a) presents the selected lines as functions of applied voltage. Figures 9(b) and (c) respectively show ne and Te determined from the line-ratio method. The plot in figure 9(b) suggests that downstream ne is on the order of magnitude of 1013–1014 cm−3. It increases very slowly from 2.5 kV to 3.4 kV but increases sharply afterwards, which is consistent with the result in figure 5. The plot in figure 9(c) indicates that Te grows faster during 2.5–3.4 kV (from 1.0 eV to 1.44 eV) and then approximately remains stable (in the range of 1.35–1.37 eV) in the subsequent voltage intervals. The best observed green plasma plume appears when ne is lower than 1 × 1014 cm−3 and Te is lower than 1.1 eV.

Figure 9. Ar line intensities related to Ar metastable states 1s3 and 1s5 (a), electron density ne (b) and electron temperature Te (c) as functions of applied voltage. The spectra used in these results were obtained when the Ar flow rate was 4 l min−1 and the interelectrode distance was 10 mm.
Download figure:
Standard image High-resolution imageWith the combination of dissipated power in figure 8, ne as well as Te in figure 9 and discharge phenomena in figure 3(b), we can roughly divide the discharge into two phases in terms of discharge morphology: transition phase from diffuse to DAF (described in section 4.1) (2.5–3.4 kV) and solely DAF phase (after 3.4 kV).
Correlating to figure 4, it is evident that 3.4 kV also delimits the two branches of the intensity of the 557.7 nm line. The low voltage (left) branch is characterized by low dissipated power, low ne, rising Te, the transition of the discharge morphology from diffuse to DAF and the 557.7 nm emission being observable by the naked eye. In the high voltage (right) branch, where the 557.7 nm emission is dominated by the Ar lines, ne rises, Te stabilizes at a higher value and the discharge is in the DAF mode. sections 4.3.1 and 4.3.2 will give more details of the two discharge regimes.
4.3.1. Transition phase from diffuse to DAF regime.
From 2.5 kV to 3.4 kV, most increased power along with voltage is consumed in the active zone. The residual downstream increased power is mainly used to raise the energy of downstream electrons rather than their density, which can be seen in figures 9(b) and (c). The rise in Te in this regime would be likely to cause an increase in the density of Ar atoms in the metastable levels, which can be proved in figure 9(a), as those are typically populated by direct electron impact. Ar metastables (their energy levels are at 11.5–11.8 eV) are expected to increase atomic oxygen density providing that the dissociative excitation of O2 is principally driven by the reaction [49]

in which Ar* is the metastable level and O can be in the states O(3P), O(1D) or O(1S) depending on the energy requirement. However, the 557.7 nm line intensity approximately halves from 2.5 kV to 3.4 kV in figure 4 (left branch), meaning that the increase in voltage does not lead to a population growth of O(1S) or ArO(1S) in this process. This indicates that 1s state Ar is not the determining factor in the dissociative excitation of O2.
The dissociation of O2 is most probably driven by electron impact, as also indicated in [19]. The weak intensity of the 777.4 nm line from the spectrum (figure 2), indicates that the downstream region of this discharge operates at electron energies that are lower than typically observed in DBDs. The 777.4 nm is a line with a high line strength, typically used as evidence of atomic oxygen in the plasma, however, it originates from the O(5P) level at 10.74 eV. The O(1D) and O(1S) states are low-energy states, at 1.97 eV and 4.19 eV respectively. In a discharge at low electron temperature, these states are significantly easier to populate by direct electron impact than the O(5P) state. The fact that the 777.4 nm line is almost not visible, while there is much more intense emission present from the ArO(1S) excimer points towards the low electron energy plasma being the perfect environment for the intense green emission from the discharge in this regime. The decrease of the 557.7 nm line intensity in the left branch is caused by the reduction of the proportion of low-energy electrons with increasing Te. This agrees with the conclusion in positive column discharge where Emeleus et al found that preventing the excessive high-energy electrons is one of the conditions for generating auroral lines, although they conducted the discharge at low pressure [50].
However, Ar atoms are crucial in the formation of the ArO(1S) even though they are hard to excite in low-energy environments. In this setup oxygen is an impurity, Ar atoms will be much more abundant compared to oxygen, making the formation of ArO(1S) possible. At a low pressure of 100 torr, an estimation in [51] showed that about one O(1S) atom in 20 000 will be bound into an ArO(1S) excimer and the estimated molecular radiation rate is about 2.6 × 10⁵ s−1.
4.3.2. DAF regime.
With a sharper increase in injected power, after 3.4 kV, the central filament in the afterglow gets wider and the filamentary discharge becomes non-negligible compared to the transition phase from diffuse to DAF, as seen in figure 3(b). The filamentary discharge brings a significant increase in the density of electrons, as indicated in figure 9(b). The average electron energy, however, is rather constant in the DAF phase.
The overall ne increase clearly causes higher population of the excited Ar states, but also promotes the population of the O(1S) state and the formation of ArO(1S) as lower-energy electrons rapidly increase as well, increasing the 557.7 nm line intensity, as shown in figure 4 (right branch). In [20], where a similar jet was used to form an Ar discharge, the atomic oxygen production rate increasing with the applied voltage was also observed and attributed to a more efficient dissociation of O2.
In both regimes, the low voltage and the high voltage branch, the excitation of the O(1S) state and the formation of ArO(1S) is facilitated by the low-energy electrons. The intense and diffuse green plume is only visible in the phase of regime transition (low voltage branch) when both ne and Te are relatively low. In the high voltage branch, Te and ne are relatively higher, promoting in addition more excitation of Ar excited states, whose emission intensity then becomes larger than that from the ArO(1S) at 557.7 nm.
4.4. Variation of gas flow rate
Figure 10 depicts the green plasma appearance under varying Ar flow rates with a voltage of 2.8 kV. While the green emission is not visible at low flow rates, it becomes more intense with flow increase, and the length of the downstream plume also gets longer. The green plumes at higher flow rates only present as diffuse discharge regime. Figure 11 indicates that the 557.7 nm line intensity grows fast with the increase in flow yet the dissipated power just increases by about 50%.
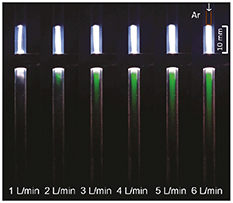
Figure 10. Green plasma presented under varying Ar flow rates. The discharges were conducted under the condition of 2.8 kV and 10 mm interelectrode distance. The exposure time of the camera was 0.025 s.
Download figure:
Standard image High-resolution image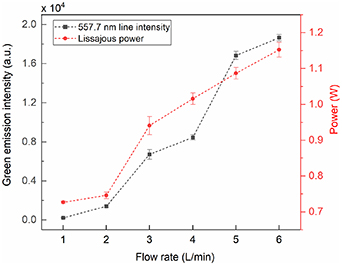
Figure 11. The 557.7 nm line intensity and Lissajous power vary with flow rate. The discharges were conducted under the condition of 2.8 kV and 10 mm interelectrode distance.
Download figure:
Standard image High-resolution imageFigure 12 shows the voltage-current waveforms corresponding to discharges with varying flow rates. Coupled with a low applied voltage, there will be multiple positive current peaks when the flow rate is greater than or equal to 3 l min−1, at the same time there is only one current peak in the negative half period. In addition to the limited ionization capacity of lower power, the flow pattern could also affect the current characteristics. The Reynolds number (Re) was also calculated for each flow rate as illustrated in the figure. When Re reaches 2000, the laminar mode is gradually progressing to the turbulent mode until Re is greater than 4000 the turbulent mode will be perfectly developed [52]. This matches well our current features, i.e. the number of current peaks increases when the flow mode transition starts. Furthermore, the breakdown voltage rises with flow rate, which can be seen from the occurrence time of discharge currents no matter in positive or negative half cycles, implying that the gas pressure increases as well.
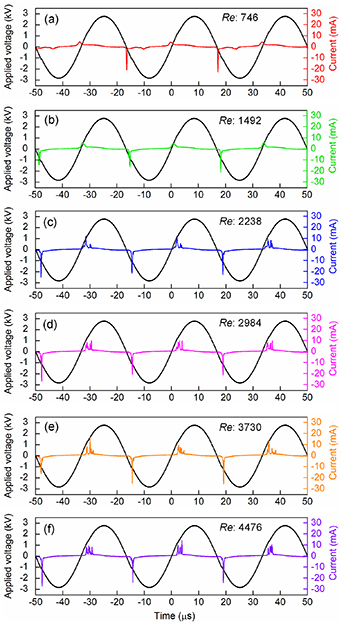
Figure 12. The discharge voltage-current waveforms under varying Ar flow rates. (a)–(f) correspond to 1–6 l min−1, respectively. The discharges were conducted under the condition of 2.8 kV and 10 mm interelectrode distance.
Download figure:
Standard image High-resolution imageFigure 13 shows ne and Te as functions of flow rate. As the plume length was too short to fill in the entire collimated lens-collected area when the flow rate was 1 l min−1 and 2 l min−1, we removed these two sets of data to avoid analysis errors because of unequal detection volume. The downstream ne decreases from 1.06 × 1014 cm−3–0.21 × 1014 cm−3 with varying gas flow rates, as shown in figure 13(a), which is possibly caused by the turbulent gas that could make the electrons more dispersed. Te is also inversely proportional to the gas flow, as shown in figure 13(b), the increasing gas flow makes Te slowly down to less than 1 eV while the green emission intensity increases in figure 11. This further suggests that the lower-energy electron environment is a favorable factor for the production of O(1S) or ArO(1S) and its transition to enhance the 557.7 nm line intensity. Similar to the results in section 4.3, the intense and diffuse green plasma plume is also generated when ne is roughly lower than 1 × 1014 cm−3 and Te is lower than 1.1 eV.
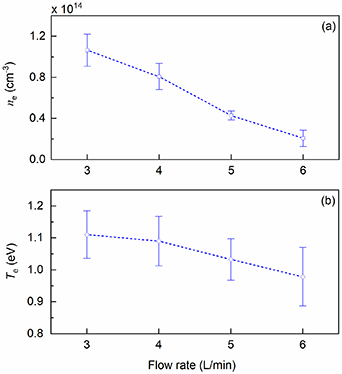
Figure 13. Electron density ne (a) and electron temperature Te (b) as functions of flow rate. The spectra used in these results were obtained when the voltage was 2.8 kV and the interelectrode distance was 10 mm.
Download figure:
Standard image High-resolution imageTo attempt to explain the trend in Te in figure 13, we look into the behavior of Te with varying pressure. In a long and narrow tube space, a higher flow rate means a higher gas density in the region near the gas inlet, where the increased gas density cannot be quickly relieved, thus bringing a rise in the gas pressure. Moreover, the gas temperature decreases with the increase in gas flow rate due to the fact the larger velocity of the gas flow can take away more heat from the reaction area [53–56]. Therefore, the increasing gas pressure and the decreasing gas temperature lead to a shorter electron mean free path under a high flow rate according to the expression:
where  is the electron mean free path,
  is the gas temperature,
  is the collisional cross-section between electrons and gas atoms, R is the gas constant, P is the gas pressure and V is the gas volume. Electrons will get more frequent collisions with other species at the cost of reducing the energy obtained from the acceleration process under a smaller mean free path. As a result, the number of low-energy electrons that are suitable for the O(1S) or ArO(1S) generation increases. The decreasing Te with flow rate was also observed in other Ar plasma jet-related research [54, 57].
Overall, whether at low voltage or high flow rate, the low electron temperature facilitates the green emission intensity via increasing the number of downstream low-energy electrons, of which role points to the conclusion that stepwise excitation by low-energy electrons is the most probable pathway for the O(1S) generation in our plasma environment. This agrees with the assumption in [19]. The stepwise excitation process can be achieved via the intermediate states: mostly atomic O(1D) and possibly molecular O2(a 1Δg) as well, of which energy levels are 1.97 eV and 0.97 eV respectively, lower than 4.19 eV (the energy level of O(1S)), mostly relying on low-energy electrons.
4.5. The role of electrode arrangement
Electrode arrangement affects the electric field distribution in the plasma jet, influencing the electron behavior and consequently the O(1S) production. However, there is a lack of discussion on this topic.
Figure 14 illustrates that, in our work, the dissipated powers are numerically similar for two different jet configurations with reverse electrode arrangements (ring electrode powered or ring electrode grounded) operated at the same applied voltage. Figure 15 shows the discharge appearance and I–V plot when the ring electrode is grounded. The minimum sustaining voltage is 1.9 kV, which is lower than that of the ring electrode powered jet. There is a bright central filament generated from the beginning without a diffuse discharge phase. The length of the downstream plume grows fast accompanied by this strong filamentary discharge throughout the entire voltage range. There is only one current peak whether in the positive or negative half cycle.

Figure 14. Comparison of dissipated powers between the ring electrode powered jet and the ring electrode grounded jet. In both cases, the Ar flow rate was 4 l min−1 and the interelectrode distance was 10 mm. The powers were obtained by Lissajous figures.
Download figure:
Standard image High-resolution image
Figure 15. Discharges in the ring electrode grounded plasma jet and a corresponding I–V plot. The Ar gas flow was 4 l min−1 and the interelectrode distance was 10 mm. The exposure time of the camera was 0.025s. The I–V plot was obtained when the applied voltage was 2.8 kV.
Download figure:
Standard image High-resolution imageFigure 16 compares the 557.7 nm line intensities for two jet configurations where the only difference is which electrode is powered and which one is grounded. We can see that the green emission is comparatively higher when the ring electrode is grounded even though it is not clearly observable by the naked eye. Similar to the DAF phase in section 4.3.2, the green emission intensity increases with voltage (power), indicating that the filamentary discharge forms higher electron densities to both perform the dissociation of the oxygen molecule and form O(1S). However, the lower electrode powered jet seems to be able to limit the proportion of high-energy electrons and provide better conditions regarding the electron properties for an intense and diffuse green plume. In the works where two-ring double DBD jets were used, intense and diffuse green plasma plumes were also created only when the high-voltage ring electrodes were placed downstream [14, 15, 17, 19].
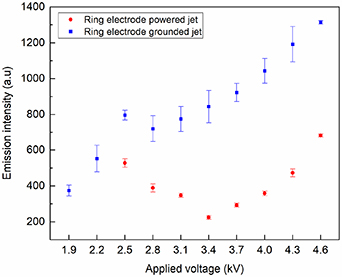
Figure 16. Comparison of intensities and trends of the 557.7 nm line emission for two different jet configurations.
Download figure:
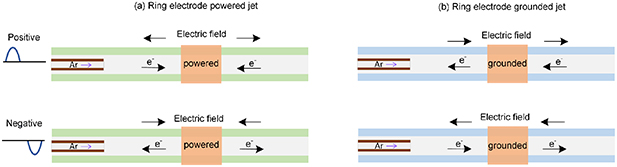
Standard image High-resolution imageThe difference in appearance and the emission intensity is striking, especially when considering that the discharges operate at the same power. For an AC power supply, these two jet configurations should be equivalent because of the reversal of voltage polarity, meaning that the positive half cycle for the ring electrode powered jet should correspond to the negative half cycle for the ring electrode grounded jet, and vice versa. When focusing on the electric field, by taking infinity as zero potential, we can conclude that no matter whether for the positive half cycle or negative half cycle, the directions of the electric field in the active zone and the afterglow region are opposite when the ring electrode is powered. However, they are the same when the ring electrode is grounded, as illustrated in figure 17. The direction difference of electron drift caused by the difference in the direction of the electric field seems to result in different discharge behaviors. For the ring electrode powered jet, opposite electron drifts (respectively in the upstream and downstream regions) interrupt the development continuity of electron avalanches from the ring electrode node. For the ring electrode grounded jet, the same orientation of electron drift maintains the continuity of discharge formation throughout the two zones, making the ground side plasma plume much longer regardless of the gas flow direction, which can be also seen in [17, 19, 58] where double DBD jets were used.
Figure 17. Direction diagram of electric field and electron drift for two different jet configurations.
Download figure:
Standard image High-resolution image
Thus, for the lower electrode powered jet, the ring electrode acts as a 'barrier' due to the discontinuous electric field and electron drift on both sides of it. When the applied voltage is close to the minimum, this electron drift discontinuity makes it difficult for the discharge to form downstream, fostering a low electron energy environment for the formation of an intense and diffuse green plasma plume. This 'barrier' effect could be further tested by observing the effect of a varying thickness (length) of the ring electrode in this configuration.
5. Conclusion
This paper presents a study of characteristics of the 557.7 nm green line (arising from the transition O(1S) → O(1D)) observed in a single DBD Ar plasma jet. Spectral analysis using continuum emission and line ratios is used to mark the changes in ne and Te for the downstream region. The effects of interelectrode distance, discharge morphology and flow rate on the green emission are discussed. The impact of electrode arrangement is analyzed to illustrate how a suitable circumstance is generated for the O(1S) production in the downstream region. The 10 mm interelectrode distance is taken as the default setting for most discussions due to its favorable discharge characteristics.
The best observed green plasma plume appears when the applied voltage is close to the minimum sustaining voltage. Two different discharge regimes are observed with the increase in power: diffuse and DAF. Fast photography of the discharges shows that the Ar emission presents propagation of an ionization wave, which is much faster than gas velocity, while the spatial distribution of O(1S) is diffuse, owing to its long lifetime.
Accompanied by two discharge appearances, with the increase in power, the downstream 557.7 nm intensity shows two distinct behaviors: it first decreases and then increases. Analysis of the left (low voltage) branch (2.5–3.4 kV), coupling with the transition phase from diffuse discharge to DAF discharge, concludes that the generation of O(1S) or ArO(1S) requires a lower-energy electron environment. In this work, the intense and diffuse green plasma plume is only formed when ne is approximately lower than 1 × 1014 cm−3 and Te is lower than 1.1 eV. In the DAF phase (high voltage branch), the increased power leads to a higher ionization rate, sharply increasing the amount of electrons including lower-energy electrons and enhancing the 557.7 nm line intensity further. However, the Ar emission intensifies as well, causing it to start dominating the overall emission.
The increase in flow rate leads to a fast growth of the 557.7 nm line intensity. Te decreases with the increasing flow rate, which also shows that the lower-energy electron environment is more suitable for the generation of green plasma. The increase in the lower-energy electrons facilitates the green emission intensity via the stepwise excitation of oxygen atoms, which is the most probable pathway for O(1S) generation.
The comparison between the ring electrode powered jet and the ring electrode grounded jet indicates that electron drift discontinuity is the likely factor fostering the environment with low electron energy downstream. This causes the green emission at 557.7 nm from ArO(1S) to dominate the emission spectrum.
Acknowledgments
This work is partially funded by the TU/e-UU-UMCU Alliance program and associated with COST Actions PLAgri CA19110 and PlasTher CA20114. S Zhao also thanks for the support from China Scholarship Council. The authors sincerely thank Pieter Sanders and Ab Schrader for their technical assistance with experiments.
Data availability statement
The data that support the findings of this study are available upon request from the authors.