
Abstract
The aims of this study encompass the characterization of process parameters and the antimicrobial potential during operation of a novel non-thermal plasma (NTP) source in a duct system containing a particulate matter (PM) filter thus mimicking the interior of an air purifier. Simulating conditions of a long-term operation scenario, in which bacterial aerosols in indoor environments accumulate on PM filters, the filter surfaces were artificially inoculated with Escherichia coli (E. coli) and exposed to an air stream enriched with reactive species. Electrical power consumption, key plasma parameters, volume flow and air flow velocity, reactive gas species concentrations as well as inactivation rates of E. coli were assessed. The NTP operated at a gas temperature close to ambient air temperature and featured a mean electron energy of 9.4 eV and an electron density of 1 1019 m−3. Ozone was found to be the dominating reactive gas species with concentrations of approx. 10 ppm in close vicinity to the PM filters. An inactivation rate of 99.96 % could be observed after exposure of the PM filters to the gas stream for 15 min. This inactivation efficiency appears very competitive in combating realistic bacterial aerosol concentrations in indoor environments.
Export citation and abstract BibTeX RIS

Original content from this work may be used under the terms of the Creative Commons Attribution 4.0 license. Any further distribution of this work must maintain attribution to the author(s) and the title of the work, journal citation and DOI.
1. Introduction
People in industrialized nations spend about 90% of their lifetime in indoor environments (e.g. homes, offices, restaurants, and vehicles) hence indoor air quality is of central relevance to preserve human health [1, 2]. Air pollutants include gaseous compounds such as volatile organic compounds as well as particulate matter (PM). Following inhalation, PM at particle diameters <1–3 µm can diffuse deep into the lung tissue through the respiratory tract [3]. Among airborne particles of biological origin, often referred to as bioaerosols, pathogenic microbes are particularly relevant to public health as the cause of infectious diseases such as COVID-19, viral influenza and pneumonia.
Established measures to control indoor air quality are dilution with outdoor air (natural ventilation), heat ventilation and air conditioning systems (HVAC) and mobile air purifiers [4, 5]. Physicochemical technologies utilized for reduction of pathogenic microbes in indoor air environments include filtration, thermal treatment, ultraviolet (UV) exposure, electrostatic adsorbtion, microwave, chemical aerosolization, photocatalysis and non-thermal plasma (NTP) [5].
Aerosols can be removed from indoor air by deposition on PM filters. The filtration capacity of a PM filter could provide single pass efficiency of circa 80% for particles ⩾1 µm (ISO ePM1 80%, EN ISO 16890) and up to 99.995% for particles ⩽1 µm (ISO 50 U, ISO 29463). During the service life of PM filters and depending on their application, they not only accumulate airborne microbes but also organic matter and inorganic nutrients. But nonetheless, PM filters merely filter microbes rather than inactivating them. For example, Mittal et al studied the survival of microrganisms captured on sterile PM filters in the absence of nutrients and found out that some bacteria and fungi could survive on filters under normal operating conditions for up to 6 d and even up to 210 d in the case of viruses (macrophage MS-2 coliphage) [6]. When comparing PM filter efficiency of aerosols and bioaerosols, Miaskiewicz–Peska and Lebkowska observed reemission of trapped microorganisms, thus rendering a serious drawback of filtration without proper inactivation [7]. Another study by Kemp et al compared PM filter materials and their outcome in microorganism survival, and observed a 6-log-increase in microorganisms colony forming units (CFU) counts per m2 after 8 weeks of operation for both, PM filters manufactured from fibreglass and hygroscopic polymer fibres. They concluded that the major factor affecting microorganism survival and growth is the particulate matter accumulation on the filter material that serves as a nutrient reservoir [8]. A similar study by Majchrzycka et al investigated the survival of microorganisms on other types of protective air filters; half mask filtering face piece (FFP3R) and high-performance melt-down fabrics. It was found that the viability of microorganisms on a filter material depends on the kind of microorganism and the dust content on the material [9].
The promising potentials of NTP for inactivating microbial aerosols in gas streams have already been reported [10–15]. When operated in air, NTP refers to a combination of strong local electric fields, short-lived and long-lived reactive oxygen and nitrogen species (RONS), UV photons as well as energetic electrons and ions at gas temperatures close to ambient temperature [16]. The electrode configurations of plasma modules produce significantly lower pressure drop compared to PM filters thus contributing to the overall system performance [10]. However, emissions of long-lived reactive species with potential adverse effects on human health is a concern and needs to be properly controlled. A widespread solution is introducing layers of activated carbon downstream the plasma module that captures gases and chemical pollutants thus reducing toxic emissions. However, the pressure drop induced by this carbon layer puts the advantage of low pressure drop in plasma modules in perspective.
A recurring experimental approach in these studies was the determination of the inactivation efficiency when the aerosols passed a plasma electrode configuration (single-pass experiments). Gallagher et al observed a 1.5-log reduction of aerosolized Escherichia coli (E. coli) applying a multiple-electrode volume dielectric barrier discharge (DBD) configuration [11]. With the same setup, Vaze et al studied the role of ozone as an inactivating agent and found significantly reduced inactivation compared to plasma exposure for comparable ozone concentrations [12]. Operating another DBD configuration in a ductwork of 9 m length, Lai et al could inactivate E. coli, Pseudomonas alcaligenes and Staphylococcus epidermidis at efficacies of 20%–70% but did not observe inactivation of Micrococcus luteus and Serratia marcescens. It was found that the inactivation efficacy increased with air flow velocity and negative ion concentration but decreased at elevated relative humidity (rH) [10]. Combining a surface DBD configuration with ionic wind, Timmermann et al were able to increase the inactivation efficacy of aerolized E. coli to 75% compared to 25% for the surface DBD operation alone. The inactivation efficacy did not scale with ozone concentration [13]. With the same setup, Prehn et al could identify decreased inactivation efficacies for multidrug-resistant E. coli strains [14]. Bisag et al processed air streams containing S. epidermidis as well as purified ribonuleic acid (RNA) of SARS-CoV-2 with a parallel-plate volume DBD reactor. They found a log reduction of 3.76 for S. epidermidis and observed negative polymerase chain reaction sampling results for treated RNA samples compared to positive test results for untreated samples [15].
Even though a number of studies have been performed on the inactivation of bacterial aerosols applying NTP, there is still lack of knowledge on the performance of NTP in a synergistic assembly with PM filters. Therefore, the aims of this study encompass the characterization of process parameters during operation of a novel NTP source in a duct system as well as evaluation of antimicrobial efficacy. For accessing the antimicrobial effect, however, we aim to evaluate the efficacy of NTP for inactivating microorganisms residing in PM filters installed downstream the plasma source thus mimicking a long-term operation scenario in which microorganisms can accumulate on the PM filters of air purifying systems during their service lifetime.
2. Methods
2.1. Plasma source
A novel plasma source (PlasGlAiry®, Plasmatec GmbH, Adelebsen, Germany) was used throughout this study. As depicted in figure 1(a), it is based on the concept of volume DBD, where 20 individual electrodes arranged in one plane at an air gap of 1.5 mm form a DBD stack. Each individual electrode is made from a hollow glass cylinder with an outer diameter of 2 mm and a length of 128 mm. The cavities inside the glass cylinders are filled with a conductive material. A power supply (TRE510C, Cofi srl, Treviso, Italy) provides two connectors, each of which outputs a sinusoidal signal with a frequency of 50 Hz at a phase shift of 180° to each other. The electrodes of the DBD stack were alternately connected to the two outputs thereby maximizing the electric field in the gas gap between the glass surfaces of two neighbouring electrodes. Arranged orthogonally to an air flow, the DBD stack of 12.8 cm in width and 6.95 cm in height covers a total area of 89 cm2 in which a streaming gas is subject to the NTP ignited in the 19 gas spaces between two adjacent electrodes. Figure 1(b) shows a close-up photograph of plasma propagation in the gas gaps.

Figure 1. (a) Schematic of the DBD stack and equipment for electric characterization. (b) Photograph showing 6 electrodes and 7 gas gaps with the volume DBD operating in a diffused mode characterized by a multitude of microdischarges.
Download figure:
Standard image High-resolution image2.2. Plasma diagnostics
As depicted in figure 1(a), U-I-characteristics of the gas discharge were recorded by two voltage probes (P6015A, Tektronix, Wilsonville, OR, USA) and a current monitor (Model 411, Pearson Electronics, Palo Alto, CA, USA) connected to a digital storage oscilloscope (Model RTM3004, Rhode und Schwarz, Munich, Germany). The mean electric power was calculated by the U-I-method for a set of 77 consecutive waveforms applying the oscilloscope [17].
According to figure 2(a), an Echelle spectrograph (Aryelle Butterfly, LTB Lasertechnik Berlin GmbH, Berlin, Germany) equipped with an optical fibre facing the NTP was applied to obtain the optical emission spectroscopy (OES). The spectrograph covered the range from 190 nm to 450 nm at a spectral resolution of  = 15 000. Intensity calibration was performed by a calibrated deuterium lamp (DH-2000, Ocean Optics, Dunedin, USA). Given the low intensity of radiation, spectra were continously recorded at a constant integration time of 30 s per spectrum over a period of 4 h and finally accumulated to acquire sufficient signal-to-noise-ratio. Utilizing a set of methods described by Peters et al rotational and vibrational temperature as well as mean electron energy
  were derived from the accumulated spectral data [18]. Electron density
  was estimated by using the equation (1) with the measured current
  as proposed by Keller et al [19]

Figure 2. (a) Arrangement of the ventilation duct comprising the DBD stack and filter cartridge as well as equipment for gas phase and spectral analysis. (b) Photograph of the plane PM filter mounted to the filtercartridge. (c) Photograph of the other side of the same filter cartridge also housing the activated carbon fleece.
Download figure:
Standard image High-resolution imageThe cross-sectional area  of the plasma in m2 was calculated based on circular area with a radius of 85 µm according to micro photography (D90 + AF-S Micro NIKKOR 85 mm 1:3.5 G ED, Nikon Corp., Minato, Japan) analysis of multiple microdischarge channels depicted in figure 1(b). Values for mobility coefficient
  in m−1 V−1 m−2, reduced electric field
  in V m2 as well as the electron velocity distribution function
  in eV−3/2 were derived from the Boltzmann solver BOLSIG+ (12/2019) for a gas mixture of N2 (80%) and O2 (20%) at the mean electron energy
  derived from OES measurements [20]. Equation (2) was subsequently used to calculate reaction rates
  for selected inelastic collisions of electrons with the gas molecules of the ambient air, considering equation (3):
Data on cross sections  for electron collisions leading to dissociaton and ionization of O2 were obtained from [21], while data on vibrational exication, dissociation and ionization of N2 can be found in [22]. Furthermore,
  denotes the electron mass in
  ,
,  the elementary charge in
  and
and  the kinetic electron energy in
  . The species concentrations
  of N2 and O2, respectively, were calculated on the basis of a gas temperature equal to the rotational temperature (
 and atmospheric pressure for a gas mixture of 80% N2 and 20% O2.
2.3. Ventilation duct
Figure 2(a) shows the scheme of the experimental setup mimicking a typical arrangement of an air purifier. A cylindric ventilation duct of 100 mm in diameter and 160 mm in length comprises a duct insertation filter cartridge.
As depicted in figure 2(a), this cartridge is equipped with a single layer of plane PM filter material (synthetic F9 filter, JS Filtersysteme, Sinsheim, Germany) and activated carbon fleece (figure 2(c)) (C 20 C, Riensch & Held Hamburg GmbH & Co KG, Hamburg, Germany) at a strength of 16.5 mm. Downstream the cartridge, a fan (F12, Arctic GmbH, Braunschweig, Germany) was plugged to the duct. Operating at a power uptake of approx. 2 W, it induced a constant volume flow of 59.5 m3h−1 at an air flow velocity of 2.1 m s−1 in the duct according to differential pressure measurements (testo 512-1, Testo SE & Co. KGaA, Titisee–Neustadt, Germany) based on DIN EN ISO 5801 and fan characteristics. The same method was used to determine the pressure drop at the DBD stack to 0.2 Pa. At a distance of 100 mm upstream of the filter cartridge, the DBD stack was positioned in a square box comprising two holes of 100 mm in diameter. While one hole serves as air inflow, the other hole was connected to the cylindric ventilation duct.
Concentrations of reactive species in the ventilation duct were analysed by means of an ozone monitor (Model 106-L, 2B Technologies Inc., Broomfield, CO, USA) and a nitrogen oxide monitor (Model 405 nm NOx Monitor, 2B Technologies Inc., Broomfield, CO, USA). According to figure 2(a), the inlet of a hose with outer diameter of 6 mm was centred either at 2 mm distance upstream or downstream the filter cartridge, while the other end was split into two separate hoses each connected to one of the monitors. As a consequence, the constant volume flow through the hose close to the filter surfaces was approx. 0.15 m3 h−1. With this arrangement, O3 and NOx concentrations could be measured at the same time and space.
All experiments took place inside a laboratory fume hood (L × W × H = 1.19 m × 0.53 m × 0.74 m = 0.46 m3) connected to an exhaust system expelling 50.4 m3 h−1 according to Vane Anemometric measurements (EM54, FLIR Systems Inc., Wilsonville, OR, USA). The room air temperature and relative humidity (HL-1D, Rotronic Messgeräte GmbH, Ettlingen, Germany) were recorded during each experiment.
2.4. Bacteria culture
As a proof of principle, the gram-negative bacteria E. coli was used in this study. The E. coli strain DSM 11250 was purchased from DSMZCellDive (DSMZ-German Collection of Microorganisms and Cell Cultures GmbH, Braunschweig, Germany). In brief, E. coli was cultured in 5 ml Luria–Bertani broth (LB medium) with continuous shaking (300 rpm) overnight at 37 °C for 20 h. The bacteria were pelleted, washed twice and resuspended in 1 ml of a 1X phosphate buffer solution (PBS). The bacteria were next counted with the use of a haemocytometer. The final mixture was resuspended in 10 ml of 1X PBS mixture with a final concentration of 1 × 10⁷ bacteria ml−1.
2.5. PM filter contamination
Contamination of the filter material was performed with detached plasma module in figure 2. Instead, a humidifier (Super Fog II, Lucky Reptile, Waldkirch, Germany) was attached to the duct system with the PM filter installed in the filter cartridge. Prior to bacteria contamination, the PM filter was exposed to humid air conditions by operating the humidifier for 20 min. Afterwards, the solution containing E. coli as a contaminant, was aerosolized with the use of a nebulizer (Inhalator IN 500, Medisana, Neuss, Germany) until all 10 ml of the bacteria solution was used (approx. 20–30 min). In order to allow bacteria droplets to reach and be adjusted on the PM filter surface, 20 extra minutes without additional moisture supply were given as an adjustment phase before proceeding to the next procedures. After the 20 min adjustment phase, samples were taken by cutting two square pieces of the contaminated filter (2 × 2 cm2 each) as a control (no treatment) from the centre of the PM filter.
2.6. NTP treatment
For the NTP experiments, the remaining filter piece was mounted in the filter cartridge and the plasma module was re-attached to the duct system (figure 2). PM filters were then exposed to the reactive species in the air flow for either 5, 10 or 15 min of operation of the DBD stack. Following each treatment, two square pieces of each exposed filter were excised as previously described for the control sampling. Each experiment was performed in triplicates.
2.7. Bacterial extraction
The 2 × 2 cm2 square filters (either control or DBD-treated pieces) were submerged into a 50 ml conical tube containing 1X PBS (10 ml) and 5 sterile glass beads, 4 mm in size (Solid glass beads, Merck, Darmstadt, Germany). The filters were then incubated in this solution for 10 min. In order to extract the bacteria from the filter pieces, the tubes were continuously vortexed for 1 min. Serial dilutions were next made and the bacteria were plated on agar plates and incubated overnight at 37 °C for 18 h. The CFU were counted and CFU density on the filter material was calculated. The comparison of control and treated samples was statistically analyzed using a 2-tailed student's t-Test. A  value < 0.05 was considered statistically significant.
3. Results and discussion
3.1. Electrical and plasma characterization
The U-I-characteristics of the entire plasma module are given in figure 3. Each pole of the power supply outputs a sinusoidal voltage at a frequency of 50 Hz and a maximum voltage of  = 5.5 kV. Since the voltage profile of the two poles is 180 degrees out of phase with each other and the DBD electrodes are alternately contacted with the two poles, a maximum potential difference of
  = 11 kV in the gas spaces between two adjacent DBD electrodes can be observed. From the current characteristics depicting a multitude of short and successive charge transfer events it is evident that the discharge operates in the multi-filamentary mode. The mean electric power uptake by the plasma module is (4.3 ± 0.16) W and corresponds to an area power density of (118 ± 4.4) mW cm−2 in the gas.

Figure 3. U-I-characteristics of the DBD stack with the voltage waveforms of adjacent electrodes (see figure 1) given in red and blue, respectively. The waveform of the total current is given in green. Air temperature was 24.0 °C and rH was 41.6%.
Download figure:
Standard image High-resolution imageFigure 4 depicts an overview of the radiation emitted by the plasma of the DBD stack. The spectral lines derive from the second positive system  as well as the first negative system
  of molecular nitrogen. The absence of emissions from the
  -system
  of nitric oxide corresponds well with the comparatively low gas temperature and is a strong indicator, that the discharge operates in the O3-regime rather than in the NOx
-regime [23].
of nitric oxide corresponds well with the comparatively low gas temperature and is a strong indicator, that the discharge operates in the O3-regime rather than in the NOx
-regime [23].
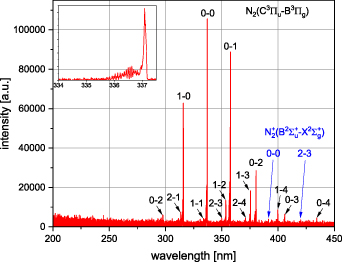
Figure 4. Emission spectrum of the DBD stack dominated by line emissions of the second positive system (black labelling) and the first negative system (blue labelling) of N2. The inset shows the hyperfine structure of the transition  . Air temperature was 26.9 °C and rH was 51.7%.
Download figure:
Standard image High-resolution imageAccording to table 1, the NTP produced by the DBD stack operates close to room temperature and comprises energetic electrons. Among the electron-impact reactions with the heavier gas particles, vibrational excitation of nitrogen molecules is most frequent followed by dissociation and ionization of N2 which is the reason for the high vibrational temperature of the plasma. In terms of the development of a reactive gas phase chemistry, the presence of atomic oxygen is an important prerequisite. Even though its direct production by electron-impact dissociation of O2 occurs at a rate 6 times lower than vibrational excitation of N2, other reactions such as electron-impact dissociation or electronic excitation of N2 contribute indirectly to atomic oxygen formation via heavy particle reactions [24].
Table 1. Data for rotational temperature  , vibrational temperature
  , mean electron energy
  , electron density
  as well as selected reaction rates
  for electron collisions with molecules.

|

|

|

|
|---|---|---|---|

|

|

|

|
|

| ||

|

| ||
|

| ||
|

| ||
|

| ||
3.2. Gas phase analysis
The concentrations of O3 and NO2 as well as NO at two different locations in the duct system during exposure of microorganisms are presented in figure 5. In close vicinity to the PM filters (upstream filter cartridge), quasi-stationary concentrations of reactive species establish 1 min after plasma ignition. Time-averaged concentrations until the end of the monitoring period of 32 min amount to (10 812 ± 551) ppb for O3 and (286 ± 13) ppb for NO2. Data for NO is close to or below the detection limit of 1 ppb and is therefore not analysed.

Figure 5. Temporal characteristics of reactive species concentrations (a) in close vicinity upstream to the PM filter surface and (b) after passage of the activated carbon layer. Air temperature was 22.5 °C and rH was 47.7%.
Download figure:
Standard image High-resolution imageThe concentrations of reactive species are significantly lower downstream the activated carbon layer due to catalytic reactions of the reactive gas species. According to figure 5(b), it takes 2.5 min for NO2 to reach stable concentrations, while the concentrations of NO and O3 could not achieve stability within the observation period. The time-averaged concentrations between 2.5 min and 30 min after plasma ignition are (455 ± 48 ppb) for O3, (119 ± 5) ppb for NO2, and (62 ± 9) ppb for NO. These values were significantly reduced compared to upstream of the PM where O3 showed the strongest reduction by a factor of 24. Further adjustments to the ozone filter in our system will need to be considered for future investigations in order to control the ozone emission in compliance with the WHO Air Quality Guidelines (maximum of 50 ppb in an 8 h period per day) [25].
3.3. Antibacterial efficacy
The antimicrobial potency of the DBD stack was tested and figure 6 shows the survivability of E. coli after exposure to the gas stream enriched with reactive gas species.

Figure 6. Reduction in E. coli survival after DBD treatment. The response of bacteria survival after exposure for three different time points (5, 10 and 15 min) was measured. The resulting colonies in agar plates were counted and the response was measured in CFU per cm2. Data is provided as mean ±SE. *p < 0.05, ** p < 0.01. Air temperature was 22.5 °C and rH was 48.1%.
Download figure:
Standard image High-resolution image
The increase in the length of treatment corresponds with a higher mortality rate in E. coli. The reduction rate rises with increasing exposure time of the inoculated PM filters to the constant volume flow containing reactive species. We observed a maximum reduction rate of 99.96% after 15 min exposure. Even though the mechanisms by which NTP inactivates bacteria are not yet completely understood, it is widely accepted, that reactive gas species play an important role and interaction with the cell membranes and cell interior can ultimately lead to cell inactivation [26]. For our experimental conditions, only long-lived species such as O3 and NOx should contribute to these interactions. Since the temperature of the microdischarges as the hottest element in our experimental setup is close to room temperature according to the results in table 1, we conclude that heat energy plays a minor role in our experiments.
Table 2 summarizes the characteristics and results of studies with similar objectives. Comparison of different plasma devices in regards to energy density. However, these were conducted with different plasma sources, bacterial species, exposure times, or experimental conditions and microbiological methods. The energy densities were calculated to enable a comparative discussion.
Table 2. Characteristics and results of similar approaches.
| NTP source | Bacterial species | Power density (W cm−2) | Time (s) | Energy density (J cm−2) | Reduction | References |
|---|---|---|---|---|---|---|
| Surface DBD | S. aureus | 1.3–3.4 | 300 | 390–1020 | 99.99% | [27] |
| Volume DBD | E. coli | 0.118 | 900 | 106 | 99.96% | This work |
| Volume DBD | E. coli | 0.118 | 600 | 71 | 98.91% | This work |
| Volume DBD | E. coli | 0.118 | 300 | 35 | 97.25% | This work |
| Packed-bed DBD | E. coli | 0.2 | 1 200 | 240 | 98.35% | [28] |
| Packed-bed DBD | M. luteus | 0.2 | 1 200 | 240 | 70.69% | [28] |
| Corona | Undefined | 0.0075 | 3 600 | 27 | 68.65% | [29] |
A study by Kelly–Wintenberg et al obtained similar results for an effective sterilization of the air filters against S. aureus. Main differences to our approach, however, were the use of a planar plasma electrode configuration based on surface DBD directly integrated directly on the surfaces of a high efficiency particulate air (HEPA) [27]. With their setup, they achieved 99.99% bacterial reduction after 5 min. When comparing practical aspects of both concepts, our system consists of modular components and a change of the PM filter after its service lifetime can be performed without affecting the plasma electrode arrangement. In terms of energy efficiency, our setup obtains almost identical inactivation results at only a quarter of the energy requirement. However, it is well established that gram-negative species are more susceptible to NTP than gram-positive species, which might explain this observation [28, 30].
Park et al proposed a packed-bed reactor comprising dielectric beads in combination with a HEPA filter and an ozone catalyst installed in some cm distance downstream the reactor for disinfection of circulating air [28]. They observed a reduction of 98.35% after 20 min operation for E. coli and 70.69% for M. luteus, respectively. While we operated our setup at only half the energy density of Park et al we could achieve a comparable inactivation of E. coli.
A recent study has applied a system that was similar to our approach but in a larger scale and also applying simultaneous filtration and decontamination with NTP. As opposed to our system, they used a combination of a corona discharge array, a metal foam as a PM filter, a mesh electrode and two ozone filters. Methodically, they collected bacteria from a 50.4 m3 office on the PM filter during one-hour-operation of their air purifier and refrained from artificial inoculation of PM filter surfaces. According to table 2, the authors showed a 68.65% reduction of undefined airborne bacteria at 27 J cm−2 of energy density [29]. At an energy density comparable to Li et al, we could achieve 97.25% inactivation of E. coli. Even though the results cannot directly be compared due to differences in the experimental design and uncertainties concerning bacterial species, the results of Li et al can serve as a platform for future applications of our system in real indoor environments.
3.4. Relevance for indoor environments
Up to now, no international threshold values for acceptable bacterial aerosol concentrations in indoor environments exist due to the lack of data on exposure-response relationships [31]. Still, numerous studies have accessed the bacterial aerosol concentrations in different indoor environments and found levels between 170 CFU m−3 in operating theatres in hospitals to 3224 CFU m−3 in primary schools [32, 33]. Considering continuous operation of our experimental setup in such environments, we can estimate a continuous depositon of bacterial aerosols on the PM filter at a rate of 106–107 CFU m−2 h−1. From the data presented in figure 5, we determined the inactivation rate in units if CFU m−2 h−1 for each exposure time separately and subsequently calculated the mean value and standard deviation from the individual rates. The mean inactivation rate induced by our setup and for our experimental conditions can be estimated to (1.7 ± 0.6) 109 CFU m−2 h−1. Even though this ratio is encouraging, the inactivation rate is valid only for gram-negative E. coli under our experimental conditions. Dominant bacterial species found in indoor air of hospitals, museums, offices, residences and classrooms are often from the genus Bacillus, Micrococcus and Staphylococcus [34]. As these gram-positive bacteria were generally found to be less susceptible to NTP than gram-negative bacteria, the inactivation rate of our apparatus calculated in this study cannot directly be transferd to realistic indoor environments [30].
4. Conclusion
Our study provides key plasma parameters of a novel plasma source developed for air hygiene applications and identifies ozone as the dominant reactive gas species to interact with components installed downstream the plasma module. The construction of an air filter microorganism-contaminator equipment facilitated a successful aerosolization of bacterial cells and evenly diffused them into the PM filters.
Mimicking conditions in the interior of an air purifier it was found, that exposure of microrganisms entrapped on a PM filter to a continuous air stream enriched with reactive species produced in the NTP was effective against E. coli. Based on the results of this study, the added value of the approach and specifically the plasma source for the hygienic treatment of indoor air can be derived. Once airborne bacteria on the PM filter surfaces are inactivated shortly after their deposition, the risk of bacterial re-emission through biofilm formation or spore formation can be significantly reduced. These results are thus relevant not only for mobile air purifiers but also for upgrades of existing HVAC installations. Upcoming studies will address the antimicrobial efficacy of the setup on a variety of microorganisms relevant for airborne infections. Another aspect that will be investigated, is the impact of a continuous inflow of reactive species on the PM filter materials and its effects of the filter longevity and structural integrity in order to find the optimal conditions for filter replacement frequency.
Acknowledgments
The authors would like to thank Mikail Augustin and Rinat Ortmann for creative solutions and valuable mechanical contributions to the experimental setup. Our gratitude also goes to Dr Marcus Schmidt for sophisticated ideas and fruitful discussions on fluid dynamic aspects.
Data availability statement
All data that support the findings of this study are included within the article (and any supplementary files).
Funding
The funding by the Ministry of Science and Culture of Lower Saxony with funds from the European Regional Development Fund (Grant Nos. ZW7-85150529 and 11-76251-34-1/19 (ZN3694)), European Innovation Partnership (Grant No. EIP: 143510), Deutsche Forschungsgemeinschaft (DFG) (Grant No. 531884996) as well as the German Federal Ministry of Education and Research (Grant No. 13FH6I09IA) is gratefully acknowledged.
Conflict of interest
The authors declare no conflicts of interest.