
Abstract
Facilitating the separate production of ozone (O3) and nitrogen oxides (NOx) in air discharges without a thermal process is of most merit in diversifying plasma technology; in particular, it is a primary requirement in certain cold, heat-sensitive plasma applications. Here, we propose a new method of nonheating ozone suppression in air discharges. The present work demonstrates that controlling the plasma chemical kinetics by adjusting the duration (width) and/or repetition frequency of the high-voltage DC pulse is effective in suppressing ozone formation in a surface dielectric barrier discharge in static ambient air. The temporal development of each oxygen- and nitrogen-related species in air discharge is complicated and shows different trends in the time range <10 µs; relatively long-lived O3 and NOx are strongly governed by the temporal behavior of short-lived reactive species, such as excited N2(A) and N2(v). To quantify time-varying O3 and NOx, an in situ UV absorption spectroscopy is applied to our gas-tight plasma reactor, which is operated in air at 21 °C. With a fixed frequency at 10 kHz and decreasing pulse duration from 10 μs to 0.18 μs, ozone is quenched faster in the plasma reactor, resulting in an irreversible chemical mode transition from an O3- to NO-rich environment. From a different set of experiment (with a 200 ns pulse duration and a frequency range of 1–10 kHz), we can conclude that the off-pulse period also plays a crucial role in the temporal evolution of O3 and NOx; the larger the applied driving frequency is, the earlier the ozone-free phenomenon appears over the discharge time. Our findings represent a breakthrough in expanding the usage of air discharges and their application in various fields of interest.
Export citation and abstract BibTeX RIS

Original content from this work may be used under the terms of the Creative Commons Attribution 4.0 license. Any further distribution of this work must maintain attribution to the author(s) and the title of the work, journal citation and DOI.
1. Introduction
Globally, as part of chemical manufacturing is moving towards 'localization' to meet increasing demands for onsite applications, research areas relevant to decentralizing chemical production are rapidly growing and opening a new era of chemistry and similar fields. Increasing attention has thus been paid to potential technologies, including electrocatalysis [1, 2] and plasma catalysis [3–6]. From a practical standpoint, simple, reliable, and low-maintenance facilities should be primarily considered in conjunction with such chemical production methods. In particular, with the satisfaction of these requirements, since low-temperature plasma has been recognized as 'highly competitive, versatile green technology', various types of plasma sources and technologies have been investigated for application in clinical engineering for nitric oxide (nitric monoxide, NO) production [7, 8] and in chemical engineering for ammonia [3, 9] and hydrogen peroxide [10, 11] synthesis.
Despite many types of plasma apparatus that have been created during the last century, dielectric barrier discharge (DBD) is still considered one of the most scientifically interesting and practically useful plasmas, partly due to its attractive features, such as great operational reliability and reproducibility in atmospheric ambient air. In some of the plasma-aided processes with DBDs developed on a commercial level, the air is mostly or obligatorily used as a background gas instead of pure nitrogen, oxygen, or synthetic dry air because supplying ambient air using conventional compressors is the most cost-effective and simple approaches to improve the running cost-efficiency and maintenance. In such cases, the simultaneous generation of gaseous ozone (O3) and nitrogen oxide (NOx ) is an unavoidable issue, limiting the practical usage of plasma in certain applications. For example, while ozone is an invaluable species in some plasma applications, from sterilization [12] to gas/water purification [13, 14], ozone-free nitric oxide production is worthy of notice for applications ranging from medical purposes, such as wound disinfection/healing [15, 16] and inhalation therapy [7], to food engineering [17]. Ozone-free plasma operation is particularly imperative for household appliances equipped with a plasma apparatus because exposure to ozone at high concentrations can lead to serious health issues; the maximum ozone level allowed in South Korea is 0.06 ppm in the working environment when exposed for 8 h per day. Thus, facilitating the separate production of ozone and nitrogen oxides in plasma is good for expanding plasma usage and improving its performance for specific purposes, but it is a longstanding challenge in plasma science.
Considering the chemical reactions among O3 and NOx (x = 1–3), O3 and NO3 are major products at room and relatively low temperatures, while NO and NO2 are dominant at higher temperatures. Thus, most of the NO generators reported thus far are based on arc [18], spark [16], or heated surface [19, 20] discharges, where the gas temperature in such plasma reactors is very high. Malik et al [19] reported that in an air-flowing plasma reactor, heating the DBD surface not only eliminated O3 and minimized NO2 but also resulted in a significant increase in the concentration and energy yield of the NO product. Park et al [20] revealed that the rapid change in the temporal behavior of O3 and NOx due to their interplay strongly depended on the reactor temperature, which ranged from 25 °C to 250 °C. In this regard, ongoing efforts have been made to find a way to obtain an ozone-zero mode in plasmas without controlling the gas temperature. Shimizu et al [21] and Pavlovich et al [22] demonstrated that the time dependence of ozone production in surface DBDs is coupled with the electric power dissipated to the plasma. Both previous studies found that O3 can be notably suppressed over a certain power density.
As a novel attempt to address the aforementioned issues and practical limitations of air discharges, we here propose a new method of ozone suppression in air discharges without increasing the gas temperature. Control of the temporal chemical kinetics by adjusting the pulse duration and repetition frequency of the high-voltage DC pulse is a key mechanism of this approach. As follows, we are able to demonstrate the ozone-zero phenomenon, free from the gas heating effect by the plasma itself, using a gas-tight chamber equipped with surface DBDs produced in static ambient air, especially and with an in situ UV absorption spectroscopy that allowed us to noninvasively and instantaneously measure the time-dependent O3, NO, and NO2 concentrations.
2. Methods
Figure 1(a) shows the top and side views of the DBD apparatus, which consisted of two sheet electrodes attached to each side of a 1 mm thick, 100 × 100 mm2 alumina plate. One electrode was grounded, and the other was connected to a high-voltage DC pulse system consisting of a pulse generator (Directed Energy PVX-4110), a high-voltage DC power supply (Matsusada Precision AU10P-220), and a signal generator (Keysight Technologies 33512B). Both electrodes that are in direct contact with the plasma were composed of a nickel–chromium alloy to prevent rapid oxidation of the electrodes due to highly oxidizing plasma species. Symmetric surface discharges were produced at both sides of the alumina plate, as drawn in figure 1(a), in ambient air (21 °C temperature and 33% relative humidity) using 10 kV unipolar voltage pulses with a driving frequency of 1–10 kHz and a pulse width of 0.18–10 µs. To estimate charge accumulated on the plasma source (not shown here), a 100 nF blocking capacitor was serially connected to the ground electrode. The voltage applied to the DBD source was measured using a 1000:1 high-voltage probe (Tektronix P6015A) connected to a 1 GHz oscilloscope (Tektronix DPO4104B-L), while the voltage across the 100 nF capacitor was measured using a 10:1 voltage probe (Tektronix TPP1000). A current probe (Tektronix P6021A) was used to measure the current waveform.
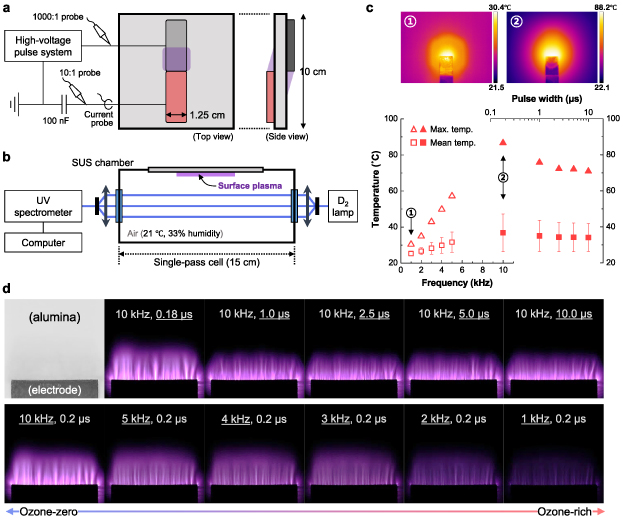
Figure 1. Experimental information on the surface DBD reactor. (a) Schematic drawing (not to scale) of a DBD source configuration consisting of two electrodes and a sandwiched alumina plate with the relevant electronics. (b) Schematics of a plasma chamber equipped with the DBD source and an in situ UV absorption spectroscopy system for quantifying ozone- and nitrogen-related species. (c) Two representative infrared (thermal) images, and measured surface temperature of the DBD apparatus as a function of the driving frequency and pulse width for a fixed pulse width of 200 ns (open symbols) and a fixed frequency of 10 kHz (closed). (d) Real photographs of the plasma area and corresponding driving parameters tested in this work. The electrode width of 12.5 mm is used as a substitute for scale bars in (c) and (d).
Download figure:
Standard image High-resolution imageThe DBD plate occupied one of the walls in the test chamber, as illustrated in figure 1(b); thereby only one of the discharge areas was included in the test volume. The surface temperature (Ts) of the DBD apparatus (figure 1(c)) was measured using an infrared (thermal) camera (FLIR A305sc), and the plasma photographs provided in figure 1(d) were taken using a Canon EOS 1D Mark II camera combined with a Canon EF 180 mm macro lens. The camera settings of the images were f/10, ISO 500, and 0.5 s exposure time. The scattered data in figure 1(c) represent the mean ± SD along with the maximum value in thermal images; two example images are included in the figure. Note that the surface temperature is more essential in the chemical kinetics of the plasma and nearby areas than the gas temperature measured near the surface, for which an underestimated temperature due to the poor thermal conductivity of air can make one overlook thermal deposition of O3 in similar works.
Instead of the Lissajous method, the time-averaged electric power dissipated to plasma was calculated by multiplying the instantaneous voltage and current traces (figure 2(a)) and then averaging over repetition periods. Note that the different signal delays introduced by the electric probes were taken into account in the process for accurate estimation. The calculated power of plasmas used in this study is presented as a function of the pulse width and repetition frequency in figures 2(b) and (c), respectively.
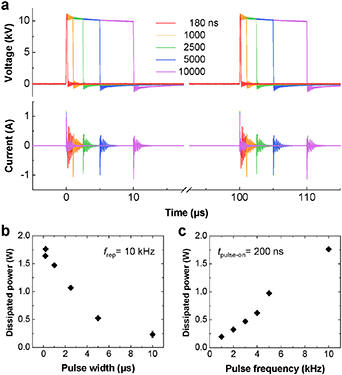
Figure 2. Electrical characteristics of the surface DBD. (a) Voltage and current waveforms with different pulse widths and 10 kHz repetition frequency. (b), (c) Time-averaged power dissipated to the plasma as a function of (b) the pulse width and (c) repetition frequency.
Download figure:
Standard image High-resolution imageA cuboid plasma reactor consisting of a gas-tight, stainless-steel chamber (outer dimensions of 15 × 15 × 10 cm3 and inner volume of 815 cm3) and two fused silica windows for optical absorption spectroscopy was employed in this work (figure 1(b)). In situ UV absorption spectroscopy has merits for this kind of work because O3, NO, NO2, and NO3 can be simultaneously quantified with a good time resolution. Moreover, it is much more cost-effective, easy-to-install, and straightforward than other diagnostics, such as the Fourier transform infrared spectroscopy and laser-based measurements; in particular, it can be nonintrusively applied to plasma reactors without sampling the gas, which induces gas flow and temperature perturbations. The absorption spectra over the wavelength ( ) range of 190–380 nm were obtained using a deuterium (D2) lamp (Ocean Insight DH-mini) and a spectrometer (Ocean Insight Maya2000 Pro). The absorption path length was set at 150 mm. UV light was guided through an optical fiber (Ocean Insight QP400-2-SR) with a core diameter of 400 μm, and the fiber was connected to a collimating lens adaptor (Ocean Insight 74-UV) to collimate the light into the chamber. The same optical configuration was used to detect the light passing through the chamber volume by the spectrometer, as presented in figure 1(b). The spatial spread of the beam through the lens was 5 mm, and the integration time of spectrometer was 250 ms. Each spectrum used for determining the concentration of each chemical species was obtained by averaging two 250 ms integrated spectra, and therefore the time interval between adjacent data points was 500 ms. All spectra were automatically acquired by a computer.
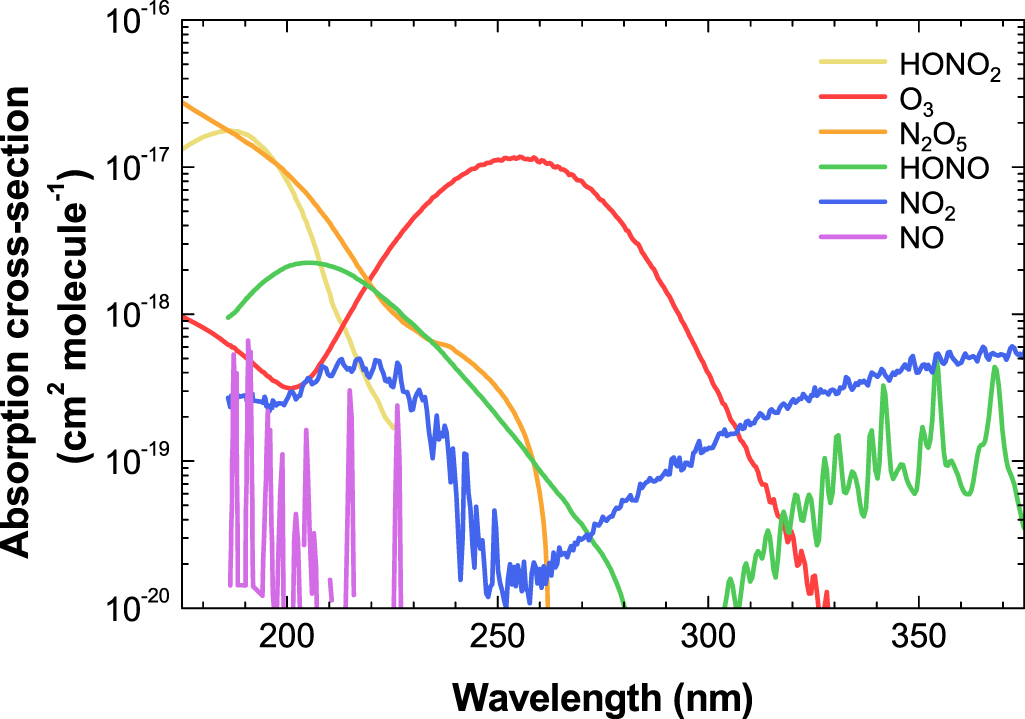
The absorption cross-section ( ) of ozone and nitrogen-related species over the spectral range of 175–375 nm used in this work is depicted in figure 3. As shown in the figure, each measurable species has its highest cross-section at different wavelengths (e.g. O3 at 253 nm and NO2 at 375 nm) or distinctive spectral peaks and profiles (NO, HONO, and HONO2). An extended absorption spectrum in the visible range (not shown here) is sufficient for also quantifying NO3 in DBD reactors [20]. However, note that estimation of the chemical concentration based on the absorbance at a single selected wavelength, instead of the full spectrum, could lead to an erroneous result. To obtain the synthetic absorption spectra and absolute concentrations of chemical species, the absorbance
  was calculated following the Beer–Lambert law,
  , where n is the concentration of chemical species in molecules cm−3,
  is the absorption path-length (15 cm for this work), and the subscript
  indicates each chemical species.
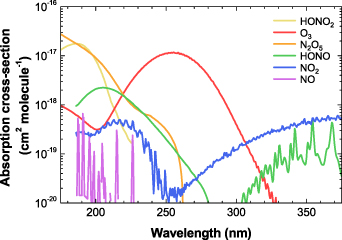
Figure 3. Colored curves showing the spectral absorption cross-sections of chemical species on a log scale in the wavelength range of 175–375 nm: O3 [23], NO [24], NO2 [25], N2O5 [26], HONO [27], and HONO2 [28].
Download figure:
Standard image High-resolution imageA large amount of nitrous oxide (N2O) is also produced in air discharges [29]. However, it was not possible to determine its concentration by means of absorption spectroscopy in our case because the absorption cross-section of N2O at smaller than 220 nm is much lower than that of other species (HONO2 and N2O5), and the absorption spectrum of N2O largely overlaps with the spectra of those species.
Prior to the experiments, repeated cycles of 5 min plasma operation and gas purging were performed several times to avoid an aging effect on the results. Between two successive experiments, plasma-activated air containing O3 and NOx from the previous experiment was completely replaced by unpolluted ambient air. After air had filled the chamber, surface DBDs were produced with different voltage waveforms, and UV absorption spectra were simultaneously recorded to quantify chemical species. Each experiment under one driving condition was repeated three times with the same device without any replacements.
3. Results and discussion
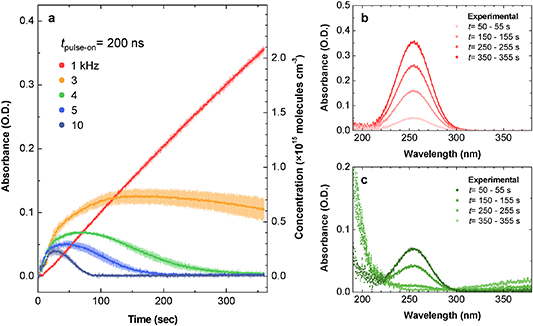
Figure 4 shows the time evolution of the absorbance at 253 nm and the corresponding ozone concentration in the DBD reactor with different pulse widths and a fixed repetition frequency (frep) of 10 kHz. Ozone was actively formed immediately after the plasma was turned on (at t = 0 s), and its concentration gradually increased in the first seconds (figure 4(a)). However, the slope of the curves, dn(O3)/dt, that is, the formation rate of O3, significantly varied with time, depending on the pulse width; the shorter the applied pulse width was, the faster the curve slope decreased (i.e. the faster ozone quenching was). Consequently, in the case of a <1 µs pulse width, the concentration reached a peak at certain times, and the increasing trend was then reversed, which is very similar to the O3 dynamics in plasma reactors at reactor temperatures greater than 100 °C [20]. Here, neglecting the temperature effects is acceptable since the small variation in the maximum Ts at the DBD surface (ΔTs,max = 15.7 K) has little to no effect on the O3 kinetics, as seen in figure 1(c). In addition, the mean Ts was maintained at <40 °C in all investigated cases.

Figure 4. Ozone production in the DBD reactor with different pulse widths. (a) Measured absorbance at a wavelength of 253 nm over the discharge time, indicating the temporal evolution of the ozone concentration. The DBD source was operated with a 10 kHz frep and a pulse width range of 0.18–10 µs. Data in (a) represent the mean ± SD obtained from three independent measurements. (b), (c) Time-averaged absorption spectra obtained from the (b) 0.18 µs and (c) 10 µs cases at t = 355–360 s, depicted by scatter points. The experimental spectra are compared with fitted synthetic curves obtained from the spectral absorption cross-section of each chemical species given in figure 3. The corresponding concentrations estimated using the nonlinear least squares method are discussed in the text. Plotting the absorbance on a linear scale clearly separates the chemical species.
Download figure:
Standard image High-resolution imageComparative examples in figures 4(b) and (c) show that the spectral distribution of the time-averaged absorbance in the range of 190–380 nm at t = 355–360 s is sufficient for the identification of chemical species and implies a significant difference in the chemical constituents in the plasma reactor with 0.18 µs and 10 µs pulse widths. In figure 4(b), the fitted synthetic spectrum denoted by a red solid line is a convolution of the spectrum of each species and yields 5.9 × 10¹⁵ molecules cm−3 of O3, 4.0 × 10¹⁴ molecules cm−3 of N2O5, and 1.5 × 10¹⁵ molecules cm−3 of HONO2; these data fit well with the measured spectrum of the 10 µs case. Some species have spectral distributions of absorption cross-sections similar to those of N2O5 and HONO2, but these two were chosen in the fitting because the other species have lower concentrations [29] and absorption cross-sections.
Hereinafter, to qualitatively analyze the O3–NOx interplay and consequent O3 dynamics, we referred to the well-simulated chemical kinetics in the DBD afterglow after a single pulse provided in [30] and figure 3 therein. After a single surface discharge is ignited, nitric oxide explosively forms, resulting in a two-order-of-magnitude larger concentration of NO than that of O3. However, as ozone is logarithmically produced via O + O2 + M → O3 + M (where M is air molecules), the concentration of NO is rapidly reduced via deep oxidation by O and O3 (e.g. overall reaction NO + 2O3 → NO3 + 2O2) and becomes lower than the O3 concentration at a certain time within a repetition period (100 µs) of the voltage pulse. Consequently, in the larger pulse width cases, O3 and the products of NO2 and NO3 (e.g. via NO2 + NO3 + M → N2O5 + M; 2NO2 + H2O → HONO + HONO2; NO2 + OH + M → HONO2 + M) are mainly produced by each single discharge and can be continuously accumulated in the reactor over the discharge time, whereas NO is relatively limited (figures 4(a) and (b)).
On the other hand, in the case of a 180 ns pulse width, NO and NO2 became the two dominant absorbers while the strong O3 absorption band entirely disappeared (figure 4(c)); the synthetic spectrum yielded 1.47 × 10¹⁵ molecules cm−3 of NO, 4.8 × 10¹⁵ molecules cm−3 of NO2, 5.33 × 10¹⁴ molecules cm−3 of HONO, and 1.0 × 10¹⁴ molecules cm−3 of N2O5. The NO2 concentration gradually increased as the 250–375 nm absorption band appeared, and HONO appearing with NO was observed rather than HONO2 in the absorption spectrum via NO + OH + M → HONO + M and NO + NO2 + H2O → 2HONO.
As presented in [30] and figure 3 therein, in the early period of a single discharge (<1 µs), nitric oxide is primarily produced owing to very short-lived species, such as excited N2(A) and N2(v > 4), where v is the vibrational quantum number (e.g. via O + N2(A3∑) → NO + N(2D); NO2 + N2(A3∑) → NO + O + N2; O + N2(v) → NO + N), while a small amount of O3 forms. According to the previous experimental and modeling results in a nanosecond pulse discharge [31] and burst-mode micro discharges [32], the higher the vibrational level v is, the faster the decay of N2(v) due to the vibrational relaxation of the higher vibrational levels relaxing towards v = 0 and 1 levels. This means that the formation rate of NO immediately decreases along with the decay of excited N2 molecules over the on-pulse time within a repetition period (100 µs) of the voltage pulse. Thus, when a polarity of the surface discharge changes fast before NO and excited N2 decay by applying a short DC pulse, NO produced by a single discharge can be retained more than O3, thereby resulting in O and O3 quenching early, as observed in the 180 ns pulse width case of our experiment. In short, due to the significant difference between NO and O3 kinetics after a single discharge due to short-lived N2(A) and N2(v), we can limit ozone formation in the air discharge by nanosecond pulse operation.
For the sake of direct comparison, the time evolution of the O3, NO, and NO2 in the 180 ns case obtained from the absorption spectra is plotted together in figure 5. When the ozone concentration drops and becomes lower than the detection limit within 120 s, both NO and NO2 steadily accumulate in the reactor. Notably, NO overcomes oxidation reactions and highly exceeds the formation rate and concentration of NO2, which can be achieved at gas temperatures higher than 300 °C [19].

Figure 5. Time evolution of the O3 (black), NO (red), and NO2 (blue) concentrations in the plasma reactor operated with a 180 ns pulse width and a 10 kHz frep. Data are extracted from the absorption spectra, including those in figure 4(c). Note that the ozone concentration is multiplied by 50 for comparison. Data represent the mean ± SD obtained from three independent measurements.
Download figure:
Standard image High-resolution imageAlong with the chemistry discussed above, transport of the chemical species inside the reactor can also be of great importance. The electrohydrodynamic (EHD) flow, the so-called 'electric wind', induced in weakly-ionized, collisional plasmas (including DBDs) can also play a critical role in the pulse width dependence of O3 and NOx . As revealed by our previous work [33, 34], the EHD flow speed decreases and becomes close to zero with decreasing pulse width and fixed frep. This means that the shorter the pulse width is, the longer the residence time of long-lived species in the plasma region, which is the hottest spot in the reactor (figure 1(c)). We can see peaks and troughs in the curves in the inset of figure 4(a), which implies that chemical transport is clearly affected by the induced electric wind rather than by diffusion. Thus, the ozone formation rate (slope) may be reduced with decreasing pulse width, as seen in the inset. Note that all experiments were conducted in static air; there was no artificial gas flow in the chamber.
Having discussed the role of the on-pulse period (pulse width) in the chemistry in air plasma, we now turn our attention to plasmas with different off-pulse periods. Although the pulse width was fixed at 200 ns, a dramatic change in O3 production was also observed in cases with a frep range of 1–10 kHz (figure 6); as frep was decreased, the maximum O3 concentration increased, and the decay of O3 after reaching the peak became slower (figure 6(a)). In particular, the case of 1 kHz frep showed almost linear dn(O3)/dt, which is considerably different from not only the other cases in figure 6(a) but also the ozone-rich results in figure 4(a). By comparing the absorption spectra in figure 6(b) with those in figures 6(c) and 4(b), nothing was detected other than the O3 absorption band, indicating that O3 was exclusively produced in the 1 kHz case. This result implies that DBD with lower pulse frequency and pulse width is capable of producing highly pure O3.
Figure 6. Ozone production in the DBD reactor with different pulse frequencies. (a) Measured absorbance at a wavelength of 253 nm over the discharge time, indicating the temporal evolution of the ozone concentration. The operating condition of the DBD source is a 200 ns pulse width with a frep range of 1–10 kHz. Data in (a) represent the mean ± SD obtained from three independent measurements. (b), (c) Time-dependent absorption spectra obtained from the (b) 1 kHz and (c) 4 kHz frep cases.
Download figure:
Standard image High-resolution image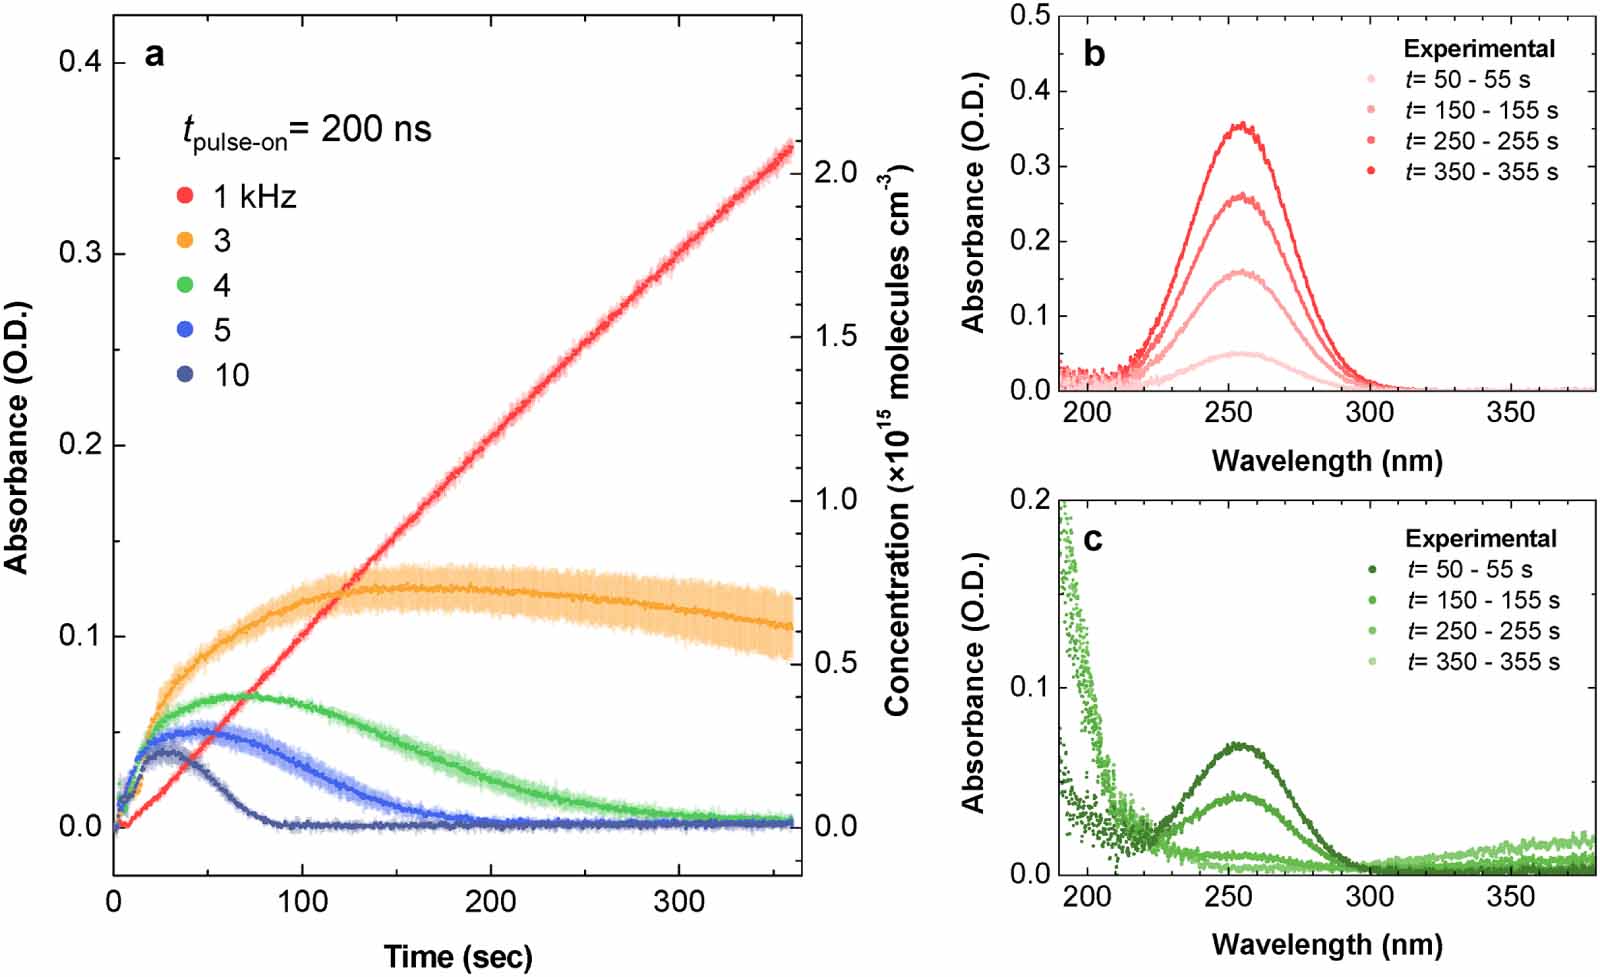
The time evolution of the O3 concentration in figure 6(a) is very similar to the result of an earlier study by Shimizu et al [21], even though sinusoidal voltage waveforms were used in their experiments. They clearly show the power dependence of the ozone dynamics in a DBD reactor by controlling the frequency in the range of 0.005–10 kHz, corresponding to the input power range of 0.15–2200 mW cm−2, instead of adjusting the voltage amplitude. Nevertheless, the contribution of a raised gas temperature to the thermal decomposition of O3 with larger input powers has not yet been clarified, and the frequency dependence of the time constant of the N2(v) vibrational temperature (referred to as τv
therein) and/or the steady-state vibrational temperature ( ) has remained an open question, and our understanding is as follows.
Because time-resolved populations of N2(v) exhibit different decay trends—the larger v is, the faster the decay of the N2(v) population [31]—the long-term variation in N2(v) populations and the corresponding Tvib should be affected by the time interval between two successive pulse discharges. In other words, the time for Tvib to reach a sufficient value that determines the N2(v > 12) population can be decreased with increasing frep. Moreover, as more pulses are applied in the same period, i.e. a higher frep is applied, more power is dissipated to the plasma, which leads to more vibrational excitation of N2(v) and thus a higher Tvib [35], which supports the present observation. Comparing figure 6(c) with figure 4(c) partly implies that a sufficiently high Tvib is also important to produce a NO-rich mode; otherwise, NO2 and HONO2 instead become dominant after O3 quenching.
One possible scenario of abundant O3 with regard to the 1 kHz case is as follows. The reduced gap voltage of the 1 kHz pulsed DBD due to the long off-pulse period can lead to operation with diffusive surface discharges (called silent discharges) in the absence of filament discharges (see figure 1(d)), which show higher electron energy and ro-vibrational temperatures of N2. This means that such mild operation of DBD with a lower frep can minimize O3 quenching and create O3-enriched conditions.
4. Conclusion
In our experiments, ozone-zero plasma operation is successfully achieved with sub-microsecond pulse widths and sufficiently high frequencies, although the spatially averaged surface temperature of the DBD apparatus is maintained at <40 °C, which is naturally raised by the plasma itself. In most cases, in the early discharge phase, O3 formed rapidly and an O3-dominant environment was created in the plasma reactor. After a certain time, depending on the pulse width and frequency, the absorption spectrum showed a continuous increase in NO and NO2 over time, whereas the O3 level was reasonably diminished, which is called the chemical mode transition from O3 to NOx or the O3-zero phenomenon. This mode transition and the consequent ozone-zero phenomenon occur faster over the plasma-on time with decreasing pulse width and increasing frequency. Our findings indicate that tailoring N2(A) and N2(v) by adjusting the pulse width or tailoring Tvib by adjusting the pulse frequency is a breakthrough approach in air plasma chemistry. We believe that understanding the nonlinear effect of the duration and repetition rate of DC pulses on long-term O3 and NOx dynamics will lead to better control and optimization of air discharges, especially for applications in biomedical, food, and agriculture industries.
Acknowledgments
This work was supported by the R&D Program of 'Plasma Advanced Technology for Agriculture and Food (No. 1711124797)' through the Korea Institute of Fusion Energy (KFE) funded by the Government funds, Republic of Korea. This work was also supported by the National Research Foundation of Korea (NRF) grant funded by the Korea government (No. 2020R1C1C1004645).
Author contributions
S Park and W C conceived of the experiments. S Park and J K conducted all experiments. S P have prepared the manuscript and figures, and all authors have participated in the improvement of the paper.
Data availability statement
The data that support the findings of this study are available upon reasonable request from the authors.