

Abstract
Iron oxide films were deposited using high power impulse magnetron sputtering (HiPIMS) of an iron cathode in an argon/oxygen gas mixture at different gas pressures (0.5 Pa, 1.5 Pa, and 5.0 Pa). The HiPIMS system was operated at a repetition frequency f = 100 Hz with a duty cycle of 1%. A main goal is a comparison of film growth during conventional and electron cyclotron wave resonance-assisted HiPIMS. The deposition plasma was investigated by means of optical emission spectroscopy and energy-resolved mass spectrometry. Active oxygen species were detected and their kinetic energy was found to depend on the gas pressure. Deposited films were characterized by means of spectroscopic ellipsometry and grazing incidence x-ray diffraction. Optical properties and crystallinity of as-deposited films were found to depend on the deposition conditions. Deposition of hematite iron oxide films with the HiPIMS–ECWR discharge is attributed to the enhanced production of reactive oxygen species.
Export citation and abstract BibTeX RIS
1. Introduction
Iron oxide is a material with many attractive catalytic, optical, magnetic, and semiconducting properties which are structure-dependent [1–5]. Iron oxide can appear in different chemical compositions and lattice structures, in particular, FeO (wüstite), Fe3O4 (magnetite), γ-Fe2O3 (maghemite), and α-Fe2O3 (hematite). Hematite iron oxide (α-Fe2O3) is considered a top candidate for the photo anode material of photoelectrochemical water splitting devices [6]. The band gap of α-Fe2O3 is about 2.1 eV and thus allows for the absorption of a substantial fraction of the solar spectrum [7, 8]. Maghemite is of particular interest for magnetic recording media. It has a cubic spinel structure and is known to be ferrimagnetic [9, 10]. Maghemite is a metastable phase at ambient conditions which tends to transform into anti-ferromagnetic hematite (α-Fe2O3) when heated up to 450 °C [11].
Plasma-based processing techniques are frequently used for applications in fundamental and applied research [12]. Magnetron sputtering is a technique which is employed for deposition of thin solid films [13–15]. Pulsed magnetron discharge are rather common in reactive magnetron sputtering with non-conductive targets or if target poisoning occurs [16–19]. High power impulse magnetron sputtering (HiPIMS) allows for large plasma densities of more than 1018 m−3 and large ion fluxes to the substrate [19–21]. HiPIMS discharges are typically operated in the pressure regime of 0.3–5 Pa. At these pressures, sputtered atoms and ions undergo several collisions with gas atoms prior to deposition loosing much of their initial kinetic energy. Lower pressures have the advantage that the number of collisions is significantly reduced. To ease operation of HiPIMS discharges at low pressures we employ a combination with an additional electron cyclotron wave resonance (ECWR) discharge allowing for operation pressures as low as 0.05 Pa [22, 23].
In the present paper we investigate the deposition of iron oxide films with the help of an ECWR-assisted high power impulse magnetron discharge (ECWR–HiPIMS). Optical emission spectroscopy (OES) and energy-resolved mass spectrometry was employed for plasma characterization. Deposited films were characterized by means of spectroscopic ellipsometry and grazing incidence x-ray diffraction (GIXRD). Despite the large potential of iron oxide in optical applications and a number of works employing different deposition techniques, e.g. reactive evaporation [24], sol–gel techniques [25, 26], spray pyrolysis [27–29], chemical vapour [30], and pulsed laser deposition [31], the optical constants and other properties of thin iron films have not been fully explored yet.
2. Experiment
The experimental set-up has been described in detail elsewhere [22, 23, 32]. It consists of a cylindrical plasma chamber with a diameter of 38 cm and a length of 48 cm. The chamber is evacuated by a turbo-molecular pump (pumping speed 520 l s−1) to a base pressure of  Pa, measured with the help of a Penning gauge. In addition, a capacitive pressure gauge was employed to measure the gas pressure. The reactive process gas consists of Ar (purity grade 99.999%) and O2 (purity grade 99.998%); it is admitted to the plasma chamber with the help of two mass flow controllers each operated at a gas flow of 5 sccm. The oxygen gas flow was chosen for operation in so-called poisoned mode. It eliminates hysteresis effects which could otherwise arise and ensures a stable plasma operation [33]. The gas pressure inside the chamber is independently controlled with the help of a butterfly valve between pump and chamber together with an adaptive pressure controller.
The deposition plasma is produced by high power impulse magnetron sputtering (HiPIMS) in combination with an inductively coupled electron cyclotron wave resonance (ECWR) discharge with a superimposed static magnetic field [22, 23]. The inductively coupled ECWR discharge is sustained by applying a radiofrequency (RF) power to a single-turn coil (diameter d = 125 mm) made from aluminium [34–36]. The coil is mounted to the bottom flange of the vacuum chamber and located inside the vacuum chamber; it is in direct contact with the generated plasma. A rf generator (Dressler Cesar 136) operated at 13.56 MHz and capable to deliver a power of up to 500 W was employed. The static magnetic field is produced by two Helmholtz coils connected to a direct current source. The magnetic field strength can be varied between 0 and 3 mT inside the source region. The direction of the magnetic field is perpendicular to the symmetry axis of the single-turn coil. Measurements have been performed under resonance conditions with a static magnetic field of typically 1.7 mT [34]. The ECWR discharge was operated with a power P = 300 W delivered to the coil.
A magnetron sputtering source equipped with an iron target (diameter 50 mm, thickness 1.5 mm) was mounted along the axis of the single turn rf-electrode at a distance of 7 cm from the bottom flange. The magnetron plasma was excited by a commercial dc power supply (AE Pinnacle 3000) combined with a home-made power switch [37–40]. A commercial pulse-delay generator (Quantum composers 9518) was employed to set the repetition frequency f = 100 Hz and the pulse width  s and for activation of the power switch and to trigger the time-resolved measurements. Voltage and current waveforms were simultaneously measured using voltage (Tektronix P5100) and current probes and recorded with a digital oscilloscope (Tektronix TDS1012). The magnetron discharge was operated with a mean discharge current of 400 mA.
A substrate holder was accommodated into the vacuum chamber using an axially movable holder positioned 7 cm above the cathode. Iron oxide films were deposited at room temperature on an electrically grounded Si(1 0 0) wafer. Deposition experiments were carried out at pressures of 0.5 Pa, 1.5 Pa, and 5.0 Pa. Typical deposition time was 60 min.
Energy-resolved mass spectrometry was performed by means of an energy-dispersive mass spectrometer or plasma process monitor (PPM 421, Balzers) which was mounted on the upper flange of the plasma chamber. The PPM's entrance orifice was 15 cm above the single-turn electrode of the ECWR discharge [34].
Optical emission spectroscopy (OES) was performed with a Shamrock SR500D spectrometer (focal length 500 mm) equipped with an iCCD detector (iStar DH740I, Andor Technology, Belfast, Northern Ireland). The spectrometer is equipped with three gratings having 300, 1200, and 2400 lines per millimeter. An optical fibre is connected on one end to the spectrometer and inserted on the other end via a vacuum feed-through into the plasma chamber. The optical fibre was installed inside the vacuum chamber parallel to the target surface facing towards the region in front of the plasma process monitor's orifice.
Deposited films were characterized by spectroscopic ellipsometry and by grazing incidence x-ray diffractometry (GIXRD). Spectroscopic ellipsometry (SE) investigations were carried out with a phase modulated ellipsometer (UVISEL, HORIBA Jobin-Yvon, Edison, NJ) in the photon energy range 4.2–1.5 eV (295–826 nm) with energy steps of 0.02 eV. The measurements were carried out an incidence angle of 70° which corresponds to the Brewster angle of the Si(1 0 0) wafer substrate. DeltaPsi software (v. 2.6, HORIBA Jobin-Yvon, Bensheim, Germany) was employed to determine the spectral distribution of the refractive index  and the extinction coefficient
  of the as-deposited iron oxide films. The ellipsometric angles Δ and Ψ were simulated using a two-layer optical model consisting of a deposited iron oxide film and a Si substrate. The optical indices of Si were obtained from a database [41]. The complex dielectric function of iron oxide layer was described by an oscillator model composed of three Tauc-Lorentz oscillators to obtain the dispersion due to interband absorption and a Drude oscillator to include the free electron contribution in the near-infrared range [42]. Finally, the optical model was fitted to the experimental data using a Levenberg–Marquardt non-linear least-squares algorithm. The mean square error (MSE) was utilized to verify the fitting of the applied model to the experimental data [42]. The ellipsometric data analysis allows for an estimation of film thickness and both optical constants with an accuracy of ±0.5 nm and ±0.01, respectively.
The deposited iron oxide films were characterized by grazing incidence x-ray diffractometry (GIXRD) with regard to line position, intensity, and line profile of the observed Bragg reflections. The employed methods have been described elsewhere [43]. GIXRD was performed on a Siemens D 5000 diffractometer equipped with a special parallel beam attachment (parallel beam collimator) for diffractometry investigations. Cu Kα radiation (40 kV, 40 mA) was used. The scanned  range was 20° to 58° at an incidence angle
  . As-deposited and annealed films were investigated. Annealing was carried at in air for 4 h and at an annealing temperature of 400 °C.
3. Results
3.1. Current–voltage characteristics
The measured voltage and current waveforms applied to the magnetron discharge are displayed in figures 1 and 2 for two gas pressure p = 0.5 Pa and p = 5 Pa, respectively. Figure 1(a) shows results for HiPIMS discharge at a gas pressure p = 0.5 Pa. The voltage applied to the magnetron's cathode drops to −650 V within less than 1 μs. The voltage remains at this level for about 7 μs until it shortly returns to −330 V and settles at about −400 V. The voltage drop is determined by the impedance of the power supply and of the plasma [44]. It marks the ignition of the plasma which is accompanied by an pronounced increase of the discharge current to about 52 A. The discharge current then slightly decreases from this maximum value to 43 A at the end of the pulse. The ECWR-assisted HiPIMS discharge ignites significantly faster and without any noticeable delay (figure 1(b)). The faster evolution of the discharge current and, hence, of the plasma density is associated with the pre-ionisation by the ECWR discharge [22, 23]. The ECWR-assisted discharge appears more stable as is indicated by the smaller cathode voltage required to maintain the discharge and the smaller voltage fluctuations.
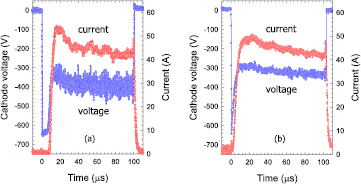
Figure 1. Measured cathode voltage and discharge current as a function of time for (a) a HiPIMS and (b) an ECWR–HiPIMS plasma in an argon/oxygen gas mixture. Gas pressure p = 0.5 Pa.
Download figure:
Standard image High-resolution image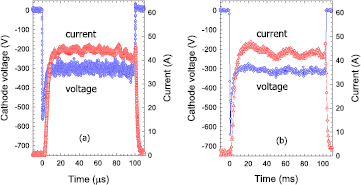
Figure 2. Measured cathode voltage and discharge current as a function of time for (a) a HiPIMS and (b) an ECWR–HiPIMS plasma in an argon/oxygen gas mixture. Gas pressure p = 5 Pa.
Download figure:
Standard image High-resolution imageThe observed drop of the discharge current after reaching the maximum is attributed to a rarefaction of the working gas in the targets vicinity which reduces the number of plasma ions reaching the cathode. This effect is not typical for reactive HiPIMS discharges where frequently a rising discharge current during the pulse is observed [45, 46]. However, a similar behavior, i.e. a falling discharge current, was observed in other experimental arrangements where HiPIMS was combined with other plasma sources [47, 48]. In these cases electron production is enhanced which is believed to be a responsible agent for gas rarefaction. A similar effect is also expected in the present case.
Figure 2 shows results for the HiPIMS and ECWR–HIPIMS discharges at a gas pressure p = 5 Pa. A much faster ignition of the plasma without any delay is observed for the HiPIMS discharge. The ECWR-assisted discharge again appears to be more stable compared to the HiPIMS discharge. Apart from this, the current and voltage characteristics are similar compared to the results at the lower pressure (figure 1).
3.2. Optical emission spectroscopy
Optical emission spectra obtained with the ECWR-assisted HiPIMS discharge in a pure Ar and in an Ar/O2 gas mixture at a gas pressure p = 0.5 Pa are displayed in figure 3. Figure 3(a) shows the spectrum obtained with pure argon gas. The time-averaged spectrum is dominated by Fe (Fe I), Ar (Ar I), and Fe+ (Fe II) lines. Ar I emission lines originating from Ar(4p) → Ar(4s) transitions are observed in the red part of the spectrum, e.g. at  nm, 750.39 nm, 751.37 nm, 763.51 nm, 810.37 nm, and 811.53 nm [49–51]. A series of weaker emission lines occurring at, e.g.
  nm, 419.83 nm, 420.07 nm, 425.94 nm, and 451.07 nm in the blue part of the spectrum resemble Ar(5p) → Ar(4s) transitions [49]. Excitation of Ar(5p) compared to Ar (4p) levels is less likely as a larger energy transfer is required. Two weak oxygen (O I) lines (actually triplets) at 777.19/777.42/777.54 nm and 844.62/844.64/844.68 nm are also observed. The O I lines are assigned to the 3p 5P → 3s 5S transitions of oxygen atoms [52–54].
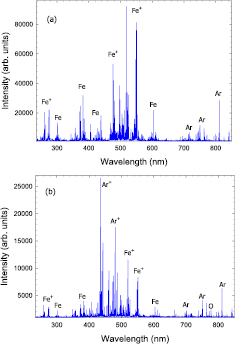
Figure 3. Optical emission spectrum in the wavelength range 235–850 nm obtained with the ECWR–HiPIMS discharge in (a) an Ar and (b) Ar/O2 gas mixture at p = 0.5 Pa.
Download figure:
Standard image High-resolution imageProminent lines from neutral Fe are observed at 302.06/302.10 nm (and again in second order at about 604.2 nm) and in the wavelength region 355–453 nm (e.g. at 357.01 nm, 358.12 nm, 371.99 nm, 373.49/373.71 nm, 374.82 nm, 382.04 nm, 382.44/382.59/382.78 nm, 385.99 nm, 404.58 nm, 406.35 nm, 426.05 nm, 427.18 nm, 430.79 nm, 432.58 nm, 434.81 nm, 438.35 nm, 440.48 nm, and 452.86 nm). Many of these lines originate from transitions between the lowest excited states including the ground states, e.g. Fe(3d64s4p) → Fe(3d64s2) or Fe(3d74p) → Fe(3d74s). The required excitation energies from the ground state are typically in the range of 3–5 eV. Strong Fe II lines which originate from Fe+ (3d64p) → Fe+ (3d64s) transitions appear at  nm, 259.84/259.94 nm, 263.10/263.13 nm, 273.96 nm, 274.65/274.70 nm and 274.91/274.93 nm and again in second order in the wavelength region 517–550 nm which dominates the spectrum.
Figure 3(b) shows the spectrum obtained with the ECWR-assisted HiPIMS discharge in an argon/oxygen gas mixture. The overall intensity is lower in the Ar/O2 gas mixture compared to the pure Ar case (figure 3(a)). As a likely cause we mention quenching of excited states by oxygen molecules [55, 56]. Quenching reactions are state-selective and the quenching rates may dependent on the involved states [55]. As a consequence, the intensity reduction does not equally apply to all transitions (table 1). Moreover, the Ar/O2 spectrum is dominated by optical transitions at  nm and
  nm which are not observed for the sole ECWR discharge. Figure 4 shows the expanded spectra from the ECWR–HiPIMS discharge in pure Ar gas and in the Ar/O2 gas mixture in the wavelength region
  nm. In the pure Ar case, the most prominent line in this range is a Fe I line at
  nm. By contrast, the Ar/O2 spectrum is dominated by an Ar+ ion line at
  nm; this line is also noticeable in the pure Ar spectrum albeit at a
  smaller intensity (table 1). Other lines at
  nm, 433.12/433.20 nm, 437.08/437.13 nm, 437.97/437.99 nm, 440.10 nm, 442.60 nm, 443.02/443.10 nm, 460.96 nm, 480.6 nm, and 487.99 nm are all associated with optical transitions in Ar+ (Ar II) ions [49].
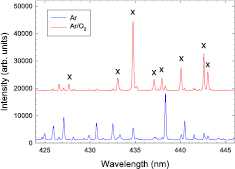
Figure 4. Optical emission spectrum in the wavelength range 424–446 nm obtained with the ECWR–HiPIMS discharge in (a) an Ar and (b) Ar/O2 gas mixture at p = 0.5 Pa. X indicates lines from Ar+ ions. Shifted upwards by +18 000.
Download figure:
Standard image High-resolution imageTable 1. Emission line ratio for the pure Ar compared to the Ar/O2 discharge.
| Ar I | Ar II | Fe I | Fe II | |||||||||
|---|---|---|---|---|---|---|---|---|---|---|---|---|
| Line (nm) | 750.4 | 763.5 | 811.5 | 434.8 | 442.6 | 480.6 | 302.1 | 382.0 | 438.4 | 238.2 |
259.9 |
274.9 |
| ECWR–HiPIMS | 3.4 | 3.3 | 5.3 | 0.20 | 0.27 | 0.67 | 11.9 | 10.8 | 8.0 | 6.3 | 8.8 | 11.3 |
| ECWR | 3.5 | 3.6 | 4.8 | |||||||||
aMeasured in second order, i.e. at twice the nominal wavelength.
The observed lines resemble optical transitions from excited Ar states with typical excitation energies in the 19.22–19.55 eV range with respect to the Ar+ ground state [49]. These lines are much weaker without oxygen and absent in the ECWR discharge without HiPIMS. Obviously, magnetron operation is required to produce the Ar+ lines and the presence of oxygen strongly increases the intensity. Gudmundsson et al employing a reactive ionization region model (R-IRM) have shown that the HiPIMS discharge in so-called poisoned mode is dominated by Ar+ ions of which two third are recycled, i.e. return from the target and become ionised again [21]. It was verified by time-resolved optical emission spectroscopy during Ni sputtering in an Ar/O2 HiPIMS discharge [57]. Ion energy distribution measurements (see below) indicate that positively charged oxygen ions with kinetic energies up to about 200 eV are produced during the sputtering process. Even larger energies are expected for negatively charged O− ions [48, 58, 59]. We thus believe that collisions of energetic oxygen ions with Ar+ ions are responsible for the observed Ar II lines.
3.3. Energy-resolved mass spectrometry
Ion energy distribution functions (IEDF) of plasma ions was investigated by means of energy-resolved mass spectrometry. Ar+ , Fe+ , and Fe++ ions were abundantly detected. Figure 5 displays energy distributions of Ar+ ions measured in argon at gas pressures of p = 0.05 Pa, 0.5 Pa, and 5.0 Pa. In order to avoid a saturation of the ion count rate, the Ar-36 isotope with a relative abundance of 0.337% compared to the 99.6% of the main Ar-40 isotope was selected [60]. The measured IEDF display pronounced dependencies on gas pressure. In particular, the peak position strongly decreases with increasing gas pressure, as was observed before [34]. It reflects a variation of the plasma parameters and, in particular, of the plasma potential in front of the mass spectrometer.

Figure 5. Ion energy distribution of Ar+ ions (m/z = 36) during ECWR–HiPIMS discharge in Ar at gas pressures of p = 0.05 Pa, 0.5 Pa, and 5.0 Pa.
Download figure:
Standard image High-resolution imageIon energy distributions of Fe+ ions are displayed in figure 6(a). The observed IEDFs display a pronounced peak at small kinetic energies and, at the smaller gas pressures p = 0.05 Pa and 0.5 Pa, an energy tail which extends beyond 100 eV; the high-energy tail is absent at p = 5.0 Pa. The low energy peak maximises at kinetic energies of about 25 eV, 19 eV, and 14 eV for p = 0.05 Pa, 0.5 Pa, and 5.0 Pa, respectively, which is close to the peak position of Ar+ ions (figure 5). The pronounced low-energy peak of the Fe+ energy distribution thus resembles fully thermalised ions whose kinetic energy is determined by the plasma potential in front of the mass spectrometer. Fe+ ions are produced by sputtering of Fe atoms from the cathode's material and the subsequent ionisation in the plasma region. The high-energy component thus consists of ions which are not fully thermalised yet and still owe a significant fraction of their initial kinetic energy received during the sputtering process [61, 62].

Figure 6. Ion energy distribution of (a) Fe+ and (b) Fe++ ions during ECWR–HiPIMS discharge in Ar at different gas pressures p = 0.05 Pa, 0.5 Pa, and 5.0 Pa.
Download figure:
Standard image High-resolution imageIon energy distributions of Fe++ ions are displayed in figures 6(b). The measured IEDFs display a peak at small kinetic energies and, at the lower gas pressures p = 0.05 Pa and 0.5 Pa, an energy tail which extends beyond 200 eV; as before in the case of Fe+ ions, the high-energy tail is absent at p = 5.0 Pa. The low energy peak maximises at kinetic energies of about 48 eV, 39 eV, and 28 eV for p = 0.05 Pa, 0.5 Pa, and 5.0 Pa, respectively, which is approximately twice as large as the peak energy of Fe+ ions. The observation supports our interpretation that the low-energy peak is due to thermalised ions whose kinetic energy is determined by the plasma potential near the entrance of the mass spectrometer [63]. Charge states of Fe+ and Fe++ ions differ by a factor of 2 and the same will hold for the energy of the low-energy peak. Somewhat surprising, the high-energy tail of Fe++ ions extends much farther compared to Fe+ ions. Presumably, Fe+ and Fe++ ions are formed in the electron trap region were both electron density and the mean electron energy are large. The energetic ions travelled a long way without collisions and thus still owe much of their initial energy received during the sputtering event. In addition, their energy is influenced by the larger plasma potential in the electron trap region contributing a twice as large amount to the kinetic energy of Fe++ compared to Fe+ ions.
Ion energy distributions of O+ and O ions are displayed in figures 7. The measured IEDFs for O+ and O
 ions are significantly different. O
 ions display a rather narrow low-energy distribution which does not extend beyond 30 eV even at the lowest gas pressure. O+ ions additionally display a pronounced high-energy component which extends up to more than 200 eV. The results for O+ resemble those of Fe+ ions and thus suggest that the high-energy component is due to sputtering of oxygen atoms which became absorbed on the magnetron's cathode. Cathode contamination during magnetron sputtering in a reactive atmosphere, e.g. in the presence of O2, N2, or other reactive species, is a well known phenomena which can lead to so-called cathode poisoning [12, 64].
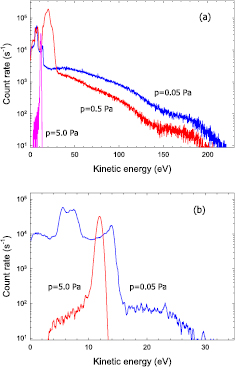
Figure 7. Ion energy distribution of (a) O+ and (b) O ions during ECWR–HiPIMS discharge in an Ar/O2 gas mixture at different gas pressures p = 0.05 Pa, 0.5 Pa, and 5.0 Pa.
Download figure:
Standard image High-resolution imageThe mean kinetic energy  is obtained by averaging the measured ion intensities I(Ei) weighted by the kinetic energy Ei. For the ECWR–HiPIMS discharge in pure Ar, the mean energy
  of Ar+ ions decreases from 25.2 eV at p = 0.05 Pa to about 12.5 eV at p = 5.0 Pa (figure 8). For the Ar/O2 plasma, the small
  eV of O
 and Ar+ ions at p = 0.05 Pa may indicate that the inductive H-mode of the ECWR discharge had not fully developed yet under these conditions. Mean kinetic energies of all investigated ions approach the same
  value at large pressure due to thermalisation.
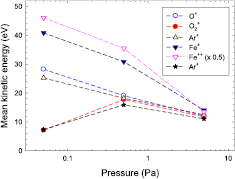
Figure 8. Mean kinetic energy versus gas pressure for an ECWR–HiPIMS discharge in Ar and Ar/O2 gas mixtures. Ar: Ar+ ( ), Fe+ (
 ), Fe++ (
 ,
,  ); Ar/O2: O+ (◦), O
 (•), Ar+ (*).
Download figure:
Standard image High-resolution imageIon energy distributions of O+ , O , Ar+ , and Fe+ ions during HiPIMS and ECWR–HiPIMS discharges in an Ar/O2 gas mixture display significant differences when compared to each other (figure 9). Energy distributions of O+ and O
 ions at a gas pressure p = 0.5 Pa extend to larger kinetic energies and the intensities are significantly enhanced in the ECWR–HiPIMS discharge. In both discharge modes, the energy distribution of O
 ions is close to that of Ar+ ions (figure 9). Intensities of O+ , O
 , Ar+ , and Fe+ ions all peak at considerably larger kinetic energies of ≈17 eV during the ECWR–HiPIMS compared to the HiPIMS discharge. The difference reflects the much larger plasma potential which is characteristic of the ECWR discharge [34]. The clearly visible high-energy component extending beyond 100 eV and 200 eV for O+ and Fe+ ions, respectively, reminds of sputtering processes. Similar results and conclusions were reported by Ferrec et al [63] for Cr+ and by Britun et al [65] for O+ and Ti+ ions of a HiPIMS discharge with a respective metal cathode.

Figure 9. Comparison of ion energy distributions of (a) O+ , (b) O and Ar+ , and (c) Fe+ ions during HiPIMS and ECWR–HiPIMS discharges in an Ar/O2 gas mixture. Gas pressure p = 0.5 Pa.
Download figure:
Standard image High-resolution imageMean kinetic energies  for the two discharge modes in an Ar/O2 gas mixture resembling the observed differences are summarized in table 2. The ECWR–HiPIMS discharge significantly enhances the mean kinetic energy of O+ , O
 and Ar+ ions. The mean kinetic energy of Fe+ ions is reduced by the ECWR-HiPIMs mode. The reduction is explained by a preferred ionisation of slower species which have a larger residence time inside the plasma. Nevertheless, for all ion energies the intensity of Fe+ ions and, hence, also the energy influx due to impinging ions into the growing film is larger in the ECWR–HiPIMS compared to the HiPIMS mode (figure 9(c)).
Table 2. Mean kinetic energy  (see text) of O+ , O
 , Ar+ , and Fe+ ions for the HiPIMS and the ECWR–HiPIMS discharge in an Ar/O2 gas mixture. Gas pressure p = 0.5 Pa.
| HiPIMS | ECWR–HiPIMS | |
|---|---|---|
| O+ | 11.5 | 19.1 |
O |
1.6 | 17.8 |
| Ar+ | 1.8 | 16.8 |
| Fe+ | 59.5 | 26.3 |
3.4. Film diagnostics
3.4.1. Grazing incidence x-ray diffraction (GIXRD).
X-ray diffraction pattern of iron oxide films deposited by HiPIMS and ECWR–HiPIMS at gas pressures p = 0.5 Pa, 1.5 Pa, and 5.0 Pa are displayed in figures 10 and 11. X-ray data are influenced by lattice defects. For example, imperfections such as point defects and dislocations influence the diffraction line shape [43, 66]. The x-ray pattern of as-deposited films show broad profiles and a low peak-to-background ratio (figure 10). It means that the films are of low crystallinity and have a large defect concentration. Distinct differences between the films deposited by HiPIMS and ECWR–HiPIMS are observed (figure 10). The GIXRD pattern of as-deposited HiPIMS films display three pronounced peaks at 30 , 32.5
 , and 42.5
 . Small peaks labelled L are Laue artifact peaks from the silicon substrate. Laue peaks are frequently observed in grazing incidence configurations [67]. By contrast, the as-deposited ECWR–HiPIMS films are dominated by two broad peaks at 33
 and 54
 .
.
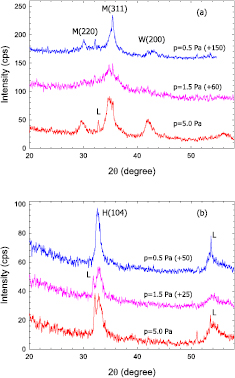
Figure 10. GIXRD pattern of as-deposited iron oxide films deposited by (a) HiPIMS and (b) ECWR–HiPIMS at p = 0.5 Pa, 1.5 Pa, and 5.0 Pa. To ease comparison, curves have been shifted upwards as indicated.
Download figure:
Standard image High-resolution image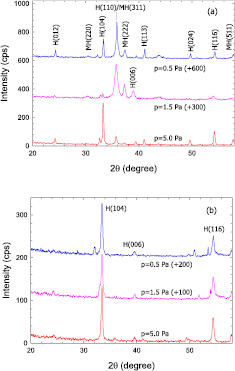
Figure 11. X-ray diffraction pattern of annealed FeOx films deposited by (a) HiPIMS and (b) ECWR–HiPIMS at p = 0.5 Pa, 1.5 Pa, and 5.0 Pa. To ease comparison, curves have been shifted upwards as indicated.
Download figure:
Standard image High-resolution imageGIXRD pattern of annealed iron oxide films are displayed in figure 11. The annealed films are characterized by several narrow peaks. Although the same annealing procedure was applied to the films deposited by HiPIMS and ECWR–HiPIMS a different x-ray pattern was obtained. The ECWR–HiPIMS films only show three peaks from the hematite phase while the x-ray pattern of HiPIMS films displays additional peaks.
3.4.2. Ellipsometry.
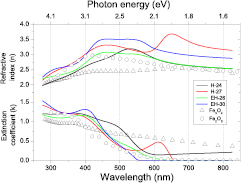
The spectral dependency of the optical constants of as-deposited thin iron oxide films are given in table 3 and displayed in figure 12. The extracted optical constants and the film thickness depend on the deposition conditions (HiPIMS, ECWR–HIPIMS) and on the gas pressure during deposition. The derived film thickness for a typical deposition time of 45–60 min is in the range of 34–60 nm. The refractive index of as-deposited iron oxide samples is the range  in the investigated wavelength region. Strong absorption by the deposited samples is observed; the extinction coefficient
  reaches values larger than 1 at short wavelengths with an absorption edge at
  nm. Characteristic values for the optical constants at
  nm are summarized in table 3.
Figure 12. Refractive index and extinction coefficient of as-deposited thin iron oxide films deposited by HiPIMS (H-24, H-27) and ECWR–HiPIMS (EH-26, EH-30) at p = 0.5 Pa (H-24, EH-26) and p = 5.0 Pa (H-27, EH-30). ◦ Fe3O4 [41],  α-Fe2O3 [41].
Download figure:
Standard image High-resolution image
Table 3. Optical properties of as-deposited FexOy thin films deposited by HiPIMS (H-24, H-27) and ECWR–HiPIMS (EH-26, EH-30) at gas pressures p = 0.5 Pa (H-24, EH-26) and p = 5.0 Pa (H-27, EH-30).
| Direct | Indirect | Refractive index | Extinction coefficient | Absorption coefficient | ||
|---|---|---|---|---|---|---|
| Sample | d (nm) | Band gap (eV) | @ 550 nm | |||
| H-24 | 60.3 | 2.26 | 1.92 | 3.13 | 0.34 | 0.0039 |
| H-27 | 34.1 | 2.67 | 2.01 | 3.10 | 0.26 | 0.0029 |
| EH-26 | 38.4 | 2.62 | 1.91 | 3.00 | 0.22 | 0.0025 |
| EH-30 | 42.7 | 2.65 | 2.08 | 3.47 | 0.01 | 0.0001 |
The band gap energy Eg is obtained with the help of a so-called Tauc plot, i.e.  versus photon energy E, where α is the absorption coefficient and the exponent n = 2 and n = 0.5 for a direct and an indirect band gap, respectively [68]. The fitted linear range of the curves is used for an estimation of Eg. Both direct and indirect band gaps were determined and are displayed in table 3. The direct band gap lies in the range
  eV and shows some variation as a function of deposition mode and pressure while the deduced indirect band gap ranges between 1.9 eV and 2.1 eV.
4. Discussion
Iron oxide can appear in different chemical compositions and lattice structures, in particular, wüstite (FeO), magnetite (Fe3O4), maghemite (γ-Fe2O3), and hematite (α-Fe2O3). α-Fe2O3 has a rhombohedrally centered hexagonal crystal structure of the corundum type (space group R3c) [69]. Wüstite, magnetite, and maghemite are closely related to each other approximately forming a face-centered cubic structure of oxygen atoms. There exists a pronounced tendency of the latter three iron oxides to form non-stoichiometric compounds FexO, where x = 1, 0.75, and 0.667 for stoichiometric FeO, Fe3O4, and γ-Fe2O3, respectively [70]. For example, non-stoichiometric Fe0.95O is a rather common form of wüstite iron oxide; it resembles an intermediate state between FeO and Fe2O3 in which 10% of the Fe2+ ions (FeII) are replaced by Fe3+ ions (FeIII), ie., FeII0.85FeIII0.10O. The magnetite phase Fe3O4 corresponds to Fe0.75O which is equivalent to FeII0.25FeIII0.50O while γ-Fe2O3 correlates with FeIII0.667O. Both, magnetite (M) and maghemite (MH) form in the spinel structure type (SG: F d -3 m, Nr. 227). Due to the higher iron content and a large fraction of Fe2+ ions the unit cell parameter a0 of the magnetite phase is larger than of the maghemite phase.
The measured GIXRD pattern have been analysed with respect to peak position, intensity, and profile (width) which are related to lattice parameter, phase ratio, and mean particle size, respectively. The results are summarized in table 4. It is immediately noted that HiPIMS and ECWR–HiPIMS deposit different iron oxide films.
Table 4. Properties (crystal phase, lattice constant, particle size) of as-deposited and annealed thin iron oxide films deposited by HiPIMS (H-24, H-25, H-27) and ECWR–HiPIMS (EH-26, EH-29, EH-30) at gas pressures p = 0.5 Pa (H-24, EH-26), p = 1.5 Pa (H-25, EH-29), and p = 5.0 Pa (H-27, EH-30).
| As-deposited | Annealed | ||||||||
|---|---|---|---|---|---|---|---|---|---|
| Sample | Crystal phase (%) | Lattice constant | Size (nm) | Crystal phase (%) | Lattice constant | Size (nm) | |||
| a0 (nm) | c0 (nm) | a0 (nm) | c0 (nm) | ||||||
| HiPIMS | H-24 | W (33) | 0.429 | — | 4 | MH (47) | 0.831 | — | 18 |
| M (67) | 0.849 | — | 4 | H (53) | 0.500 | 1.372 | 27 | ||
| H-25 | W (15) | 0.429 | — | n/a | MH (80) | 0.834 | — | 15 | |
| M (85) | 0.849 | — | 3 | H (20) | 0.499 | 1.387 | 12 | ||
| H-27 | W (15) | 0.422 | — | n/a | MH (23) | 0.832 | — | 30 | |
| M (85) | 0.839 | — | 3 | H (77) | 0.503 | 1.369 | 28 | ||
| ECWR–HiPIMS | EH-26 | H (1 0 0) | 0.506 | 1.387 | 5 | H (1 0 0) | 0.500 | 1.367 | 20 |
| EH-29 | H (1 0 0) | 0.500 | 1.387 | 5 | H (1 0 0) | 0.501 | 1.367 | 19 | |
| EH-30 | H (1 0 0) | 0.509 | 1.387 | 6 | H (1 0 0) | 0.502 | 1.368 | 13 | |
W: wüstite (FeO), M: magnetite (Fe3O4), MH: maghemite (γ-Fe2O3), H: hematite (α-Fe2O3). n/a: not analysable.
As-deposited HiPIMS films (H-24, H-25, H-27) consist of a mixture of wüstite and magnetite iron oxide phases. The observed peaks are rather broad indicating low crystallinity of the as-deposited films. Therefore, lattice parameters, mean particle sizes, and phase rations are only estimates. The broad reflections of the wüstite phase are typical for a non-stoichiometric composition Fe0.95O with a 10% admixture of FeIII.
Upon annealing, the HiPIMS films convert to maghemite (γ-Fe2O3) and hematite (α-Fe2O3) phases with larger crystal sizes. γ-Fe2O3 is a transition phase between Fe3O4 and α-Fe2O3 [71]; it easily transforms into α-Fe2O3 above 400 °C [72]. Films deposited at 0.5 Pa and 5.0 Pa show a hematite-to-maghemite phase ratio >1. However, the hematite-to-maghemite phase ratio of the film deposited at 1.5 Pa is 0.25 only. This hematite phase exhibits a preferred (006) orientation and a distinctly larger c0 lattice parameter. No explanation for this behaviour has been found yet.
As-deposited ECWR–HiPIMS films are composed of small crystallite of 5–6 nm in a hematite phase composed of Fe(III). Upon annealing, the ECWR–HiPIMS films remain in the hematite crystal structure attaining larger nano-crystal sizes of 13–20 nm. The observed shrinking of the hematite unit cell after annealing is due to the well known Oswald ripening, and demonstrates the degradation of lattice defects. Similar phase transitions in iron oxide have been reported before [26, 71].
A comparison of the extracted optical constants with tabulated data [41] indicates that the as-deposited films have a complex structure presumably composed of several iron oxide phases. Extracted refractive indices at  nm are in the range
  (figure 12). Reported optical constants of iron oxide films differ widely and show a strong dependence on the deposition conditions. For example, refractive indices of 2.85–3.15 at 550 nm were reported for sprayed iron oxide films deposited at substrate temperatures of 350 °C and 500 °C [73]. Significantly smaller values of
  were observed after chemical bath deposition [74]. Rather small values of n = 2.03 and k = 0.02 were reported for Fe2O3 films prepared by chemical vapor deposition [75]. RF sputtering yields a refractive index n = 2.6 and a small extinction coefficient k = 0.5 which was attributed to the weak crystallinity level of the deposited film [76]. The extinction coefficient of magnetite and hematite iron oxide films differ significantly above
  nm. In this range, films deposited by ECWR–HiPIMS display rather small extinction coefficients which are typical for hematite (α-Fe2O3) films [41, 77] thus confirming the GIXRD results. By contrast, the H-24 sample deposited by HiPIMS exhibits a pronounced k tail in the 600–800 nm wavelength range which is typical for the magnetite (Fe3O4) phase [41].
Direct and indirect band gaps derived from the present measurements are in the range Eg = 2.26–2.67 eV and 1.91–2.08 eV, respectively. Iron oxide thin films prepared by spray pyrolysis of FeCl3 salt show similar direct and indirect band gaps of 2.54 eV and 1.86 eV, respectively [28]. Chemical bath deposition in dependence on the reaction time yields direct band gaps of 2.57–2.67 eV [74]. Hematite iron oxide films deposited by reactive evaporation of iron in an oxygen atmosphere show direct and indirect band gaps of 2.18 eV and 1.82–1.96 eV, respectively, depending on the substrate temperature [24]. The influence of film thickness and substrate temperature on the determined energy gaps was investigated for iron oxide films deposited by spray pyrolysis [78]. Non-crystalline thin iron oxide films of different thicknesses (76–118 nm) deposited at substrate temperatures of 350–450 °C had direct and indirect transition band gaps of 1.94 eV and 1.52 eV, respectively. Crystalline films of larger thicknesses (472–634 nm) displayed band gaps ranging from 1.95 eV to 2.13 eV for direct transitions and from 1.71 eV to 1.88 eV for indirect transitions [78].
The present results demonstrate that the crystal structure of as-deposited and even of annealed thin iron oxide films strongly depends on the deposition method (table 4). The HiPIMS discharge produces a mixture of wüstite and magnetite iron oxide films which partly convert into the maghemite and the hematite phase upon annealing at 400  C. As-deposited films obtained with the HiPiMS-ECWR discharge are in the hematite phase and remain in this phase during annealing. Wüstite (FeO) and magnetite (Fe3O4) films have oxygen-to-iron ratios of 1 and 1.33, respectively, which is smaller than the ratio of 1.5 of maghemite (γ-Fe2O3) and hematite (α-Fe2O3) films. Obviously, the ECWR–HiPIMS discharge enhances oxygen incorporation into the as-deposited iron oxide films. The larger oxygen incorporation should be promoted by a larger dissociation degree and the larger kinetic energies of O+ and O
 ions (figure 9) which are characteristic of an ECWR–HiPIMS discharge. Highly reactive negatively charged oxygen ions like (O−, O
 ) could also play a role here [48, 58, 59].
Other parameters of the deposition process do not appear that important. For example, the kinetic energy of impinging ions during the deposition process may significantly influence film properties. Measured energy distribution measurements show a pronounced ion energy decrease with increasing gas pressure. It leads to a rather moderate modification of the crystal phase during HiPIMS and a slightly more dense lattice as the lattice parameter decreases. No changes are observed during ECWR–HIPIMS.
5. Conclusions
Iron oxide films were deposited with the help of high power impulse magnetron sputtering in an argon/oxygen gas mixture at different gas pressures (0.5 Pa, 1.5 Pa, and 5.0 Pa). The deposition plasma was characterized by optical emission spectroscopy and energy-resolved mass spectrometry. Optical emission spectroscopy reveals the presence of strong Fe I and Fe II from excited Fe atoms and ions, respectively. Weak O I lines are detected with the addition of O2 to the plasma. The addition of O2 to the ECWR–HiPIMS discharge enhances the production of excited Ar+ ions as is corroborated by the occurrence of Ar II lines. It is suggested that fast oxygen ions originating from the sputter target cause this enhancement. Plasma ions originating from the sputter target have large kinetic energies. The kinetic energy of plasma ions decreases with increasing gas pressure due to thermalising collisions. As-deposited films using the HiPIMS discharge are composed of FeO and Fe3O4. Upon annealing, the HiPIMS-films convert to a mixture of γ-Fe2O3 and α-Fe2O3. Films deposited with the help of the ECWR–HiPIMS discharge are composed of α-Fe2O3. Ellipsometric measurements support these results. The differences are explained by a larger density of reactive oxygen species in the ECWR–HiPIMS discharge.
The present results indicate that efficient oxidation is an important phenomenon which influences formation and growth of iron oxide films. Our results indicate that the HiPIMS discharge lacks a sufficient amount of reactive oxygen species which results in the formation of iron oxide films with a lower oxygen-to-iron ratio (FeO, Fe3O4). The ECWR–HiPIMS discharge apparently provides a sufficient amount of reactive oxygen species resulting in fully oxidised hematite α-Fe2O3 iron oxide films without the need for an additional substrate heating.
Acknowledgments
The work was partly supported by the Deutsche Forschungsgemeinschaft through SFB/TR 24, by projects 17-08389S and 16-14024S of the Czech Science Foundation, by NATO research grant SPS G5147, and by the German Academic Exchange Service (DAAD). DS funds of the Faculty of Electronics, Telecommunications and Informatics of the Gdansk University of Technology are also acknowledged.