

Abstract
The tetragonal crystalline structure and magnetic properties of MgO/Rh/(Fe1−xCox)0.9V0.1 and MgO/Rh/(Fe1−xCox)0.9V0.05C0.05 films (0.4  x
x  0.7, thickness t = 2–50 nm) were studied. For both the systems, the films with t = 5 nm showed a tetragonal distortion (c/a) of ~1.15 at x = 0.6. Furthermore, in the case of (Fe1−xCox)0.9V0.05C0.05, the films showed a c/a value of ~1.06 even at t = 50 nm. The magnetic anisotropy induced by the tetragonal distortion of films became 1.4 × 10⁷ erg cm−3 for (Fe1−xCox)0.9V0.1 (t = 5 nm) and (Fe1−xCox)0.9V0.05C0.05 (t = 5 nm) films. We also investigated the tetragonal distortion stability of the films using their enthalpy of formation (ΔH) values obtained from density functional theory calculations.
Export citation and abstract BibTeX RIS
1. Introduction
FeCo alloys are known for their high saturation magnetization (Ms) and Curie temperature (Tc), and are widely used in soft magnetic materials. Recent first-principles band calculations have however shown that tetragonally distorted FeCo alloys possess a large uniaxial magnetocrystalline anisotropy energy (MAE) [1–4] and thus, suggest a possibility of using them in hard magnets like permanent magnets or semi-hard magnetic materials. Typical applications are motors, actuators and flux sources in bulk form, and high-density magnetic recording media and spintronic devices in thin film form [5–7]. The value of MAE for disordered FeCo alloys with an axial ratio (c/a) ranging from 1.2 to 1.25 has been calculated to be about 2 × 10⁷ erg cm−3, while that for the alloys with a B2-type ordered state (order parameter S = 1.0) reaches up to 5–10 × 107 erg cm−3 [2]. Tetragonally distorted FeCo alloys with their high MAE, Ms, and Tc are therefore quite attractive from the practical applications.
Various studies have been carried out to investigate the magnetic anisotropy of tetragonal FeCo using epitaxial films with specific buffer layers like the (0 0 1) surfaces of Rh, Pd, Ir, Pt, and CuAu [8–15] on single crystal substrates because a proper misfit between the buffer and the film results in tetragonal distortion. These studies have revealed that the magnetic anisotropy constant (Ku) exceeds 1 × 10⁷ erg cm−3 when the tetragonal distortion c/a of FeCo is around 1.2 [12]. This is in consistence with the theoretical predictions for disordered alloys. Unfortunately, in epitaxial films, a structural relaxation occurs with an increase in the film thickness. Moreover, tetragonal FeCo with c/a = 1.2 shows uniaxial magnetic anisotropy only in the case of very thin films having a thickness of 1–2 nm [8–12].
Face centered cubic (fcc) FeCo is stable at temperatures higher than ~985 °C. It transforms to the body centered cubic (bcc) phase at temperatures lower than ~985 °C and to the B2 ordered phase at temperatures lower than 730 °C. Body centered tetragonal (bct) FeCo does not exist as an equilibrium phase. However according to Bain's structural relation, it is an intermediate structure between the fcc and bcc phases [16, 17]. One way to stabilize such tetragonal distortion is to apply uniaxial stress to FeCo (as applied in epitaxial processes). Another approach is the addition of third elements to FeCo. These elements generate macroscopic tetragonal distortion in FeCo to relax the local stress around them. C and N are widely used interstitial elements for the formation of tetragonal Fe-based alloys. Fe16N2 is a tetragonal compound with c/a = ~1.1 and Ku = 0.45 × 10⁷ erg cm−3 [18]. Takahashi et al studied the formability of tetragonal (Fe1−yCoy) − (B,C,N) (y  0.3) using FeCo films (300 nm thick) sputtered on MgO substrates [18, 19]. They found that the Fe-rich alloys showed a tetragonal structure, which became unstable with an increase in the Co content. Reichel et al [13, 14] fabricated FeCo–C and FeCo–B films with thicknesses up to 100 nm on a AuCu buffer layer by pulse laser heating and found that the (Fe0.4Co0.6)0.98C0.02 films (100 nm thick, c/a = 1.03) showed a magnetic anisotropy Ku ~ 0.44 × 10⁷ erg cm−3. Matsuura et al studied the effect of the addition of a mixture of Ti and N to FeCo [20], and found that the resulting FeCo–TiN film (23.5 nm thick, c/a = 1.08) showed a Ku of ~0.57 × 10⁷ erg cm−3. However, for practical applications like the manufacture of hard magnets or semi-hard magnetic materials, it is imperative to develop an optimum fabrication process and/or to select appropriate additives for stabilizing the intermediate bct structure. Vanadium is an attractive additive for FeCo. This is because it forms a bcc solid solution around Fe0.5Co0.5 and changes its structure to fcc with an increase in the temperature and Co and V contents [21]. Furthermore, FeCoV alloys containing 8–20 at% V are semi-hard magnetic alloys [22–24]. In this paper, the effect of the addition of V and C to epitaxial FeCo alloys on their tetragonal deformation and magnetic properties was investigated.
2. Experimental procedure
The (Fe1−xCox)0.9V0.1 and (Fe1−xCox)0.9V0.05C0.05 films (0.4  x
x  0.7) used in this study were prepared by dc-magnetron sputtering at a base pressure of 10−7 Pa using 0.1 Pa argon as the sputtering gas. A 20.0 nm thick Rh buffer layer was first grown on a single-crystalline MgO(1 0 0) substrate at 573 K. The temperature was decreased to 473 K to prepare the (Fe1−xCox)0.9V0.1 and (Fe1−xCox)0.9V0.05C0.05 alloy films (with a thickness (t) of 5–50 nm). Finally, a SiO2 capping layer (5 nm thick) was sputtered onto the films at room temperature. The composition of the FeCoV and FeCoVC alloy films so produced was determined by electron probe x-ray microanalysis with an error less than 1% by averaging the compositions of 10 points on the films. The crystalline structure of the films was investigated using a conventional out-of-plane x-ray diffractometer (XRD) with a Bragg–Brentano geometry and an in-plane XRD with an in-plane scattering vector. Cu-Kα radiation was used for the XRD measurements. The surface morphology of the films was observed by atomic force microscopy. The surface roughness (Ra) was less than 0.2 nm for all the films and no island-structure, which is formed by the atomic rearrangement of films, was observed.
Magnetization curves were obtained using a vibrating sample magnetometer. The magnetic anisotropy constants Ku1 and Ku2 of the films was determined by fitting the magnetization curves along the hard axis. Fitting was done by assuming a coherent rotation of magnetization. The magnetization along the magnetic field (H) direction was determined by minimizing the free energy (E), which is given by equation (1).

where Ms is the saturation magnetization, Ku1 and Ku2 are the 1st and 2nd magnetocrystalline anisotropy constants, and θ and ϕ are the direction cosines of the magnetization and magnetic field with respect to the perpendicular to the film plane, respectively. The sign of Ku1 was assumed to be positive when its easy direction was perpendicular to the film plane. The term 2π is appended to take into account the shape magnetic anisotropy of the films. The easy axis of magnetization of whole films was perpendicular to the films in the case of Ku1 − 2π
 > 0, while it lies in the plane in the case of Ku1 − 2π
 < 0.
< 0.
The formation enthalpy of the films was calculated by density functional theory (DFT) calculations by using the Advance/PHASE code (Advance Soft Corp., Japan). For the DFT calculations, we adopted the generalized gradient approximation approach in the DFT with the Perdew-Burke-Ernzerhof formula as the exchange-correlation energy functional. The cut-off energy for the wave function was 35.0 Ry (~480 eV) and that for the charge distribution was 295.0 Ry (~4000 eV). For structural optimization, all the atoms were relaxed until all the atomic forces were less than 4 × 10⁻³ Hartree/Bohr, and the cell volume was also optimized by a stress-free condition (less than 2 × 10⁻⁴ Hartree/Bohr2).
3. Experimental results
Figures 1(a) and (b) show the out-of-plane and in-plane XRD patterns of the (Fe1−xCox)0.9V0.1 and (Fe1−xCox)0.9V0.05C0.05 alloy films (0.5  x
x  0.7, t = 5 nm), respectively. The arrows and dashed lines in the figures represent the peak positions and background levels, respectively. The films grew epitaxially on a Rh (0 0 1) buffer [12], and hence the [0 0 1] FeCo(V) direction grew perpendicular to the film plane. The FeCo(V) [1 0 0] axis was parallel to the [1 1 0] axes of the Rh buffer and MgO substrate. According to the equilibrium phase diagram of FeCoV [21], the alloys used in this study can be located near the phase boundary of bcc FeCoV, Co-rich fcc FeCo-based alloys, and fcc Co3V-based alloys. The lattice constant (a) for the bcc FeCo(V) phases (bcc FeCo [25], B2 FeCo [26], bcc Fe0.46Co0.45V0.09 [27]) was found to be in the range of 0.284–0.286 nm, while that for the fcc FeCo(V) phases (fcc Fe0.1Co0.9 [28], fcc Fe0.46Co0.45V0.09 [27], and fcc Co3V alloys [29]) was within the range of 0.355–0.357 nm. The expected (0 0 2) diffraction angles for fcc and bcc FeCo(V) alloys are shown by vertical lines in figure 1. The (0 0 2) and (2 2 0) diffraction angles for fcc Rh [30] are also shown in the figures. The out-of-plane diffraction angles of the films produced in this study ranged from 56° to 62°, indicating that the films had a structure intermediate between bcc and fcc (figure 1(a)). The in-plane diffraction pattern (figure 1(b)) showed peaks at around 67°. The in-plane XRD diffraction intensities for x = 0.7 were very weak. However, it is recognizable at around 67° by comparing the XRD intensities of the films and the background.
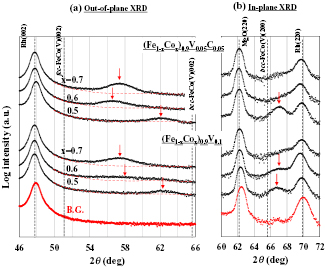
Figure 1. Out-of-plane (a) and in-plane (b) XRD patterns for the (Fe1−xCox)0.9V0.1 and (Fe1−xCox)0.9V0.05C0.05 films. The thickness of the films was 5 nm. Red arrows and dotted lines represent the diffraction angle and back ground level, respectively.
Download figure:
Standard image High-resolution imageThe lattice constants a and c were calculated from the XRD patterns and are shown in figures 2(a) and (b). The c-values were found to be in the range of 0.29–0.32 nm. These values are intermediate between those of the bcc and fcc FeCo(V) phases. The a-value of the films calculated from the in-plane XRD was about 0.28 nm, which is intermediate between the a-values of the bcc FeCo(V) and aRh/√2 phases. The a-values of the films were a little lower than those of bcc FeCo(V) alloys, while the c-values were higher than those of bcc FeCo(V) alloys. Hence, it can be stated that the films produced in this study exhibited tetragonal distortion.
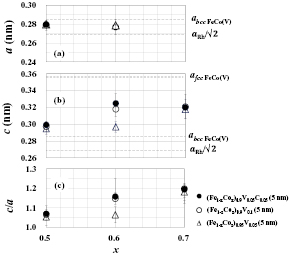
Figure 2. Lattice constants a and c and c/a ratio as a function of the Co composition (x) in the (Fe1−xCox)0.9V0.1 (○), (Fe1−xCox)0.95V0.05(Δ), and (Fe1−xCox)0.9V0.05C0.05(●) films. The thickness of the films was 5 nm.
Download figure:
Standard image High-resolution imageThe c/a ratio (figure 2(c) increased from about 1.05 at x = 0.5 to about 1.15 at x = 0.6 for the films of both the alloys. The c/a ratio at x = 0.7 was calculated by assuming their cell volumes (=a2c) to be the same as that at x = 0.6. This is because the in-plane XRD diffraction intensities at x = 0.7 were very weak. The c/a ratio reached 1.2 at x = 0.6–0.7 for the (Fe100−xCox)0.9V0.1 and (Fe100−xCox)0.9V0.05C0.05 films with a thickness of 5 nm. The diffraction peaks characteristic of vanadium–carbon compounds (such as VC) were not observed.
Figure 3 shows the out-of-plane (a) and in-plane (b) XRD patterns of the (Fe0.4Co0.6)0.9V0.1 and (Fe0.4Co0.6)0.9V0.05C0.05 films with various thicknesses (t nm). The dashed lines and red arrows indicate the background levels and diffraction peak positions, respectively. From figure 3(a), it can be seen that the diffraction peak for the (Fe0.4Co0.6)0.9V0.1 film with t = 2 nm was located at ~56°. The peak position moved to higher angles as the thickness of the film increased and became close to that of the bcc (or B2) bulk FeCo(V) (0 0 2) peak at 50 nm. The in-plane diffraction patterns of the films are shown in figure 3(b). The diffraction angles for both the alloy films with a thickness of 50 nm were very close to that for bcc-FeCo(V) (2 0 0). With a decrease in the film thickness, these diffraction angles became closer to that of the Rh(2 2 0) peak. The values of c, a, and c/a were calculated from the XRD results. The thickness dependence of both c and a was in agreement with the results reported for FeCo previously [12]: the c-values decreased rapidly with an increase in the film thickness, while the a-values showed only a small increase with the film thickness. Figure 4 shows the c/a ratios obtained in this study along with those reported previously for Fe0.5Co0.5 [12]. The c/a ratio of all the films decreased rapidly as the film thickness increased up to 5–10 nm because of structural relaxation [12, 13]. At film thicknesses higher than 10 nm, the c/a ratio decreased slowly. The c/a value for (Fe0.4Co0.6)0.9V0.1 was about 1.15 at t = 5 nm, which reduced to 1.02 at t = 50 nm. It should be noted that the c/a value of the (Fe0.4Co0.6)0.9V0.05C0.05 films was 1.07 even at t = 50 nm. Among the three alloy series, (Fe0.4Co0.6)0.9V0.05C0.05 exhibited a moderate reduction in c/a as the function of the film thickness. Since no diffraction lines for VC compounds were observed, it can be stated that (Fe0.5Co0.5)0.9V0.05C0.05 makes a solid solution without any precipitates. Therefore, interstitial carbon is considered to stabilize tetragonal distortion even at 50 nm. This is consistent with the previous results for FeCo–C [13] and FeCo–TiN [20].

Figure 3. Out-of-plane (a) and in-plane XRD patterns (b) of the (Fe0.4Co0.6)0.9V0.1 and (Fe0.4Co0.6)0.9V0.05C0.05 films with various thicknesses t (t = 2–50 nm).
Download figure:
Standard image High-resolution image
Figure 4. Dependence of the c/a ratio on the film thickness for the (Fe0.4Co0.6)0.9V0.1(○) and (Fe0.4Co0.6)0.9V0.05C0.05(●) films. Previous results for FeCo (♦) are also shown [12].
Download figure:
Standard image High-resolution imageThe easy axis of magnetization of the film was perpendicular to the plane for the (Fe0.4Co0.6)0.9V0.1 (t = 5 nm) film (figure 5(a)), and the magnetic anisotropy constant (Ku1) was larger than 2π . The magnetization curves of (Fe0.4Co0.6)0.9V0.05C0.05 (t = 5 nm) and (Fe0.5Co0.5)0.9V0.1 (t = 5 nm) were almost isotropic as shown in figures 5(b) and (c), and thus the values of Ku1 were nearly equal to 2π
 . The (Fe0.4Co0.6)0.9V0.05C0.05 films (t = 20 nm) showed an in-plane magnetic easy axis (figure 5(d)). Since the saturation field was less than 10 kOe, which is about half of the demagnetization field (4πMs = ~19 kOe), the magnetic anisotropy constant Ku1 was positive and 2π
 > Ku1 > 0. The precise Ku1 values were obtained by fitting the magnetization curves along its hard axes of films using equation (1). The calculated magnetization curves are shown in figures 5(a) and (d) by broken light blue lines.
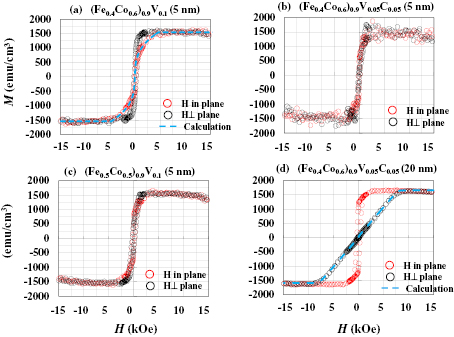
Figure 5. Magnetization curves of (a) (Fe0.4Co0.6)0.9V0.1 (t = 5 nm), (b) (Fe0.4Co0.6)0.9V0.05C0.05 (t = 5 nm), (c) (Fe0.5Co0.5)0.9V0.1 (t = 5 nm), and (Fe0.4Co0.6)0.9V0.05C0.05 (t = 20 nm). Calculated magnetization curves are shown in (a) and (c) by broken light blue lines.
Download figure:
Standard image High-resolution imageFigure 6 shows the uniaxial magnetic anisotropy constant (Ku1) and saturation magnetization (Ms) of the (Fe1−xCox)0.9V0.1, (Fe1−xCox)0.95V0.05 and (Fe1−xCox)0.9V0.05C0.05 films (x = 0.5, 0.6, 0.7, and t = 5 nm) as a function of the Co composition (x). It should be noted that Ku1 showed a maximum value of 1.4 × 10⁷ erg cm−3 at x = 0.6. As the value of x was further increased, the Ku1 value reduced to 1.0 × 10⁷ erg cm−3 at x = 0.7. The value of Ms was about 1500 emu cm−3 in error of  10% and showed a decrease with an increase in x. A small background due to image effect at H > 10 kOe could not be subtracted in some films like figures 5(b) and (c).
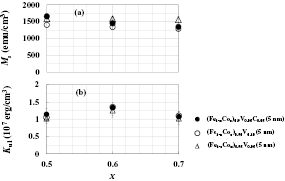
Figure 6. Saturation magnetization Ms (a) and uniaxial magnetic anisotropy Ku1 (b) as a function of x for (Fe1−xCox)0.9V0.1 (○), (Fe1−xCox)0.95V0.05 (Δ) and (Fe1−xCox)0.9V0.05C0.05 (●) films. The thickness of the films was 5 nm.
Download figure:
Standard image High-resolution imageFigure 7 shows the magnetic anisotropy constant Ku1 of the films as a function of their thickness. The (Fe0.4Co0.6)0.9V0.1 films showed a maximum Ku1 (2.0 × 10⁷ erg cm−3) at t = 2 nm. However, it quickly reduced accompanied with the reduction of c/a values, as shown in figure 4. It should be noted that for the films with a thickness greater than 10 nm, the Ku1 of (Fe0.4Co0.6)0.9V0.05C0.05 was higher than that of (Fe0.4Co0.6)0.9V0.1. The values of c/a and Ku1 for (Fe0.5Co0.5)0.96C0.04 were about 1.06 and 0.9 × 10⁷ erg cm−3, respectively at t = 50 nm.

Figure 7. Uniaxial magnetic anisotropy Ku1 as a function of the film thickness for the (Fe0.4Co0.6)0.9V0.1 (○) and (Fe0.4Co0.6)0.9 V0.05C0.05(●) films. Previous results for FeCo (♦) are also shown [12].
Download figure:
Standard image High-resolution image4. Discussion
4.1. Enthalpy of formation (ΔH) evaluated by DFT calculations and structural stability
We observed tetragonal distortion (c/a = ~1.16) in the (Fe0.4Co0.6)0.9V0.1 and (Fe0.4Co0.6)0.9V0.05C0.05 films with a thickness of 5 nm as shown in the previous section. The c/a value of the (Fe0.4Co0.6)0.9V0.05C0.05 films with a thickness of 50 nm was ~1.07. To consider the stability of tetragonal distortion in the films, their enthalpy of formation (ΔH) was calculated by DFT calculations.
The formation enthalpy for FewCoxVyCz compounds, ΔH(FewCoxVyCz), was defined as

where E(FewCoxVyCz) is the internal energy of the system, and E(Fe), E(Co), E(V), and E(C) are the internal energies of Fe, Co, V, and C single elements, respectively. To consider the structural stability of the (Fe0.4Co0.6)0.9V0.1 and (Fe0.4Co0.6)0.9 V0.05C0.05 alloys, we assumed Fe6Co8V2 (Fe0.375Co0.5V0.125) and Fe7Co8VC (Fe0.4375Co0.5V0.0625C0.0625) model compounds, which are composed of 16-atom supercells of 2 × 2 × 2 bcc unit cells. B2-type ordering of Fe and Co atoms was used for designing model structures, because it was expected to give the lowest value for ΔH. The formation enthalpy ΔH was calculated as a function of c/a in each atomic arrangement. Figure 8(a) shows the ΔH of Fe6Co8V2 and Fe7Co8VC along with that of Fe16C for comparison. The ΔH of Fe16C showed a negative value and was minimum at c/a = ~1.08. This is consistent with the previous experimental results and theoretical calculations [19, 31]. The ΔH value of Fe16C indicates that it is formable at low temperatures. However, it decomposes into Fe and Fe3C upon heating [19].
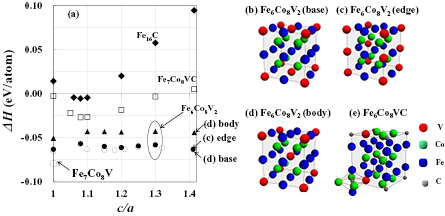
Figure 8. Enthalpy of formation ΔH (a) of Fe6Co8V2 and Fe7Co8VC compounds as a function of the c/a ratio. ΔH calculated for Fe16C is also shown. Model structures of Fe6Co8V2 ((b), (c), and (d)) and Fe7Co8VC (e) compounds for DFT calculations.
Download figure:
Standard image High-resolution imageIn the model structures of Fe6Co8V2, one vanadium atom was located at one of the vertices of the cube, while the other vanadium atoms were positioned at the base center (figure 8(b)), edges (figure 8(c)), and body center (figure 8(d)). The bcc structure had the lowest ΔH among the three structures. However, it should be noted that the ΔH of the three model structures was almost independent of their tetragonal deformation, and the three atomic arrangements (figures 8(b)–(d)) showed a local minimum at c/a of around 1.2. A flat ΔH − c/a relation and a local minimum are the specific features of this composition. We did not observe this kind of behavior in other compositions. According to the equilibrium phase diagram, Fe6Co8V2 is located near the boundary between the bcc and fcc phases [21]. This might be a reason for its flat ΔH − c/a relation. Although the tetragonal structure (c/a = ~1.2) of Fe6Co8V2 is metastable, as shown in figure 8(a), it is likely that the compressive stress due to epitaxial effect stabilizes the tetragonal state in thin epitaxial (Fe0.4Co0.6)0.9V0.1 films. Although the present DFT calculations were done for the atomically ordered Fe6Co8V2 phase, they seem to suggest a tendency of tetragonal deformation in the epitaxial FeCoV films.
In Fe7Co8VC, we assumed that C atoms were located at specific octahedral interstitial sites where C atoms were surrounded by three Fe and one V (in-plane), and two Co (along the c-axis) neighbors (figure 8(e)). The ΔH of this arrangement (Fe7Co8VC) showed a minimum value at c/a = ~1.08 (figure 8(a)). This c/a value (1.08) is in consistence with the experimental result obtained for the (Fe0.4Co0.6)0.9V0.05C0.05 film with a thickness of 50 nm (c/a = 1.07). We also calculated ΔH values for several atomic arrangements, but this atomic arrangement (figure 8(e)) showed the lowest ΔH among other arrangements. This is probably because VC is the most stable compound among the compounds composed of Fe, Co, V, and C elements. However, it should be mentioned that the ΔH value of Fe7Co8VC at c/a = ~1.08 was about −0.05 eV/atom higher than that of Fe7Co8V as shown in figure 8(a). This higher ΔH can be attributed to the fact that interstitial carbon atoms generate local strains around them and degrade the B2 ordering of the system, resulting in an increase in ΔH. The epitaxial thin film process is considered to suppress atomic diffusions and the formation of stable compounds like VC and Fe7Co8V. It is therefore expected that the tetragonal structure of Fe7Co8VC disappears with heating, finally leading to the formation of VC and Fe7Co8V. In Fe7Co8VC systems, it is imperative to suppress the formation of VC and to obtain tetragonal compounds.
4.2. Magnetic property
The magnetocrystalline anisotropy constant Ku1 includes all intrinsic contributions to magnetic anisotropy except the shape anisotropy (−2π ). Namely Ku1 will be composed of volume magnetic anisotropy due to tetragonal distortion and B2 chemical ordering, and interfacial (or surface) magnetic anisotropy. Interfacial magnetic anisotropy of FeCo/Rh epitaxial films and the effect of B2 chemical ordering are however considered to be negligible [12, 32]. Therefore the magnetic anisotropy induced by the tetragonal distortion seems to be predominant. The magnetoelastic contribution to the uniaxial magnetic anisotropy in a cubic system is generally written as (3/2) λ100 (c11 − c12) (c/a − 1), where λ100 is a magnetostriction constant and c11 and c12 are elastic stiffness constants. This is the phenomenological approximation for the volume magnetic anisotropy due to distortion, when the strain is small and treated by 'linear magnetostriction' [33]. Since the tetragonal distortion c/a is quite large in the present films as shown in figures 2 and 4, we use 'the magnetic anisotropy due to tetragonal distortion' rather than the magnetoelastic effect. The relation between the magnetcrystalline anisotropy constant Ku1 and the tetragonal distortion c/a is discussed in the next paragraph.
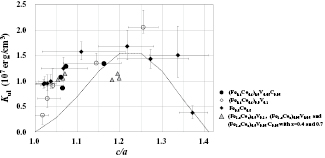
The c/a dependence of Ku1 for the (Fe100−xCox)0.9V0.1 and (Fe100−xCox)0.9V0.05C0.05 films (t = 2–50 nm for x = 0.6, t = 5 nm, x = 0.5 and x = 0.7) is shown in figure 9 along with the previous results for Fe1−xCox [12]. The minimum value of Ku1 was obtained at c/a = ~1.2. This value decreased further as the c/a value decreased from 1.2 to 1.0 (bcc) or to √2 (fcc). This observation is in agreement with the experimental and theoretical (obtained by first-principles calculations) results obtained previously for FeCo alloys [2, 3]. According to the first-principles calculations, the magnetic anisotropy of tetragonally distorted FeCo is attributed to its unique electronic structure. It has two states (dxy and dx2−y2) in a minority band located at an energy level intermediate between those of the two states. The dxy and dx2−y2 states hybridize via spin–orbit interactions, and the resultant energy gain leads to magnetic anisotropy. This mechanism seems to be effective in FeCo(V) alloys too. The c/a values at x = 0.7 for (Fe1−xCox)0.9V0.1 and (Fe1−x Cox)0.9V0.05C0.05 (▲ in figure 9) were however a little lower than those at x = 0.6, though a larger Ku1 was expected at c/a = ~1.2. This reduction in the c/a values can be attributed to the structural degradation of the films. As shown in figure 1, at x = 0.7, the intensity of the in-plane XRD peaks was very low. It probably suggests the absence of an in-plane coherency and/or a wide distribution of the a-values. Hence, it can be stated that such structural degradations reduce the uniaxial magnetic anisotropy of FeCo alloy films.
Figure 9. The c/a ratio dependence of Ku1 for various FeCoV and FeCoV films. Previous results for FeCo are also shown [12]. ●: Fe0.4Co0.6)0.9V0.05C0.05, ○: (Fe0.4Co0.6)0.9V0.1, ♦: Fe0.5Co0.5, ▲: (Fe0.6Co0.4)0.9V0.1, (Fe0.3Co0.7)0.9V0.1, (Fe0.6Co0.4)0.95V0.05, (Fe0.3Co0.7)0.95V0.05, (Fe0.6Co0.4)0.9V0.05 C0.05, and (Fe0.3Co0.7)0.9V0.05 C0.05.
Download figure:
Standard image High-resolution image
FeCo alloys containing 10–20 at% V are called vicalloys [22–24]. The alloys containing less than 10 at% V are referred to as vicalloy I (typically Fe0.39Co0.52V0.09), while those with 10–20 at% V are termed vicalloy II (typically Fe0.35Co0.52V0.13). These are semi-hard magnets with a coercivity of 300–500 Oe. Although the magnetic hardening mechanism of vicalloys has not been fully elucidated yet, the possible reasons (1)–(5) are considered: (1) the shape anisotropy of the bcc phase, (2) stress-induced anisotropy, (3) the magnetic anisotropy of martensitic needle, (4) the magnetic anisotropy of B2 ordered precipitates, and (5) domain wall pinning at non-magnetic precipitates or at the B2 anti-phase boundaries. The composition of the (Fe0.4Co0.6)0.9V0.1 alloy used in this study was very close to that of vicalloys. In this study, (Fe0.4Co0.6)0.9V0.1 (Ms ~ 1500 emu cm−3) showed a Ku1 of up to 1.4 × 10⁷ erg cm−3, and an anisotropy field (2Ku1/Ms) of over 10 kOe could be achieved. The semi-hard magnetic property of vicalloys can be attributed to the presence of the tetragonally distorted precipitates or clusters formed during the α–γ transformation, and hence it is suggested that the formation of a bct FeCo(V) phase can improve the semi-hard magnetic properties of vicalloys.
5. Conclusion
The tetragonal structure and magnetic properties of MgO/Rh/(Fe100−xCox)0.9V0.1 and MgO/Rh/(Fe100−xCox)0.9V0.05C0.05 films (0.4  x
x  0.7, t = 2–50 nm) were studied. The films with t = 5 nm showed tetragonal distortion with a c/a reaching ~1.15 at x = 0.6 for both the systems. Furthermore, (Fe100−xCox)0.9V0.05C0.05 showed a c/a ratio of ~1.07 even at t = 50 nm. The (Fe100−xCox)0.9V0.1 and (Fe100−xCox)0.9V0.05C0.05 films (t = 5 nm) showed a maximum uniaxial magnetic anisotropy (Ku1) of 1.4 × 10⁷ erg cm−3. This can be attributed to their tetragonal distortion.
The formation enthalpy of Fe6Co8V2 and Fe7Co8VC was evaluated by DFT calculations to study the structural stability of both the alloys. The DFT calculations showed that a bct structure existed as a metastable state in both the alloys, and hence the in-plane compressive stress due to epitaxial processes is believed to stabilize the bct structures in epitaxial thin films.
Acknowledgments
This paper is based on the results obtained from a project commissioned by the New Energy and Industrial Technology Development Organization (NEDO).