

Abstract
Surface acoustic waves (SAWs) are optically excited in periodic nanomagnet arrays and drive the magnetization precession via magnetoelastic coupling. The frequency of this mechanically induced magnetic response is pinned at the SAW frequency over an extended range of applied fields. First, we show by experimental and numerical investigation of materials with different combinations of damping and magnetoelastic coupling strengths that the field-dependent width of this pinned resonance depends only on the effective damping αeff. Second, we derive an analytical expression for determining αeff from the Lorentzian lineshape of the field-dependent Fourier amplitude of this resonance. We show that the intrinsic Gilbert damping can be determined in the high field limit by analyzing multiple pinned resonances at different applied fields. This demonstrates that intrinsic damping can be extracted all-optically, despite interactions with nonmagnetic degrees of freedom. We find damping values of 0.027, 0.028 and 0.25 for Ni, Co and TbFe respectively. Finally, the validity of the experimental results is verified by excellent agreement with micromagnetic simulations incorporating the magnetoelastic coupling, which shows that the pinning width is unaffected by the magnetoelastic coupling constant over three orders of magnitude. This finding has implications for the rational design of spintronic devices that involve magnetoelastic effects.
Export citation and abstract BibTeX RIS
Invited by Andreas Berger. A Viewpoint on this Letter has been published in 2017 50 231001.
Manipulating the spins in magnetic materials has been the focus of intense research with the end goal being increasing the performance of computing. These spintronic devices utilize the spin degrees of freedom and depend critically on various material properties. One parameter, the Gilbert damping constant α, has received bounteous attention in the field. Knowledge of this parameter is critical for the development of many spintronic devices, including spin transfer torque magnetic random access memories (STT-MRAMs) and heat-assisted magnetic recording (HAMR). In these devices, α determines the critical device operation characteristics, such as the threshold switching current density [1], switching time [2], and transition jitters [3], and can be determined using different experimental techniques [4, 5]. Time-resolved magneto-optical Kerr effect (TR-MOKE) analysis is one that is well suited to investigating nanomagnets, due to its high spatial resolution and sensitivity [6, 7]. This technique is based on using the decay time and frequency to calculate the damping of optically excited small angle magnetization precessions [5]. At low fields, this effective damping contains both intrinsic and extrinsic mechanisms, and converges to the intrinsic Gilbert damping at high fields [5, 8].
Recently, we demonstrated that optically generated surface acoustic waves (SAWs) can significantly influence the magnetization dynamics of a patterned nanomagnet array [9–11]. In addition to the intrinsic Kittel mode precession [12], magnetic resonances are magnetoelastically driven by the SAWs. This causes the spin precession resonances to be pinned at the SAW frequencies around certain applied fields where the two resonances are degenerate, significantly altering the dynamic response of an array. While this novel effect opens up a new degree of freedom for manipulating the spins in nanopatterned devices, it would also suggest that TR-MOKE cannot be used for measuring damping all-optically due to the perturbed dynamic response of the array.
In this study, we examine in detail this interplay between damped magnetic and mechanical resonances. We show experimentally, analytically, and by using micromagnetic simulations, that the field range over which the magnetic resonance is pinned to a SAW resonance is determined by the effective damping coefficient  and not the magneto-elastic coupling coefficient, Bi. This enables us to extract the field-dependent effective damping
  directly from the pinning linewidth, and even recover the intrinsic Gilbert damping at large applied fields. We therefore show that magneto-elastic coupling to SAWs is not detrimental, but rather provides an alternative path towards damping analysis in patterned arrays for a wide range of damping values.
Several arrays of TbFe, Ni and Co square nanomagnets with a similar size and possessing different combinations of relative α and Bi values were fabricated for this study. Ni and Co squares 30 nm thick with an average size of 160 nm and array pitches of p = 330 nm and p = 250 nm, respectively, were prepared by e-beam lithography, e-beam evaporation, and the lift-off process on a substrate with a 110 nm thick hafnium oxide antireflection (AR) coating [9, 13]. A 19 nm thick amorphous ferrimagnetic Tb25Fe75 film was deposited at room temperature on top of a Si (1 0 0) substrate coated with 100 nm of SiO2 by dc magnetron sputter deposition. The TbFe film exhibits strong perpendicular magnetic anisotropy. More details about the film preparation and its magnetic properties are reported in [14]. Afterwards, the film was milled into dots with an average size of 150 nm and p = 250 nm (see the scanning electron microscopy (SEM) image in figure 1(a)). The array responses were studied with a previously described TR-MOKE two-color pump-probe setup [9, 15]. As sketched in figure 1(b), pump laser pulses (165 fs pulse width, 76 MHz repetition rate, λ = 400 nm, FWHM 10.6 μm, fluence = 0.22 mJ cm−2) were focused on the nanomagnet samples under an external field  applied at an angle θH = 60° from the surface normal to the TbFe array and θH = 30° for the Co and Ni arrays. This tilts the effective field direction away from the z-axis in order to create strong polar TR-MOKE signals. The probe beam (165 fs pulse width, 76 MHz repetition rate, λ = 800 nm, FWHM 7.1 μm, fluence = 0.06 mJ cm−2) detects their time evolution at an adjustable time delay. The optical excitation from the blue pump pulse has two important effects on the nanoelements. Firstly, it rapidly modifies the magnetic anisotropy which causes the magnetization to precess around the effective field. Secondly, the energy absorbed from the laser pulse causes the thermal expansion of the elements, which subsequently mechanically oscillate. These mechanical oscillations from all the nanoelements launch SAWs into the substrate in various directions, with the eigenfrequencies given by [16]
where v is the velocity of the SAW in the substrate, p is the pitch of the array and (i,j) are the indices of the k-vector. Using a balanced photodetector configuration, the changes in both the polarization and the total reflected power were recorded as the magnetic (difference channel) and nonmagnetic SAW (sum channel) signals, respectively [9, 17]. The time-dependent magnetic and nonmagnetic signals are background-corrected and subjected to the discrete Fourier transformation to reveal both the magnetic precession and nonmagnetic mechanical modes.

Figure 1. (a) Scanning electron micrograph of the TbFe array with an average element size of 150 nm and an array pitch p = 250 nm. (b) A schematic of the laser excitation in TR-MOKE measurements. (c) TR-MOKE time traces in the magnetic difference channel (black) and nonmagnetic channel (NM, light gray), measured on the TbFe array at the field  = 2.25 kOe applied at θH = 60° to the surface normal. The first ~250 ps of the magnetic signal is dominated by the intrinsic Kittel mode (KM), while the later part is dominated by the SAW-driven magnetoelastic (MEL) mode. (d) The absolute Fourier amplitude of the corresponding time traces for t < 700 ps; the black and gray arrows indicate the peaks of the intrinsic KM and the magnetoelastic mode coupled to the SAW. (e) and (f) The absolute Fourier amplitude spectra of the magnetic and nonmagnetic signals at varying
  .
.
Download figure:
Standard image High-resolution imageAs an initial example we consider TbFe. Figure 1(c) shows the dynamics after optical excitation, measured at  = 2.25 kOe, showing oscillations in both magnetic and nonmagnetic channels. The discrete Fourier transform of the corresponding data is shown in figure 1(d). The nonmagnetic signal (light gray) exhibits a prolonged oscillation at the SAW frequency fSAW = 17.8 GHz determined by equation (1) [16]. The magnetic signal (black), on the other hand, is governed by two dominant oscillation modes. The first peak at 9.2 GHz corresponds to the intrinsic Kittel mode (KM) of the nanomagnetic elements and is prominent in the first ~250 ps of the time trace (see figure 1(c)). The second peak is due to the magneto-elastic driving of the magnetic system by the SAWs. Figures 1(e) and (f) show the field dependence of the absolute Fourier amplitude on the initial time section t < 700 ps for the magnetic and nonmagnetic channels, respectively. Importantly, figure 1(e) shows that the magnetization precession is pinned at fSAW = 17.8 GHz and the Fourier amplitude is strongly enhanced when the KM crosses fSAW. We have investigated the possibility of leakage between the magnetic and nonmagnetic channels and have determined that the effect is minimal [9].
In order to understand this pinning effect, we must understand how the elastic deformations alter the magnetic free energy. In the static regime, without an external perturbation, the magnetic free energy density G0 of an isotropic thin film is given by [18]

where  with components
  ,
,  is the externally applied magnetic field and
  = 2πMS is the shape anisotropy. In equilibrium, the magnetization is oriented along a minimum of
  .
.
In addition to the magnetostatic energy, there is a magnetoelastic energy term that depends on the time-varying elastic deformations caused by the SAWs [19]

where  with
with  are the strain tensor components,
  is the mechanical displacement and B1 and B2 are the magnetoelastic coupling constants.
The LLG equation describes the motion for the magnetization subjected to an effective field  [18]
[18]

where  is the gyromagnetic ratio and
  is the phenomenological damping parameter. The effective field,
  , can be derived from the total free energy, which is comprised of a static component arising from the applied and internal anisotropy fields (equation (2)) and of a dynamic component due to the magnetoelastic coupling to the SAWs (equation (3)) [18]

As the SAW propagates, it dynamically modifies the free energy of the magnetic system, which acts as a driving-term  in the total effective field
  . As the intrinsic magnetic mode approaches resonance with
  , the magnetization precesses.
In order to analyze the pinning width of this cross-over resonance, we make two important assumptions. Firstly, we assume that there is negligible back-action from the magnetization dynamics onto the SAWs [9, 19]. This is further justified by the fact that there is no change to the nonmagnetic signal in the sum channel at the crossover points. Secondly, due to the much larger decay time of the SAWs in comparison to the intrinsic magnetization dynamics, we can assume a pseudo-steady magnetoelastic driving field  to model the response of the magnetic system. We assume the effective magnetic field and the magnetization to be sums of the static and dynamic components
  and
and  , where the oscillatory part of both
  and
and  is given by eiωt. Redefining the z-axis along the equilibrium magnetization direction,
  , and assuming a small angle precession, allows us to linearize the LLG equation (4). This results in two coupled equations relating the transverse components of the magnetization to the components of the driving field
  , where
  is the complex susceptibility tensor and the imaginary part is a Lorentzian. If we assume a constant driving frequency ω = 2πfSAW, then the field-dependent linewidth of this Lorentzian is given by ΔHP = 4παefffSAW/γ. The derivation is adapted from [20] and further details can be found there. Thus, instead of the SAW pinning being detrimental to damping analysis, it allows us to extract
  from the measured ΔHP as
Intuitively, one might have expected ΔHP to depend on the magnetoelastic coupling coefficients Bi that characterize the coupling between mechanical and magnetic oscillations. Equation (6), however, suggests that ΔHP is solely determined by the effective damping  . For an unambiguous conclusion and to assess whether this technique can be used to extract the intrinsic Gilbert damping, we investigated different materials with various combinations of Bi and α. These materials and their corresponding values of α and Bi are displayed in table 1.
Table 1. Materials with different combinations of α and Bi used in this study.
| Material | TbFe | Co | Ni |
|---|---|---|---|
| α | Large (~0.2–0.3) [21] | Small (0.02) [22] | Small (0.04) [6] |
| Bi | Large (−22.5 MJ m−3) [23] | Large (25.6 MJ m−3) [24]4 | Small (7.85 MJ m−3) [19] |
First, we examine the TbFe array, which has both large damping and magnetoelastic coupling and only a single SAW resonance to consider. We focus on the dynamics after the intrinsic magnetic mode has damped out and the magnetization is exclusively driven by the pseudo-steady magnetoelastic field  [9]. The resulting spectra derived from t = 400–1100 ps are shown in figure 2(a) and do not show the intrinsic, field-dependent KM anymore. The pinned mode at fSAW remains in the spectra due to its longer decay time, and shows enhanced amplitude at the crossover field. The complex Fourier amplitude
  of the magnetic signal at varying
  was traced at fSAW = 17.8 GHz (dashed line in figure 2(a)). Because the magnetic system is a driven oscillator, we adjusted the phase of the magnetic signal relative to the driving frequency of the nonmagnetic signal. Additionally, in order to compensate for a small drift in laser power we scaled the amplitude of the magnetic signal to that of the nonmagnetic signal. Therefore,
  was scaled to the nonmagnetic Fourier amplitude
  , traced in the same way as
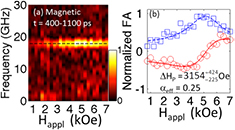
Figure 2. (a) The Fourier amplitude spectra of the magnetic signal for the time section t = 400–1100 ps, measured on the TbFe array. The horizontal dashed line represents the frequency fSAW of the fundamental SAW. (b) The normalized complex Fourier amplitude of the magnetic signal traced at fSAW, after phase adjustment and scaling with the nonmagnetic signal. The circles and squares represent the real and imaginary parts, respectively. The solid and dashed lines are Lorentzian fits. The obtained pinning width ΔHP, pinning width error and the effective damping estimated with equation (6) are also displayed.
Download figure:
Standard image High-resolution imageIts normalized real and imaginary parts are plotted in figure 2(b). A fit with a complex Lorentzian shape is in excellent agreement with the data, and a pinning width ΔHP = 3154 Oe—defined as the full width half maximum (FWHM) of the imaginary part—is obtained. By applying equation (6) to ΔHP = 3154 Oe, obtained from the fit in figure 2(b), the Gilbert damping is estimated to be  = 0.25 for the patterned TbFe nanomagnets. TbFe is a highly damped material (no optically excited oscillations were detected on an unpatterned film), and few experimental values have been reported. Our measured value, however, is in good agreement with the literature [21]. Also note that it is much larger than the damping value of αSAW = 0.005 extracted from the oscillations in the nonmagnetic channel across the entire field range, corroborating the conclusion that we are indeed extracting a magnetic parameter, and back-action from the magnetic to the nonmagnetic oscillations is negligible [9, 19]. As a second independent confirmation, we extracted an effective damping value in the time domain using the early part of the TR-MOKE signal when the intrinsic mode is dominant. Using the previously described TR-MOKE setup [9, 15], we fit the lifetime and frequency of the magnetic signal and determined the field-dependent effective damping defined as αeff = 1/(2πfτ) [5], where τ is the decay constant of the exponentially damped sinusoidal oscillation and f is the frequency. We found a decreasing αeff with
  , as previously observed in numerous material systems [25–28].
  approaches a constant value of
  = 0.25 for
  ⩾ 1.75 kOe, in excellent agreement with our estimate from the pinning width ΔHP.
The pinning at several well-defined SAW frequencies for both nickel and cobalt is shown in figures 3(a) and (b), respectively. This allows us to extract field-dependent effective damping values at multiple crossover points. These Fourier maps are derived from time sections of t = 1500–2500 ps, where the precession was exclusively driven by the SAWs. In Ni (figure 3(a)), both the center and edge modes are visible in the magnetic response, crossing the fSAW at different fields. The Co array response (figure 3(b)) exhibits similar behavior with multiple SAW crossings through one dominant KM. The lower signal from the Co array could explain the absence of an edge mode in the data, and the smaller pitch in the Co array means there are more higher order SAWs in the frequency range of interest, which sustains the KM at more resonances than in the Ni array. Both Fourier maps were analyzed as described above using one or two Lorentzian peaks of equal width and a single effective damping value for each SAW crossing. Figures 3(c) and (d) show that the model fits all resonances well and allows for the extraction of field-dependent effective damping for both arrays. Figure 3(e) displays the extracted αeff behavior and a comparison with the high-field damping measured in unpatterned films (0.033 for nickel and 0.02 for cobalt), using the conventional TR-MOKE technique [5–8]. The effective damping values contain contributions from both the intrinsic damping and extrinsic mechanisms such as the locally varying anisotropy fields [10, 25]. They show a typical decrease with the applied field and approach the film damping in the high field limit for the nickel array. We note that the pinning linewidths are noticeably smaller than for TbFe due to the lower damping in both nickel and cobalt.
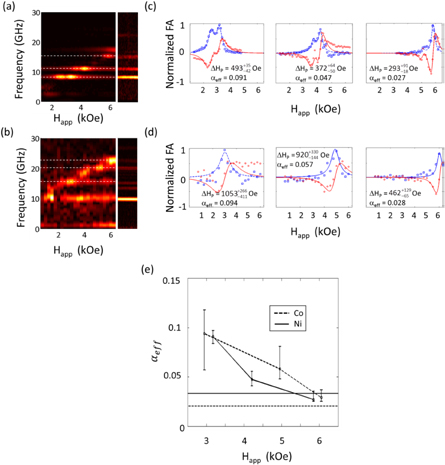
Figure 3. (a) and (b) The magnetic channel Fourier amplitude spectra measured on the Ni (a) and Co (b) arrays in comparison with the nonmagnetic reflectivity channel. The time sections of t = 1500–2500 ps were analyzed. The dashed white lines indicate the SAW frequencies analyzed. (c) and (d) The normalized complex Fourier amplitude of the magnetic signal traced at fSAW, after phase adjustment and scaling with the nonmagnetic signal. The circles and squares represent the real and imaginary parts, respectively. The solid and the dashed lines are the fits with the Lorentzian shape. The obtained pinning width ΔHP, pinning width error and Gilbert damping parameter estimated with equation (6) are also displayed. (e)  displays the effects due to inhomogeneous broadening and approaches the value of a film measured at 6000 Oe (straight lines).
Download figure:
Standard image High-resolution imageWhile these high-field limits correspond to the intrinsic Gilbert damping for nickel, the value for cobalt is still higher than the expected α = 0.005 [22]. This is due to the imperfect elimination of inhomogeneous broadening for both the film and the array, due to limitations in the maximum H-field available in our experimental setup (~6.3 kOe) [27]. The measurements, however, clearly answer the question of whether  or Bi is responsible for the pinning linewidth. Despite Bi for cobalt being more than three times as large as that of Ni, the Co pinning linewidth approaches a value of ΔHP = 462 Oe, which is similar to the high field Ni value of ΔHP = 293 Oe. Both the Co and Ni pinning linewidths are an order of magnitude smaller than the ΔHP = 3154 Oe observed in the TbFe array. These observations further corroborate the validity of equation (6), predicting a linear dependence of ΔHP on
  but not on Bi.
As a last step, we present the simulated magnetization precession with a calculated  . We show that the linear dependence of ΔHP on
  is correctly modeled by micromagnetic simulation with magnetoelastic contributions. Squares of 125 × 125 × 30 nm3 on a 110 nm hafnium oxide AR coating were modeled, as previously described [9], and details of the simulation procedure can be found there. The time evolution of Mz(t) was simulated with various
  and Bi values, and the time section t = 1500–2500 ps was analyzed in the same manner as the experimental data. Figures 4(a)–(f) show several examples of the simulated Fourier spectra and the complex Fourier amplitude at fSAW. Here, the displacement uz(t) at the center of the square nanomagnet was used for phase adjustment instead of the nonmagnetic signal. As in the Ni measurements, the spectra were fitted with two Lorentzian peaks, corresponding to the center and edge modes. Figures 4(g) and (h) summarize ΔHP and
  estimated with equation (6) as functions of Bi and
  specified in the simulations. They show that ΔHP is indeed proportional to
  and unaffected by a change in Bi over three orders of magnitude (figures 4(g) and (h)), confirming the experimental observations and the analytical result of equation (6).
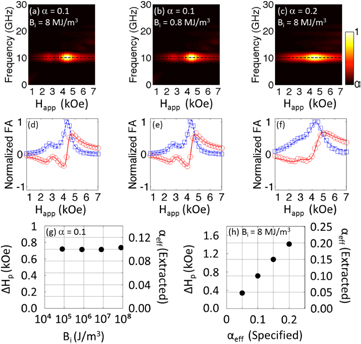
Figure 4. (a)–(c) The simulated Fourier spectra for various damping  and magnetoelastic coefficients Bi. A time section of t = 1500–2500 ps was analyzed. (d)–(f) The calculated complex Fourier amplitude at fSAW (symbols) and the fit with two Lorentzian peaks (lines). (g) and (h) Plots of the estimated pinning width ΔHP and extracted αeff as functions of Bi and the αeff specified in the simulations. From ΔHP, αeff was estimated with equation (6) and displayed with the second vertical axes.
Download figure:
Standard image High-resolution image
In conclusion, we showed that the external field range, over which the magnetic response is pinned to a mechanical SAW resonance, is proportional to  and is not a function of the magnetoelastic coefficients Bi. We demonstrated this both experimentally as well as in simulations, and derived an analytical relation between ΔHP and αeff. Rather than making reliable damping analysis impossible, this enabled a novel approach for extracting effective damping from a nanomagnet array using an all-optical technique. Despite being determined very differently, the effective damping shows a well-known decrease with the applied field, and approaches the intrinsic Gilbert damping in the high-field limit. In addition, controlling the extent of this pinning region may be important for the design and characterization of nanometer-scale spintronic devices.
Acknowledgments
This work was supported by the National Science Foundation under grant nos. DMR-1311744 and DMR-1506104 and by the German Research Foundation (DFG) under grant no. AL618/21-1. Work at the Molecular Foundry, Lawrence Berkeley National Laboratory, was supported by the Office of Science and the Office of Basic Energy Sciences of the U.S. Department of Energy under contract no. DE-AC02-05CH11231. We acknowledge T Yuzvinsky and the W M Keck Center for Nanoscale Optofluidics at the University of California at Santa Cruz for the SEM imaging and ion milling.
Footnotes
- 4
Voigt–Reuss average and the result of [24] were used to obtain the polycrystalline Co parameters with the hcp grains.