

Abstract
We performed photoelectron spectroscopy using femtosecond extreme-ultraviolet (XUV) pulses from a free-electron laser and femtosecond near-infrared (NIR) pulses from a synchronized laser, and succeeded in measuring photoelectrons from highly excited Rydberg states of molecular ions  Such excited states are prepared via a sequential process of photoionization and subsequent photoexcitation during a short pulse of XUV, and then a band of the Rydberg excited states is probed with a synchronized NIR pulse. The photoelectron spectrum has been well explained by our hydrogenic Rydberg orbital model. The present result demonstrates that the two-color experiments of XUV free-electron lasers and NIR laser makes it possible to observe highly excited states of molecular ions. This implies that the present approach provides ones a new spectroscopic tool for studying excited states of various molecular ions.
Export citation and abstract BibTeX RIS
1. Introduction
Up to the 1980s, despite the abundance of excited atoms or atomic ions in stellar atmospheres, there were very few measurements on the photoionization of such species. However, the dramatic advances have been made during the last two decades for spectroscopic measurements of atomic ions (see [1, 2] for reviews.) In contrast to this, on the photoionization of molecular ions there were still few measurements so far [3–5], due to experimental difficulties. The lack of such spectroscopic data on excited molecular ions has been one of limiting factors for our understandings on planetary atmospheres [6].
The tunable extreme-ultraviolet free-electron lasers (XUV-FELs) have a new horizon to investigate photoemission processes from the excited states of the molecular ions. That is, due to the sequential processes by the tunable XUV-FEL, one electron in a valence orbital of a neutral molecule is ionized, and then one more electron in another valence orbital is resonantly excited into a higher orbital [7]. In this scenario, one can expect that inside the small focused area of the tunable XUV-FEL an appreciable amount of excited molecular ions M+* coexists with other species such as ground state ions M+ as well as both excited M* and ground state neutral molecules M in pulsed molecular beams during the short pulse duration of the tunable XUV-FEL. Thus, if one synchronizes near-infrared (NIR) laser pulses with the tunable XUV-FEL pulses, photoelectron spectroscopy of excited molecular ions will be realized.
In this paper, we demonstrate the photoelectron spectroscopy for highly excited ionic states of CS2 molecules. Namely, the neutral CS2 molecules are first ionized by absorption of an XUV photon, and then further excited by absorption of an additional XUV photon within the same pulse. Higher Rydberg excited states of molecular ions  produced in this sequential process are then ionized by an NIR laser pulse that is synchronized with the XUV-FEL pulse. The photoelectron spectrum and its angular distribution due to such two-color processes are measured using velocity map imaging (VMI) spectrometer. The spectrum is explained by our hydrogenic Rydberg orbital model. Its angular distribution is also discussed for photoemission from aligned CS2 molecules.
2. Experimental
The experiments have been performed at the beam line BL1 [8, 9] of the newly operated SXFEL in SACLA [10]. In the present experiments, the XUV-FEL was operated at the wavelength of 59.3 nm (photon energy ωH = 20.9 eV) with the bandwidth of about 0.5 eV (FWHM). The XUV-FEL pulse duration τH was estimated as ∼300 fs (FWHM) and its energy was ∼2 μJ. For the two-color experiments, we also used the optical laser system [8] at SACLA BL1; the Ti:sapphire NIR laser was operated at the central wavelength of 793 nm (photon energy ωL = 1.56 eV) with the bandwidth of ∼0.06 eV (FWHM). The NIR laser pulse duration τL was 490 fs (FWHM) and its pulse energy was ∼4 mJ. The peak intensities of ∼1013 W cm−2 could be reached at the focus of ∼100 μm diameter. The XUV-FEL and NIR laser pulses were combined collinearly by a holey mirror in a vacuum chamber that houses facing VMI spectrometers (see [11, 12] for details). The pulsed CS2 molecular beam was crossed by the collinear laser beams. Then, electrons produced in the interaction region were drawn toward the upper VMI, while ions were drawn toward the lower VMI; the former recorded two-dimensional (2D) photoelectron momentum images, and latter records 2D ion momentum images.
A spatial overlap between the XUV-FEL with the focus size of ∼10 μm diameter and the NIR laser with the focus size of ∼100 μm diameter was confirmed by monitoring their spot images on a Ce:YAG screen installed at the interaction region. The temporal overlap between the NIR and XUV-FEL pulses was confirmed by the Ar 3p photoelectron sideband measurements [13]. The timing jitter between the two pulses was estimated to be ∼1 ps [13]. This timing jitter is extremely shorter than the lifetime of the Rydberg excited states for the CS2 molecule, which can be estimated to be in the order of μs by referring to the lifetime of 0.6 μs of the Rydberg hydrogen atom H*(8p) [14]. From this, it is reasonably considered that the jitter hardly affects the experimental results. Thus, we did not perform a shot-by-shot data treatment.
On one hand, both the XUV-FEL and synchronized NIR laser were operated at a repetition rate of 30 Hz. On the other hand, the pulsed valve for the molecular beam was operated at a 15 Hz repetition rate. Thus, the 2D images (signal + background) with and those (background) without the sample molecules were alternately measured, and then the 2D images without both the noise from the residual gas and the scattered XUV were obtained by subtracting the background from the (signal + background) 2D images. The acquired 2D data consisted of 5000 laser-shot images.
The typical 2D images shown in figure 1 display both the Abel-inverted image of CS2 valence photoelectron momentum due to the XUV-FEL only and that of CS2 valence and  Rydberg photoelectron momentum due to the XUV-FEL and synchronized NIR laser. The signals due to the NIR laser only were three orders of magnitude weaker than those caused by the XUV-FEL. In figure 1(a), three photoelectron rings from the valence orbitals of 2πg, 2πu, and 5σu are observed. From the 2D image, the asymmetry parameter β [15], which describes the PADs relative to the polarization vector of the XUV-FEL, was determined; β = 1.1 ± 0.2, 1.1 ± 0.2, and 0.7 ± 0.2 for the 2πg, 2πu, and 5σu orbital, respectively. These results are reasonably consistent with the previous synchrotron radiation work [16]; β = 1.4 ± 0.1, 1.3 ± 0.1 and 0.4 ± 0.1. The relevant photoelectron spectrum is shown in figure 1(c).
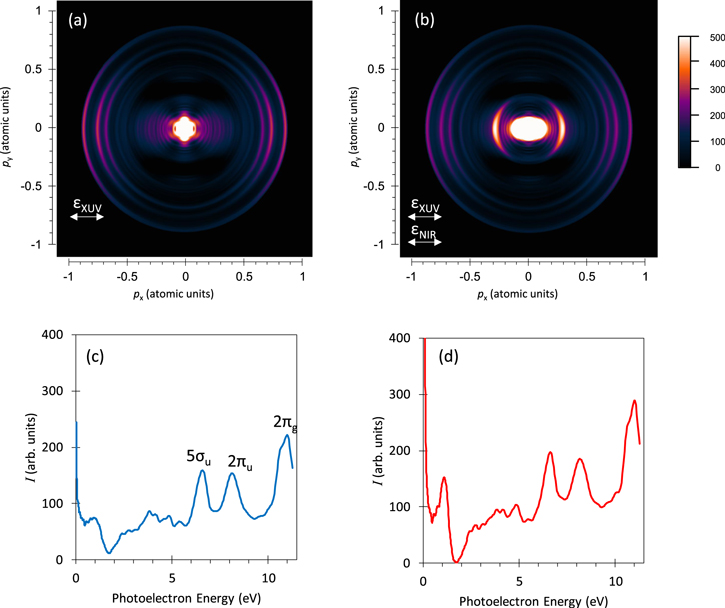
Figure 1. Photoelectron momentum images (top) and corresponding photoelectron spectra (bottom) of CS2. (a); Abel-inverted photoelectron image with XUV laser only, (b); image with both XUV and NIR lasers, (c); photoelectron spectrum with XUV laser only, and (d); photoelectron spectrum with both XUV and NIR lasers. Polarization directions of XUV and NIR lasers are shown by arrows.
Download figure:
Standard image High-resolution imageIn figure 1(b), a newly observed ring with the momentum of 0.28 (in atomic units) appears. A mechanism to produce such a ring is considered as the following three-step processes; (i) the 2πg orbital ionization of the neutral CS2 molecules by the XUV-FEL, (ii) the sequential excitation of the 5σu into Rydberg orbitals in the singly ionized molecular ions  by the XUV-FEL, and (iii) the Rydberg orbital ionization of the
  ions by the NIR laser. More detailed discussions are given in the next section. The relevant photoelectron spectrum is shown in figure 1(d).
3. Results and discussions
In this section, we discuss the mechanism of the three-step processes and give a qualitative explanation for the photoelectron spectrum of the Rydberg states, based on our hydrogenic Rydberg orbital approximation. Furthermore, the angular distribution of the photoelectrons from the Rydberg states is also discussed.
3.1. Photoelectron spectrum of resonantly excited Rydberg states
To clarify the XUV-FEL and NIR two-color photoelectron signals, the difference image between figures 1(a) and (b) is shown in figure 2(a). The 2D image was normalized to zero over the energy range from 1.7 to 2.5 eV, where one cannot expect any contributions due to the NIR pulses. This two-color feature consists of two parts; the above-mentioned ring with the momentum of 0.28 (in atomic units) and the central part with a peanut shape. The relevant photoelectron spectrum is shown in figure 2(b).
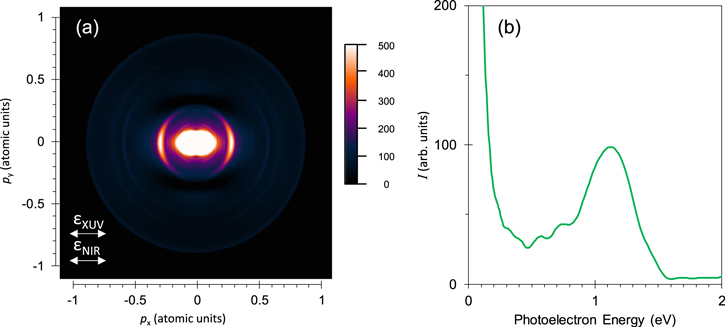
Figure 2. Difference signals between figure 1(b), XUV + NIR and figure 1(a), XUV only. (a); photoelectron momentum image and (b); corresponding photoelectron spectrum.
Download figure:
Standard image High-resolution image3.1.1. Ionization and sequential excitation by XUV-FEL
Figure 3 shows the energy levels of a neutral CS2 molecule, singly charged  and doubly charged
  molecular ions. With the help of this energy diagram, we suggest the following sequential channels as the most probable processes induced by the XUV-FEL (ωH = 20.9 eV). In the first step, the ionization of the 2πg valence orbital occurs,

Then, in the second step, the excitation of the 5σu valence orbital of the  into the n Rydberg states by the XUV-FEL sequentially occurs,


In the photoexcitation processes expressed by Reactions (2a) and (2b), we suppose that the most probable Rydberg series are nsσg and ndπg, on the analogy of the excitation of the 1σu of a CO2 molecule into the n Rydberg states [17]. Moreover, the nsσg Rydberg series is much stronger than the ndπg in [17], so that we mainly focus our discussions on the nsσg hereafter, unless otherwise stated. Since the ionization potential of a CS2 molecule is 10.1 eV [18], the Rydberg state energies of the  induced by the two XUV-FEL photons are located around 31.0 eV = 10.1 eV + 20.9 eV from the ground state of the CS2, which corresponds to the energy region just below the double ionization thresholds of
  (3Πu), 31.6 eV and
  (1Πu), 32.3 eV [19], see figure 3.

Figure 3. Energy level diagram of CS2,  and
and  (a) and blowup of it (b).
Download figure:
Standard image High-resolution imageTo evaluate the range of the photoexcited Rydberg states, we take the pragmatic view that a Rydberg state is one which follows the Rydberg formula in atomic units;

where En is the energy of the nth level, IP the ionization potential of the initial state, Z the effective charge, n the principal quantum number of the level considered, and  the quantum defect for the azimuthal quantum number
  [20]. Referring to the quantum defects
  and
and  for a neutral CS2 [21] and the energies of
  3Πu and
  1Πu [19], we obtain from the Rydberg formula of equation (3) that the n takes values from 10 to 16 for the nsσg series converging to the 3Πu limit and from 8 to 9 for those to the 1Πu limit.
3.1.2. Excitation cross sections into the n Rydberg states
In order to pursue our study of photoabsorption processes to the higher Rydberg states, we make the following simulations. If the oscillator strength  varies monotonically for large n, it can be regarded as a smooth function of n,
  Whereas, differentiating equation (3), we obtain

Thus, we can write

On the other hand, if the wave functions of the higher-lying Rydberg states are approximated as hydrogenic wave functions, then it follows that  [22]. Combining these expressions, we can reach the simplest result that the oscillator strength distribution, df/dE, is constant over the excitation photon energy of E for large
  [23].
[23].
The energy separations between adjacent levels of the higher-lying Rydberg states are smaller than the bandwidth 0.5 eV (FWHM) of the XUV-FEL. Therefore, a band of the n Rydberg states within the bandwidth are excited simultaneously. Both this and the constant oscillator strength distribution lead to the straightforward prediction that the population distribution  of the n Rydberg states is directly reflected by the spectrum distribution
  of the XUV-FEL pulse;

3.1.3. Photoemission from the n Rydberg states
As the third step, we consider the photoemission from the n Rydberg states of  by the NIR laser (ωL). They are expressed by


with Reaction (7a) being the most dominant processes, as mentioned above. The photoionization cross section  of the n Rydberg state for large n takes the following form within the semiclassical approximation [22, 24];

where  is the binding energy of the n Rydberg state,
  is the cross section at the threshold photon energy of
  and is dependent on the charge of the ionic core Z. Since we are considering the Rydberg states of the
  ions, we choose Z = 2 in this case. The cross sections for the n Rydberg states of hydrogenic ions with Z = 2 as a function of photon energy are calculated using equation (8) and depicted in figure 4(a). Under a fixed photon energy, the cross section
  reduces to
  because
  and
and  [24–26]. This n-dependent cross section can be seen along the vertical line at ωL in figure 4(a).
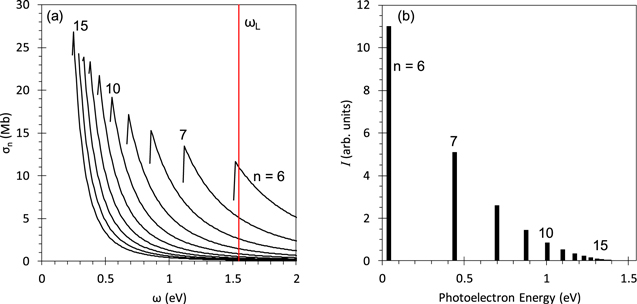
Figure 4. Photoionization cross sections of the n Rydberg states with Z = 2 as a function of photon energy (a) and photoelectron spectrum from the n Rydberg states at ω = 1.56 eV (b).
Download figure:
Standard image High-resolution imagePhotoelectron spectra are usually measured as a function of photoelectron energy with the fixed photon energy. Hence, it is convenient that  is transformed to the function of the energy
  of photoelectrons emitted from the n Rydberg state,
  Along this line, we can get the following equation,

where  is a constant having the dimension of a cross section. The photoelectron spectrum for the n Rydberg states at
  is simulated by equation (9) and depicted in figure 4(b).
3.1.4. Comparison between the experimental photoelectron spectrum and the present simulation
In the above discussions, we have introduced the expressions for a population distribution of the n Rydberg states,  in equation (6), and their photoionization cross sections of them,
  in equation (9). As depicted in figure 5, combining these expressions, an analytical form of the photoelectron spectrum for each n Rydberg state, which was measured by the XUV-FEL pump and NIR laser probe experiment, is obtained;

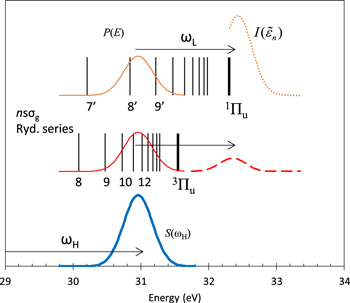
Figure 5. The spectrum S(ωH) of XUV laser (thick curve), population distributions P(E) of the Rydberg states (thin curves), and photoelectron spectra  (dotted and dashed curves). See text for details.
Download figure:
Standard image High-resolution imageThen, let us apply equation (10) to the present case of CS2. In our experimental conditions, the double ionization thresholds 3Πu and 1Πu of CS2 are accessible via the XUV-FEL two-photon sequential ionization/excitation and probe NIR laser ionization. Therefore, the two nsσg Rydberg series converging to 3Πu and 1Πu are the intermediate states of the present pomp-probe processes. Adopting the XUV-FEL central photon energy of 20.9 eV with the bandwidth of 0.5 eV and the NIR photon energy of 1.56 eV, the ionization energy 10.1 eV into the ground state 2Πg of  [18], and the double ionization energy 31.6 eV and 32.3 eV into the 3Πu and 1Πu states of
  [19], respectively, we finally obtain the simulated photoelectron spectra from the two nsσg series, which are shown in figure 6 by the vertical bars. Here, we assumed that excitation probability into the two nsσg Rydberg series converging to the 3Πu and 1Πu limits are the same. In the figure, the simulation results overall reproduce the experimental spectrum though there are some discrepancies in the energy. The discrepancies in the energy might be due to spectral fluctuations of the XUV-FEL (∼0.3 eV), nonlinearity in the low velocity region of our VMI (∼0.4 eV), and uncertainties of the double ionization thresholds (∼0.3 eV). In fact, one can see better agreement between the experiment and simulation by shifting the experimental spectrum into the lower energy side.
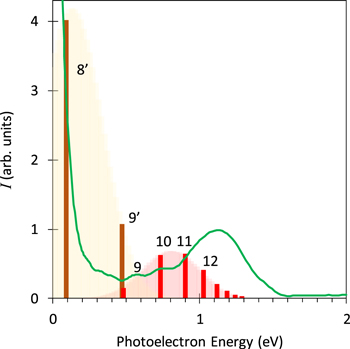
Figure 6. The simulated and experimental photoelectron spectra. Vertical bars with numbers represent the energy positions and their principal quantum numbers of the e nsσg Rydberg series. Numbers with prime stands for the Rydberg states converging to the 1Πu state and numbers without prime the Rydberg states converging to the 3Πu state. The solid curve represents the experimental spectrum, the same as shown in figure 2(b).
Download figure:
Standard image High-resolution imageThe overall agreement between the experimental and the calculated spectra implies that the outer ring component with the energies around 1.1 eV in figure 2 originates essentially from photoionization of the nsσg Rydberg states with principal quantum numbers n = 10–16 belonging to the 3Πu dicationic state, and the low energy component with the energies of ∼0.1 eV corresponds to that of nsσg states with n = 8 belonging to the 1Πu state and that with a small additional component with n = 9.
3.2. PAD from resonantly excited Rydberg states
The PADs from the valence orbitals of 2πg, 2πu, and 5σu of the randomly oriented CS2 molecules in space were mentioned in section 2. In contrast to this, it should be noted that the PADs from the n Rydberg states are related with the passively aligned  molecular ions.
3.2.1. Alignment of  molecular ions excited in the n Rydberg states

As can be seen in Reaction (2a), the nsσg Rydberg states of the  ions are due to the 5σu → nsσg transition induced by the linearly polarized XUV-FEL. Similarly, the ndπg Rydberg states of the
  ions are due to the 5σu → ndπg transition, see Reaction (2b). In the former, the axis distribution of the ensemble of the
  molecular ions is expressed by
  where
where  is the angle between the molecular axis and the polarization vector of the XUV-FEL and
  the 2nd Legendre polynomial, because the nsσg Rydberg states are excited by the σu → σg parallel transitions [27]. In the latter, the axis distribution of the ensemble is expressed by
  because the ndπg Rydberg states are excited by the σu → πg perpendicular transitions. In the present pump-probe experiments, the time-delay is zero within the timing jitter between the pump and the probe laser pulses, and the pulse width of the probe NIR laser is 490 fs. Since these time scales are much shorter than the rotational period of CS2 molecules (153 ps) [28], we ignore the time evolution of the rotational wave packets after the resonance excitation of the n Rydberg states in the following discussion.
3.2.2. PAD from passively aligned molecules
The laboratory frame PAD (LF-PAD) from the aligned molecules is expressed as a convolution of the molecular frame PAD (MF-PAD) with the laboratory frame molecular axis distribution expressed by an expansion in polarization moments [29]. Taking both the polarization vector of the XUV-FEL along the LF z-axis and cylindrical symmetry of the  molecular ions into account, such LF-PAD may be expressed by,
where the dynamical parameter  is described by relevant dipole matrix elements [30], L the vector sum of the angular momenta of photoelectron partial waves in the MF,
  the vector sum of photon angular momentum,
  the axis polarization moment, and
  the angle between the photoelectron momentum and the LF z-axis. Under the present experimental conditions,
  and
and 
 (for parallel transitions) or
  (for perpendicular transitions). Thus, after the summation over
  and K, the LF-PAD formula of equation (8) is simply re-written by

The limitation of L in equation (12) comes from the non-zero condition  of the Clebsch–Gordan coefficients in equation (11).
In figure 7, the polar plot of the LF-PAD from the n Rydberg states is shown together with the fitted curve of equation (12). Although the fitted curve reproduces the experimental LF-PAD well, one cannot distinguish the Reactions (7a) and (7b) with the present analytical procedure. The reason of this is that the applicable LF-PAD formula, i.e. Equation (12), is common for the two different reactions. However, if one applies the present approach to an isolated resonance state, one may be able to derive interesting parameters on photoionization dynamics, i.e., amplitudes of the dipole matrix elements and their phase shifts, from the experimental data with the help of the analyses using equation (12).

Figure 7. Photoelectron angular distribution from the n Rydberg states. Open circles; electron intensities in the range of 1.0–1.1 eV and solid curve; fitted curve of equation (12). The coefficients BL of it are written in the figure. The polarization vector of both XUV and NIR pulses are shown by arrows.
Download figure:
Standard image High-resolution image
4. Summary and outlook
We succeeded in observing the photoelectrons from a band of the highly excited Rydberg states of  by means of the XUV-FEL pump and NIR laser probe experiments. The observe photoelectron spectrum was explained overall by our hydrogenic Rydberg orbital model. This promising result necessarily leads to the following perspective.
Highly excited molecular ions exhibit quite rich dynamics; they are either just stable or undergo dissociations as well as competing autoionizations [20] into a large number of different exit channels. Further complication arises from the fact that a typical time scale for the electronic motions in highly excited Rydberg orbitals could be so slow that it could become comparable to that of nuclear motions. The presumptions for the Born–Oppenheimer approximation no longer apply here so that fully coupled motions of electronic and nuclear degrees of freedom are expected to emerge in such cases [20, 31]. In spite of such interesting features, the spectroscopic data on molecular ions have been quite scarce due to their experimental difficulty, as mentioned in the introduction. Vibrational-level resolved high-resolution photoelectron spectroscopies on excited states of molecular ions would provide vital information on the stability and the rich dynamics for such systems. The present scheme of two-color photoelectron spectroscopy using an intense and ultrashort pulse of XUV laser in combination with a synchronized NIR laser pulse is readily applicable to a variety of states of various molecular ions. Although the present study was limited to the fixed time-delay between the XUV pump and the NIR probe pulses, the experimental scheme is naturally extendable to the time-dependent measurements. By using a highly coherent XUV-FEL pump pulse (such high coherence would be realized by a seeding technique), the real-time observation of electronic-vibrational wavepacket dynamics will be also possible for highly excited Rydberg states of molecular ions (on neutral molecules, for example, [32–35]).
Acknowledgments
The authors appreciate useful discussions with Professor S Yabushita (Keio University) and Professor J Itatani (The University of Tokyo). They thank the operation and engineering staff members of SACLA for their support in performing the XFEL experiments, which were conducted at the BL1 of SACLA with the approval of the Japan Synchrotron Radiation Research Institute (JASRI) (Proposal Nos. 2016B8002 and 2017A8013). This work is financially supported from JSPS KAKENHI Grant numbers 16H02132 and 16K05496. KK and WK are financially supported by the Advanced Leading Graduate Course for Photon Science (ALPS) of MEXT, Japan.