
Abstract
A review of the vibration energy harvesting literature has been undertaken with the goal of establishing scaling laws for experimentally demonstrated harvesting devices based on electromagnetic transduction. Power density metrics are examined with respect to scaling length, mass, frequency and drive acceleration. Continuous improvements in demonstrated power density of harvesting devices over the past decade are noted. Scaling laws are developed from observations that appear to suggest an upper limit to the power density achievable with current harvesting techniques.
Export citation and abstract BibTeX RIS

Content from this work may be used under the terms of the Creative Commons Attribution 3.0 licence. Any further distribution of this work must maintain attribution to the author(s) and the title of the work, journal citation and DOI.
1. Introduction
This paper is an extension of work previously reported by the authors [1], which aims to explore the upper limits of the observed scaling behaviour of demonstrated electromagnetic (EM) vibration energy harvesting devices [2]. Data is sourced from prototypes as reported in the literature and also commercially available devices where sufficient information is available. A prominent bibliographic database reports that over 460 refereed articles have been published in the area of vibration energy harvesting during the period 2004–2014 [3]. A restricted subset of that literature is examined in this paper, in particular those concerned with oscillatory/resonant EM vibration energy harvesting where devices are based on the relative movement between permanent magnets and wire-wound or micro-fabricated coil transducers.
Predictions of the theoretical power limits for a linear resonant EM harvester are given in the literature, for example [2, 4, 5],


where Pe is the power in the electrical domain produced by a harvester, Pload av max is the average power available in an electrical load, with proof mass m, resonant frequency ωr, open circuit mechanical quality QOC, driven by a host acceleration a0 of frequency ω, host displacement Y, proof mass maximum displacement ZMAX. RL and RC are the load and coil resistances respectively with RL = RC + K2/cm, where K is the electromechanical coupling coefficient and cm is the mechanical damping coefficient. Equations ((1)(a)–(c)) assume that the harvesting device is sufficiently large so that proof mass m can 'ring-up' to steady-state displacement amplitude which is approximately determined by QOC. Limiting the range of motion of the proof mass, for example by constraining the motion to be within the harvester casing, may limit the power harvested [6] and introduce nonlinear processes due to impacts between the proof mass and the casing [7].
There have been a number of comprehensive review articles detailing the EM harvesting literature, for example the 2013 work by Cepnik et al [8], and the 2007 review by Arnold [9]. Using equations reported by Stephen [5], Arnold developed scaling laws for oscillatory EM harvesters of the form;

and

where P is the output power from the harvester (into an electrical load), L = V1/3 is the scaling length with V the 'active volume' of the device (defined in section 1.1 below). Equations (2a) and (2b) clearly show the general effect of size on an EM harvesting device, that is the output power achievable reduces rapidly as the device is scaled down. The cause of this reduction due to scaling is two-fold: (i) the mechanical energy available decreases as the mass and velocity of the proof mass decreases, and (ii) the transduction efficiency of mechanical energy into the electrical domain is reduced by issues such as the resistance of fine wires, capacitive coupling between the turns in a coil and also magnetic fringing effects. O'Donnell et al [10] elucidated these scaling effects for one specific EM harvester design, and concluded that the electrical output power of the design will scale as;

Based on equation (1b), Mitcheson et al [4]. predicted a scaling law similar to that presented in equation (3).
Extrapolating from Faraday's Law, Marin et al [11] defined an 'effective material dimension' and suggested that the output power of EM harvesters scales as;

Assuming that the electrical damping due to the effect of EM energy harvesting behaves much like a visco-elastic damper, and hence that the electrical damping power is PE = ½ μE v2 where μE is the electrical damping coefficient and v is the velocity of the proof mass, Moss et al [12] showed that;

where fr is the resonant frequency (in Hz) of the proof mass and k is a constant of proportionality.
Rearranging (5) introduces the volume power density, PD = P/L3, of a vibration energy harvester which is an often used metric for comparing devices [13]. For EM harvesting devices relying on oscillatory translational motion alone, the maximum PD < 0.1 W cm−3. From an engineering design point of view, and as suggested by equations (2) and (5), it may be more useful to normalize PD with respect to resonant frequency or host acceleration. Also, as suggested by equations (2)–(5), the scaling law predictions for the output power of EM harvesting devices are dependent on the assumptions made.
Approaching the scaling issue from another direction, this paper will explore the scaling behaviour of demonstrated EM vibration energy harvesting devices with respect to power density PD, with consideration for the effect of resonant frequency and host acceleration.
1.1. Approach
The appendix contains device data collated from the EM vibration energy harvesting literature [14–82]. The data is graphically presented and analyzed in the proceeding sections of this paper. Host accelerations a0 (unit m s−2) found in the literature are converted to g's, where 1 g = 9.8 m s−2. For clarity, the redefined host accelerations use the variable γ (units g). For micro-devices, 'active volume' is generally taken as the volume supplied in the literature. For larger devices, 'active volume' is typically the estimated volume of a harvesting devices spring (or beam), magnets, coils, proof mass, and the volume swept by the proof mass at resonance.
Due to the nature of many EM harvester designs, the output voltage across an attached electrical load may not be purely sinusoidal (even if the input acceleration is sinusoidal). To accommodate this, many researchers in the area report 'peak' or 'maximum' output power (and voltage) produced by their harvesting device. Conversely, if root-mean-square (RMS) output power is reported, it is not always apparent that a form factor of 21/2 can be used to convert the RMS power to peak. Following the work of Arnold [9], the data collated in the appendix typically records the largest reported value of output power for a particular device. This may mean that, for example, the RMS output power of one device is being compared with peak output power of other devices. Although this is non-ideal, the goal of this work is to identify the approximate scaling behaviour, and also the upper bounds of power density and related metrics of practical energy harvesting devices. It is the author's contention that if a large enough sample of harvesting literature is examined, with parameters and metrics spanning many orders of magnitude, then approximate scaling behaviour and upper boundaries can be deduced.
To obtain the upper boundaries, a linear fit was made to points considered to be close to the upper boundary (with data plotted on a log-log graph), yielding an equation of the form,

where metric is one of the power metrics investigated, 10a is the constant of proportionality, x corresponds to either the scaling length L or proof mass m, and b is the exponent corresponding to the power law found. For comparative purposes, the predicted behaviour of a hypothetical high performing device (based on the empirically determined upper boundaries) with an active volume of 1 cm3 is explored. To provide an immediate visual indication of the technologies performing near the upper bounds, where permissions could be obtained, a figure from the relevant literature has been included.
2. Results and discussion
This section presents and discusses the approximate scaling behaviour, and also the upper bounds of power density and related metrics for practical harvesting devices. Each log-log plot shown below contains approximately seventy data points. For graphical clarity, only references contributing to the upper boundaries have been added to the plots and are shown within square brackets. As mentioned, for most plots a selection of data points were chosen which best represented the upper boundaries, and from them a line of best fit was calculated. The scaling laws observed, corresponding to the upper boundaries, are discussed in the context of the equations shown earlier and a maximum power equation is described. The increase in demonstrated harvester power density since 1997 is discussed.
The two plots in figure 1 are shown to provide confidence that the aggregate data provided in the appendix can be used to identify sensible scaling behaviours. Figure 1(a) plots the proof mass m versus scaling length L of a device, with the upper bound scaling as m ∝ L2.78, similar to the expected relationship m ∝ L3. The devices near the upper bound achieve a proof mass of ∼6.2 grams per 1 cm3 of active volume. Figure 1(b) plots the resonant frequency of a device fr versus proof mass m. The distribution of points has a gradient that loosely follows the line proportional to m−1/2 (solid line in figure 1(b)) which is the expected scaling behaviour of the resonant frequency.
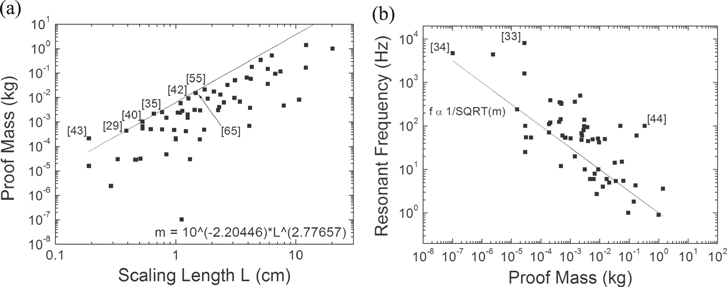
Figure 1. (a) Proof mass m versus scaling length L. (Solid lines correspond to the line of best fit for proof mass upper limit). (b) Resonant frequency fr versus proof mass m. (Solid line ∝ m−1/2).
Download figure:
Standard image High-resolution imageFigure 2 shows the reported output power of harvesting devices as a function of scaling length L and proof mass m. The power values plotted are simply the largest reported by the various authors, and (as discussed above) have not been adjusted for experimental parameters such as frequency and drive acceleration. The upper bound of power shown in figure 2(a) scales as P ∝ L4.3, which is similar to the scaling length dependency suggested by equation (3) (and O'Donnell et al [10]). The four devices shown in figure 2(a), corresponding to the four points on the upper boundary, have quite different geometries and electromechanical arrangements. All four devices appear to be optimized with small gaps between the various device components. The upper boundary found in figure 2(a) suggests a high performing EM harvester with an active volume of 1 cm3 could potentially generate 6.4 mW of peak output power. Figure 2(b) plots output power as a function of proof mass m and indicates P ∝ m0.9, an almost linear dependence which is in agreement with equation (1) where power in the electrical domain is proportional to proof mass m.
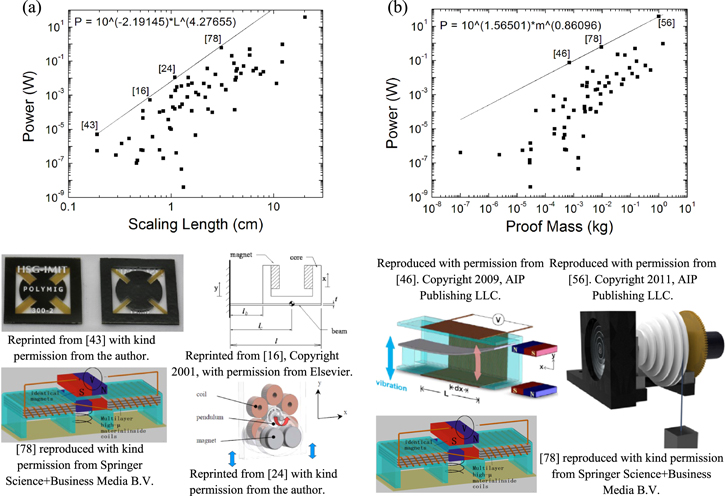
Figure 2. Power versus (a) scaling length L, and (b) proof mass m. (Solid lines correspond to the line of best fit for upper limit of power).
Download figure:
Standard image High-resolution imageAs might be expected, figure 2 shows that, in general, larger sized vibration energy harvesters generate greater output power than smaller devices. In order to make their work more comparable with other literature many authors cite the power density of their harvesting device, which is examined in figure 3. The three devices which form the upper boundary in figure 2(b) produce a notably higher absolute output power per unit of proof mass when compared with other harvesting devices examined in this work, however when normalized for volume only the device described in [78] remains at the upper boundary, as can be seen in figure 3(a).
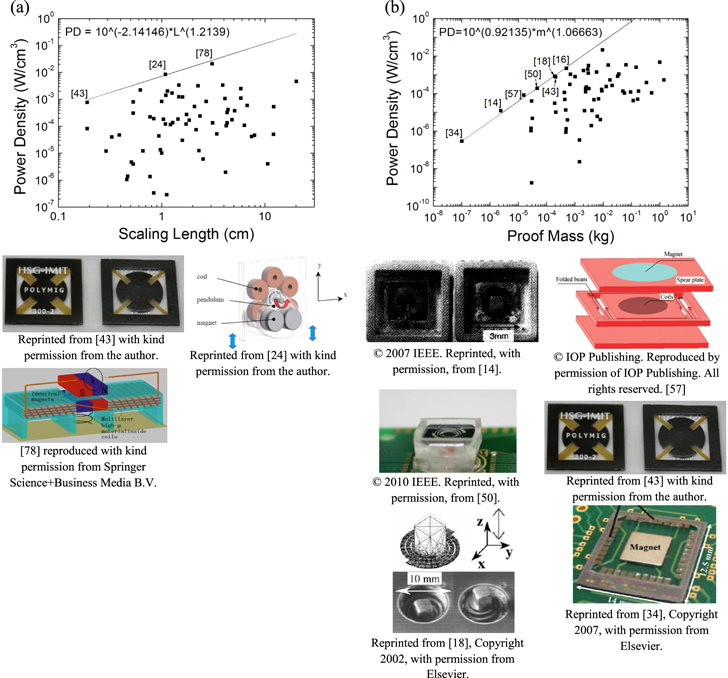
Figure 3. Power density PD versus (a) scaling length L, and (b) proof mass m. (Solid lines correspond to the line of best fit for upper limit of the power density metric).
Download figure:
Standard image High-resolution imageFigure 3(a) also indicates that the observed upper limit of power density PD trends almost linearly with scaling length L. Based on the results shown in figure 2(a), this is as expected, i.e. P/L3 ∝ L. Based on the upper limit shown in figure 3(a), a high performing EM harvester with an active volume of 1 cm3 could potentially generate 7.2 mW of peak output power, similar to the 6.4 mW predicted by the upper boundary found in figure 2(a). Regarding figure 3(b), assuming constant frequency ωr and constant resistances RL and RC, then equation (1c) yields P ∝ m L2, or P/L3 ∝ m/L. Adopting the assumption used by Arnold [9] that R ∝ 1/L, and since the resistance is constant then P/L3 ∝ m, similar to the PD ∝ m1.07 observed in figure 3(b).
The vibration energy harvesting literature often cites a normalized power or power density metric, which allows for a more equitable comparison between different sized harvesting devices. As shown in equations (1a) and (5), power is proportional to the square of acceleration (γ2) or frequency (f2) respectively, so it is natural to normalize power density with respect to these two parameters.
Figures 4(a) and (b) indicate that, for optimized harvesting devices, the power density PD normalized for acceleration squared ( ) is almost independent of scaling length L. Arnold [9] makes the assumption that m ∝ L3 when developing the scaling relationships shown in equation (2). Although L is not solely determined by the proof mass m, by adopting this assumption equation (1a) becomes P/(L3 · γ2) = QOC/(8 ωr) which is constant and in agreement with the constant upper limits shown in figure 4.

Figure 4. Power density PD, normalized with respect to acceleration  , versus (a) scaling length L, and (b) proof mass m. (Solid lines correspond to the line of best fit for upper limit of the power density metric).
Download figure:
Standard image High-resolution imageEquation (5) suggests a constant upper boundary for the power density normalized to resonant frequency squared, indicating a physical limit for the power density achievable with current harvesting techniques. Figure 5(a) shows a clear non-constant upper boundary for the power density normalized to resonant frequency squared. This suggests that one of the assumptions used in [12] to develop equation (5) was flawed, in particular the assumption that the electrical damping coefficient μE ∝ L, which does not appear applicable over a large range of scaling lengths. As mentioned in the introduction, size influences the effectiveness of a vibration energy harvester in a number of ways, which could in turn modify the scaling behaviour of the electrical damping coefficient. When the active volume of a harvester is constrained there is less space for a proof mass to oscillate, decreasing both the physical size of the proof mass and the maximum velocity it can achieve. Also, the coupling factor or transduction efficiency of the device is reduced by issues such as those previously described.
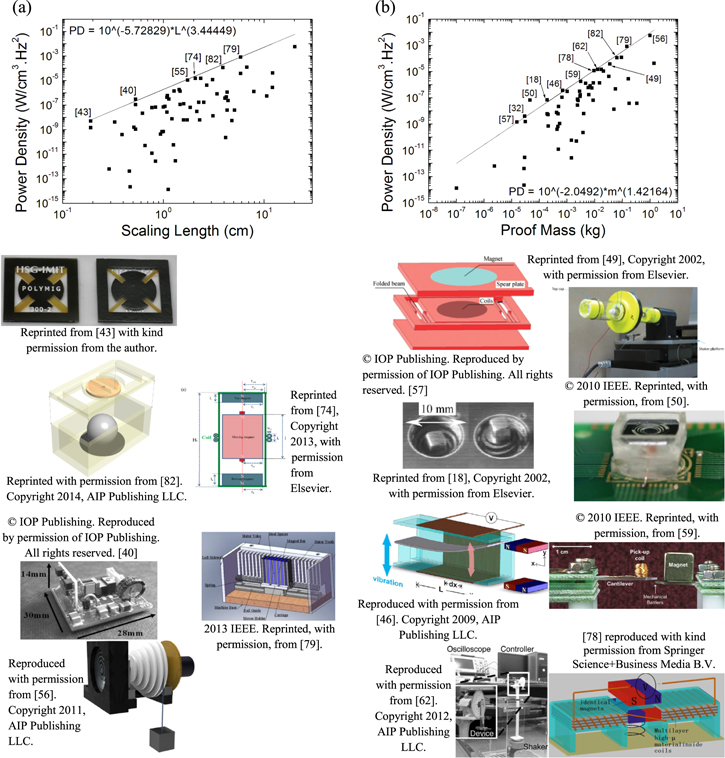
Figure 5. Power density PD, normalized with respect to frequency fr2, versus (a) scaling length L, and (b) proof mass m. (Solid lines correspond to the line of best fit for upper limit of the power density metric).
Download figure:
Standard image High-resolution imageFigure 5(a) suggests that the upper limit for the frequency normalized power density occurs along  , which can be rearranged to give an estimate in watts of the maximum peak power

of a device with active volume V (cm3) and resonant frequency fr (Hz). Equation (7) is a rule of thumb based on empirical observation, that provides an estimate of the maximum peak power that could be expected from an EM harvester with active volume V, oscillating in steady state at frequency fr, and driven by a host acceleration sufficient to ring the proof mass up to its maximum possible resonant displacement (defined by the physical constraints of volume V) so that the harvester is generating it's maximum output power. Equation (7) scales identically to equation (4), suggesting that the relationship developed by Marin et al in [11] is useful for predicting the scaling behaviour of EM vibration energy harvesting devices. Equation (7) can be used in a number of ways. Workers in the field of EM energy harvesting could use equation (7) as a benchmark for comparing output power. Given the specifications of an EM energy harvesting device, equation (7) could be used as a means of developing confidence in the stated output power of the device. If an EM harvester generates power well beyond that predicted by equation (7), then it may indicate that the device performs significantly better than any previously described device. Finally, equation (7) could be used to make an estimate of the minimum device size required for an energy harvesting application with a given power requirement and where the host vibration spectrum was known.
A similar upper boundary is also shown in figure 5(b), suggesting  . Two points above the line in figure 5(b) represent planar-type devices reported in [26] and [50], suggesting planar devices may exhibit a superior power density metric with respect to drive frequency squared.
A commonly used power metric for commercial vibration energy harvesting devices is specific power (e.g. [31]). Figure 6 plots specific power as a function of scaling length L, and proof mass m. Figure 6(a) indicates that specific power scales as SP ∝ L2.6, scaling approximately with the volume of the device. The data presented in figure 6(b) indicates that the upper boundary for specific power scales weakly with proof mass, with SP ∝ m−0.14. The specific power of an EM harvester will generally be dependent on the magnitude of the host acceleration acting on the harvester, however figure 6(b) shows that a range of devices appear to have achieved a maximum peak specific power around 100 W kg−1.
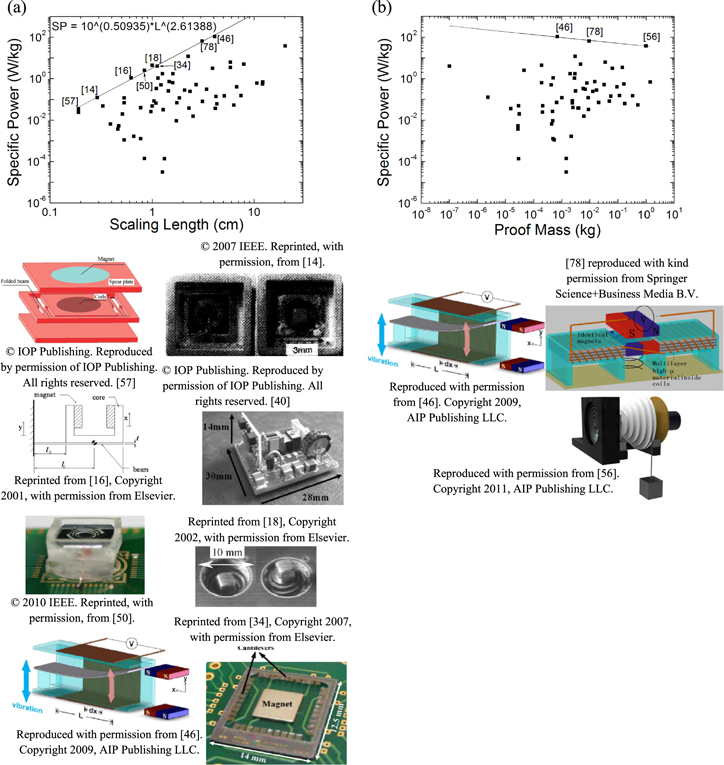
Figure 6. Specific power SP versus (a) scaling length L, and (b) proof mass m. (Solid line corresponds to the line of best fit for upper limit of the power density metric).
Download figure:
Standard image High-resolution imageFigure 7 plots the number of coil turns in a harvesting device as a function of scaling length L, and 7(b) proof mass m. In both cases there is a clear upper boundary to the number of coils achieved. This suggests that there is a practical size limit to the cross section of wire that can be used when manufacturing the coils that are used in practical harvesting devices. For example, the upper limit of figure 7(a) suggests an EM harvester with an active volume of 1 cm3 has a practical limit of around 5500 turns. The outlier point in figure 7(b) corresponding to the device reported in [34] is anomalous in the sense that each small cantilever (as shown) is its own independent harvesting device with ten coil turns.

Figure 7. Coil turns versus (a) scaling length L, and (b) proof mass m. (Solid lines correspond to the line of best fit for upper limit of the power density metric).
Download figure:
Standard image High-resolution imageAs shown in figure 7 there is a clear limit to the number of coil turns achievable in a practical harvesting device, similarly figures 8(a) and (b) show there is a clear limit to the electromotive force (emf) that can be generated across an electrical load by a harvesting device. The upper boundary in figure 8(a) indicates that an EM harvester with an active volume of 1 cm3 could potentially produce an output voltage of ∼7.5 V. For scaling lengths below L ∼ 2 cm figure 8(a) shows a scaling relationship emf ∝ L3.6, above L ∼ 2 cm the load voltage plateaus presumably because a practical level of output voltage has been achieved (e.g. greater than ∼10 V), hence the plateau above L ∼ 2 cm is not considered an upper boundary.
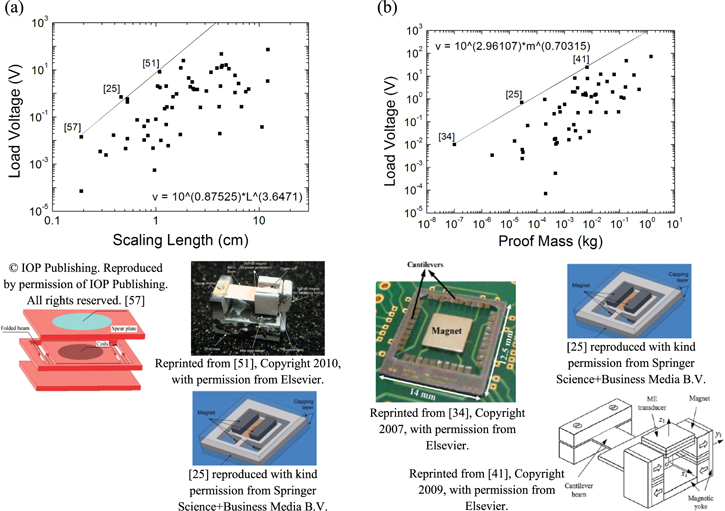
Figure 8. Load voltage versus (a) scaling length L, and (b) proof mass m. (Solid lines correspond to the line of best fit for upper limit of the power density metric).
Download figure:
Standard image High-resolution imageShown in figure 9(a) is resonant frequency fr plotted against scaling length L where the upper boundary of resonant frequency is included (which scales as L−3.7). Interestingly a lower boundary is also present. It seems reasonable to assume that there is a limit to the mass densities and spring constants available for practical harvesting devices, producing an envelope of achievable operational frequencies. The demonstrated EM harvester power density (normalized to both acceleration and frequency squared) between the years 1997–2014 is plotted in figure 9(b), showing a steady improvement over the past decade with a maximum normalized power density of ∼260 mW cm−3 g2 Hz–2.

Figure 9. (a) Resonant frequency fr versus scaling length L, and (b) scaled power density versus year.
Download figure:
Standard image High-resolution image
The scaling laws, with respect to both scaling length L and proof mass m, are summarized in table 1. It is difficult to accurately assess the errors associated with the power laws. Table 1 indicates that the lines of best fit for estimating the upper boundaries have correlation coefficients R near unity, however the experimental errors associated with the original measured data (i.e. as presented in the appendix) are unknown.
Table 1. Scaling laws corresponding to upper power limits for practical EM harvesters (where a and b are defined in equation (6) i.e. metric = 10a xb and N is the number of points used to calculate the relevant fit).
| Figure | 'a' | 'a' Error | 'b' | 'b' Error | Correlation coefficient, R | Standard deviation | N | |
|---|---|---|---|---|---|---|---|---|
| m versus L | 1a | 2.77 657 | 0.03 841 | −2.20 446 | 0.01 839 | 0.99 981 | 0.03 676 | 4 |
| P versus L | 2a | 4.27 655 | 0.23 299 | −2.19 145 | 0.09 343 | 0.99 558 | 0.20 407 | 5 |
| P versus m | 2b | 0.86 096 | 0.2076 | 1.56 501 | 0.04 496 | 0.99 971 | 0.04 698 | 3 |
| PD versus L | 3a | 1.2139 | 0.21 361 | −2.14 146 | 0.09 317 | 0.9704 | 0.18 483 | 4 |
| PD versus m | 3b | 1.06 663 | 0.03 616 | 0.92 135 | 0.18 185 | 0.99 885 | 0.09 645 | 4 |
| PD/g2 versus L | 4a | 0.0568 | 0.04 697 | −0.78 103 | 0.03 853 | 0.77 059 | 0.05 247 | 3 |
| PD/g2 versus m | 4b | 0.04 864 | 0.01 987 | −0.69 372 | 0.05 493 | 0.86 592 | 0.06 636 | 4 |
| PD/f2 versus L | 5a | 1.44 245 | 0.14 659 | −4.13 682 | 0.13 769 | 0.99 488 | 0.07 633 | 3 |
| PD/f2 versus m | 5b | 1.42 164 | 0.04 748 | −2.0 492 | 0.11 753 | 0.99 612 | 0.18 492 | 9 |
| SP versus L | 6a | 2.61 388 | 0.0816 | 0.50 935 | 0.0397 | 0.99 854 | 0.08 869 | 5 |
| N versus L | 7a | 1.57 004 | 0.07 631 | 3.73 671 | 0.04 218 | 0.99 531 | 0.10 262 | 6 |
| N versus m | 7b | 0.55 749 | 0.0032 | 5.31 118 | 0.00 972 | 0.99 998 | 0.01 071 | 3 |
| emf versus L | 8a | 3.6471 | 0.45 614 | 0.87 525 | 0.20 991 | 0.99 227 | 0.24 471 | 3 |
| emf versus m | 8b | 0.70 315 | 0.03 067 | 2.96 107 | 0.15 276 | 0.99 905 | 1.0453 | 3 |
| f versus L upper | 9a | −3.73 843 | 0.24 465 | 4.77 188 | 0.25 811 | 0.99 787 | 0.10 906 | 3 |
| f versus L lower | 9a | −1.78 155 | 0.0594 | 1.17 333 | 0.02 409 | 0.99 613 | 0.07 163 | 9 |
3. Conclusion
A review of the vibration energy harvesting literature has been undertaken, and scaling laws have been established for the upper limit of power density and associated metrics for experimentally demonstrated electromagnetic (EM) vibration harvesting devices. Power density metrics have been examined with respect to scaling length, volume, frequency and drive acceleration. An increasing trend in demonstrated power density for EM harvesting devices over the past decade is noted. The observed scaling laws, in particular those for power density normalized with respect to resonant frequency squared (W cm−3 Hz2), appear to suggest an upper limit to the power density achievable with current harvesting techniques. This upper limit allows an estimate of the maximum (peak) power to be made,

for a device with volume V (cm3) and resonant frequency fr (Hz). This equation assumes that the host acceleration is sufficient to ring the proof mass up to the maximum possible displacement, approximately L = V1/3, the scaling length of the device.
Acknowledgments
Scott Moss would like to acknowledge the support of the DSTO Fellowship program. Owen Payne and Genevieve Hart would like to acknowledge the support of the DSTO IEP program. The authors would like to thank the reviewers for valuable comments.
: Appendix
As discussed in section 1.1 of the main text, this appendix contains tabulated (tables A1 and A2) specification data from a wide range of reported harvesting devices. The 'green' cells are lifted directly from the literature and considered more reliable values, the 'pink' cells are considered less reliable since they are interpolated or calculated from ambiguous data (such as measurements taken from photographs ). White cells contain results calculated using other data. For some devices certain parameters could not be found or deduced, hence a number of cells are empty.
Table A1. Specification data for demonstrated vibration energy harvesting devices.
|
Table A2. Power information for demonstrated vibration energy harvesting devices.
|