Abstract
This paper reports the design of an electromagnetic vibration energy harvesting system that provides high power density and broad bandwidth. The 'double cell' harvester was chosen as the generator for this system. In order to harvest power over a broad range of frequencies, four 'double cell' harvesters with varying resonances were incorporated in the system architecture. The average AC to regulated DC power conversion efficiency across the 4 Hz bandwidth was 78%, which is one of the highest reported magnitudes for an electromagnetic vibration harvesting system. The magnetic flux density variation within the double cell array was modeled using the finite element method and compared to a single cell with equivalent tip mass and magnet volume. The double cell array was found to generate a similar magnitude of power to a single cell but three times higher bandwidth. The average generator conversion efficiency for the double cell array was 45.3%, which approaches the maximum theoretical limit of 50%.
1. Introduction
The demand for implementation of condition based health monitoring systems for railcar components such as bearing and wheel condition is growing due to expansion occurring in the railroad industry [1]. Government imposed regulations on railroad safety could lead to implementation of RFID and GPS tracking systems on rail cars [2]. Implementation of wireless sensor networks provides an efficient method for meeting the safety and security needs of the modern railroad. In past decade, there has been significant focus on the development of power sources for these futuristic wireless sensor networks as battery will become a limiting factor in their implementation. Out of the various choices for power generation, vibration energy harvesters have emerged as one of the promising candidates [3–38]. This is indicated by the rapid increase in the number of publication on this topic in last seven years as shown in figure 1.

Figure 1. Number of publications per year focusing on 'vibration energy harvesting'. Search was conducted on the INSPEC database.
Download figure:
Standard image High-resolution imageIn a previous study, it has been shown that for the vibration energy harvesters exceeding the volume of 0.5 cm3, electromagnetic mechanism provides the highest power density as compared to other mechanisms such as piezoelectric, magnetoelectric, dielectric elastomers and electrets [3]. Electromagnetic vibration energy harvesting has been thoroughly investigated in literature. El-hami et al have demonstrated a harvester structure that consists of magnets attached to a vibrating beam that creates a magnetic field around the stationary coil attached to a base. As base excitation was applied, the relative motion between the magnets and coil creates a voltage in the coil [4]. Glynne-Jones et al improved the generator by adding an additional pair of magnets that enhanced the coupling between the magnets and coil. The top half of the coil sits between one set and the bottom half of the coil sits between the second set which has reversed polarity. This configuration allows for summation of voltage induced from each set [5]. Poulin et al have described a detailed electromechanical model for both electromagnetic and piezoelectric vibration energy harvesters and suggested that piezoelectric harvesters are more suited for micro-scale applications while electromagnetic for mid-scale applications [6]. O'Donnell et al have investigated the scaling conditions for output power in terms of system parameters such as magnetic field, coil parameters, electromagnetic damping and mechanical damping. The authors suggested that at small scales the matching of mechanical and electrical damping (optimum harvesting condition) is unachievable due to the increase in coil resistance [7]. Stephen has analyzed and derived the relationship for optimal energy harvesting stating that the maximum mechanical to electrical power conversion efficiency for an electromagnetic vibration energy harvester is 0.5 [8]. Taking into account these prior studies, it is evident that at mid-scale electromagnetic mechanism is the most suitable technique for harvesting vibration energy. Further, within the electromagnetic mechanism, four-bar structure shown in figure 2(a) is the most promising architecture for design of harvester.
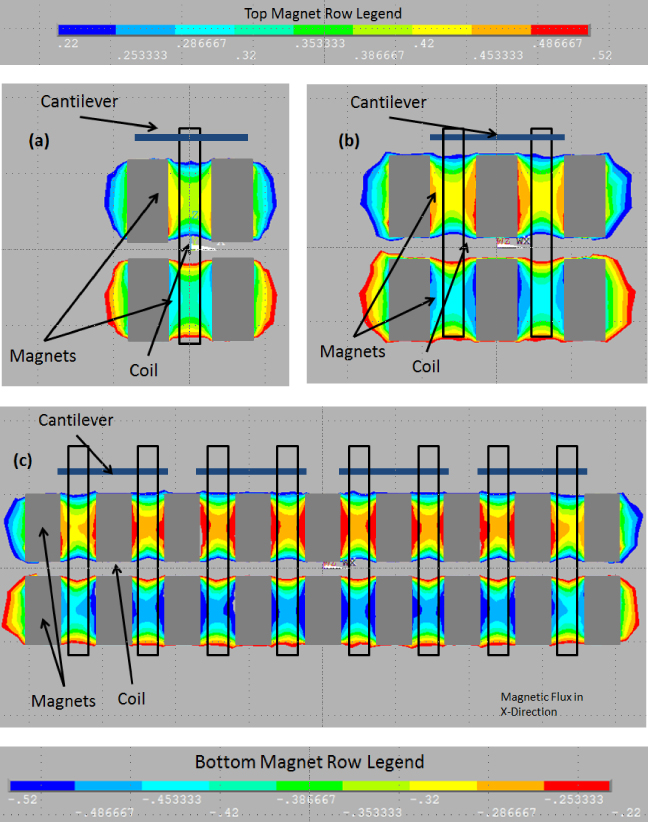
Figure 2. (a) Schematic of four-bar magnet configuration, (b) 'double cell' configuration, (c) configuration developed in this study.
Download figure:
Standard image High-resolution imageMarin et al have recently improved the four-bar design and proposed an architecture that allows arraying of the coils as shown in figure 2(b). This new design is referred as 'double cell' harvester and was shown to generate twice the output power generated by the prior published four-bar magnet geometry while only increasing the volume by 23% and mass by 30%, consequently providing a 27% increase in output power per unit volume and mass [3]. The double cell harvester also eliminates the phase mismatch providing a method for efficiently arraying multiple coils in series connection. Figure 2(c) shows the array configuration to achieve multiplicity of harvesters. Due to its positive attributes, the 'double cell harvester' was chosen as the suitable design for integration with the energy harvesting system proposed in this study.
In order to harvest mechanical energy over broadband of frequencies, we arrayed four cantilevers attached to a common base. Many different techniques to enhance the harvesting bandwidth have been investigated in literature including frequency tuning techniques, nonlinear energy harvesting, and multimodal energy harvesting. Frequency tuning consists of altering the stiffness of the system through compressive loading [28], applying a magnetic force [29], or utilizing piezoelectric materials [30]. Each of these methods require active tuning, therefore energy must be input to the system in order to harvest energy over a broadband of frequencies. The most common nonlinear energy harvester utilizes magnetic levitation [31]. The repulsive force between two magnets provides the nonlinear stiffness that leads to a nonlinear system response enhancing the bandwidth of the harvester. The degree of the nonlinearity and bandwidth enhancement is highly dependent upon the mechanical damping and input acceleration. Multimodal energy harvesting consists of utilizing two different conversion mechanisms or utilizing an array of cantilevers. The advantage of using two conversion mechanisms lies in the inherent optimum operation frequency for each mechanism. The optimum frequency of each mechanism typically are very far apart from each other, therefore limiting the practicality of the harvester [32]. Connecting multiple cantilevers together for achieving broadband performance has been reported in literature, however, limited analysis has been conducted in understanding the role of magnetic flux distribution within the closely packed cells utilizing four-bar mechanism [33, 34]. In fact, this is the first study that provides fundamental information required for arraying of multiple cells such that there is no adverse effect of the stray magnetic field and there is no cross-talk. The basic questions that one can ask is 'what is the effect of magnets in the adjacent compartments on the performance of a given cell?', and 'Is there an difference in optimum magnet–coil spacing, coil shape, and magnet size for the cells that are at the end then that in the middle?'. The FEM simulations and experimental results reported in this paper provide answers to these questions.
While prior research has mainly focused on developing the mechanical and electromechanical aspects of the harvester, extremely limited numbers of studies have been conducted in developing an energy harvesting system that provides design criterion for the mechanical and electrical components needed to power an actual sensor. Torah et al have developed an energy harvesting system that combined a four-bar magnet harvester having total volume of 150 mm3 and a voltage multiplier circuit with a wireless RF linked accelerometer. A demonstration for measuring and transmitting the vibration data on an air conditioner unit and air compressor was conducted. The AC to regulated DC electrical power conversion efficiency was found to be 65% [26]. Yuen et al have developed a system combining a AA-sized vibration harvester with a voltage tripler circuit to power a wireless temperature sensor at a resonance frequency of 70.5 Hz. The AC to regulated DC electrical power conversion efficiency was found to be 48% [27]. Morais et al have demonstrated a DC–DC converter (MAX1674) and a low power battery monitor (MAX6777) to condition and store the power generated from a magnetic levitation based inductive generator operating at off-resonance with a conversion efficiency of 52.4% [35]. Arroyo and Badel used an approach similar to that commonly used for piezoelectric harvesters, synchronous electric charge extraction, and proposed that this method is simpler than impedance matching but provides similar performance. The conversion efficiency for the circuit was measured to be 43% [36]. Maurath et al have compared an adaptive charge pump for dynamic maximum power point tracking with a novel active full wave rectifier design. The active rectifier achieved rectification efficiencies of 90% but lacked the impedance matching capability and therefore the ability to harvest the maximum power for harvester operating with optimum loads different from the sensor impedance. The adaptive charge pump circuit was connected to a harvester achieving 48% conversion efficiency over wide range of load impedances due to the impedance matching capability [37]. In this paper, we present a complete vibration harvesting system that improves upon the performance of all the previously reported harvesters in terms of operation bandwidth and AC to regulated DC electrical power conversion efficiency. In doing so, we believe this study will strengthen the promise of vibration energy harvesting systems towards realization of self-powered devices and increase the interest of commercial entities. This is important for the research community as over a decade of research has to be accompanied by some real transitions.
In order to achieve the highest possible power conversion efficiency, impedance matching circuitry was developed and integrated with the mechanical system. Electromagnetic harvesters optimally operate at a specific load resistance due to the matching of mechanical and electrical damping [18]. Directly connecting a sensor with impedance which is typically lower than the optimum impedance can reduce the efficiency by as much as 70% and therefore it is necessary to modify the effective load impedance. Kong et al have presented an impedance matching circuit for piezoelectric harvester that was modified and expanded here to meet the criterion for electromagnetic harvesting system [38]. The focus of this paper is towards generating output power required to run a typical wireless sensor node consisting of accelerometer and transmitter for structural health monitoring of a high speed rail railcar. The accelerometer chosen for this study was Analog Devices ADXL278 which requires 5 V and 2.2 mA resulting in a power requirement of 11 mW. There could be other low power commercial accelerometers available in the market which can be used, however, our goal was to demonstrate that power levels higher than 10 mW can be achieved from normal vibration conditions. Please note that our harvester was overdesigned to generate excess power at all the operating frequencies. We did this intentionally to accommodate for any random fluctuations occurring in the vibrations.
2. Vibration energy harvester design
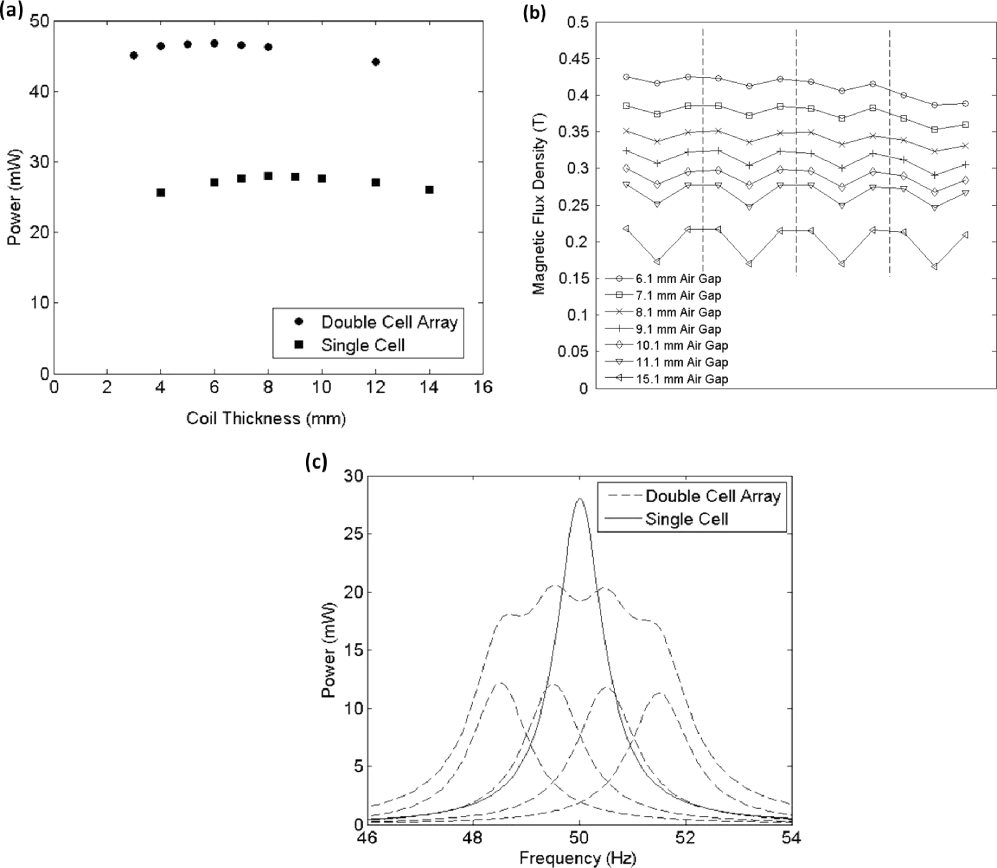
The vibration source frequency, bandwidth, and acceleration level were selected based on the vibration data available from high speed rail lines [39, 40]. The target vibration source frequency, bandwidth, and acceleration level was 50 Hz, 4 Hz, and 0.2 g respectively. The sensor required a continuous power of 11 mW. The arraying of multiple 'double cell' harvesters has been briefly analyzed in a previous study [3] which was expanded to illustrate the advantage in having multiple double cell harvester array as compared to one larger coil and cantilever with equivalent tip mass. Each of the two topologies were optimized and compared by varying the magnet spacing and computing the magnetic flux density using ANSYS FEA software. The magnetic flux density was input to the formulation outlined in the previous study [3] to calculate the output power. The optimization balances the tradeoff between coil volume and magnetic flux density within the air gap. It should be noted that the magnet spacing simulated was 3.1 mm greater than the coil thickness to account for the coil casing and clearance between casing and magnet. Figure 3(a) displays the results of the analysis showing optimum coil thickness of 6 mm per cell for the double cell array and 8 mm for the single cell prototype. Figure 3(b) plots the variation in average magnetic flux density for the right half of the double cell array as the variation was found to be symmetric. The magnetic flux density was averaged at three equidistant planes within each of the four coil regions on the right half of the harvester. The dashed lines on the figure denote the individual cells. The optimization was improved by utilizing the magnetic flux strength difference between the inner and outer air gap which was 0.0075 T for the optimal coil thickness of 6 mm. To utilize increase in magnetic flux density within the inner cells, the air gap and therefore coil thickness was increased by 1–7 mm. The increase in power from having equal inner and outer coil thickness of 6 mm to an inner coil thickness of 7 mm and outer coil thickness of 6 mm was minimal at 0.1%. Using the optimized geometries the comparative analysis between the two designs was conducted by simulating the magnitude of output power as a function of frequency. Figure 3(c) displays the results of the analysis showing that the single cell prototype with tip mass of 552 g generated a higher maximum output power than the combination of the four double cell prototypes each with a tip mass of 138 g. Although in terms of bandwidth, the double cell array outperforms the single cell, generating 17 mW over a bandwidth three times larger than the single cell prototype around 50 Hz. While the tip mass and total magnet volume remain same between the two designs, the double cell array outperforms the single cell due to the enhancement in average magnetic flux density within the inductor resulting from the splitting of the coil into multiple sections. It should be noted that the maximum power shown for the four double cell array prototype in figure 3(a) and (c) does not match because in figure 3(a) all four beams are operating at one frequency for the air gap optimization, while in figure 3(c) they are operating at different frequencies for the bandwidth comparison to single cell.

Figure 3. (a) Power as function of coil thickness for the double cell array and single cell harvester, (b) variation in average magnetic flux density for right half of double cell array (dashed lines separate the individual cells), (c) comparative analysis of a four double cell array with an equivalent single cell having same total tip mass and magnet volume. Magnetic flux units are in Tesla.
Download figure:
Standard image High-resolution imageIn order to meet the high power requirement, the system was designed to produce 30% more power than that required, over the majority of the bandwidth to account for any electrical losses associated with power conditioning. The source acceleration and seismic mass attached to the beam are the key factors controlling the magnitude of the mechanical RMS power available in a vibrating cantilever beam through the relationship [8]:
where m is the seismic mass, a is the source acceleration, ζm is the mechanical damping ratio, and ωn is the source frequency. It is clear from the above relationship that since the source acceleration and frequency were fixed and the damping ratio is fixed parameter determined by the beam geometry and material, the seismic mass needs to be designed to meet the power requirement. While equation (1) shows the general relationship for the system variables that affects the output power, more rigorous simulations involving directly coupled governing equation for the electrical and mechanical systems were used to determine the tip mass [3]. The equation of motion for the cantilever beam system is given as:

where m is the seismic mass, c is the mechanical damping constant, k is the cantilever beam stiffness constant, z is the relative displacement between the coil and magnet, is the base acceleration, and ΦT is the force exerted on the beam from the electrical system. In order to predict the output power, we analyzed the electrical system by applying Kirchoff's voltage law to the electrical circuit associated with the cantilever beam:


where are the resistive loss and voltage drop due to the inductance in the system and ΦT is the transformation factor which models the conversion of mechanical energy to electrical energy. Equations (2) and (3) are coupled and solved together to determine the relationship between voltage and base acceleration. Power is simply calculated as U2/RL.


In order to achieve a 4 Hz bandwidth with 50 Hz center frequency, the four beams were set to four different resonance frequencies, 48.5, 49.5, 50.5 and 51.5 Hz. Figure 4 shows the expected AC electrical power as a function of source vibration frequency using a 138 g tip mass computed using the equation (4) with a load resistance value of 8080 Ω as this was the load optimal magnitude.

Figure 4. Expected output power from the broadband energy harvesting system predicted using equation (4) across load resistance of 8080 Ω.
Download figure:
Standard image High-resolution imageCopper was chosen as the tip mass due to its high density and reasonable cost. A copper tip mass of dimensions 25.4 mm × 25.4 mm × 19.05 mm was attached to each cantilever beam. The combined mass of copper and the coils was measured to be 138 g. With the mass known, the beam was designed to have the required stiffness for resonance to occur at the source frequency of 50 Hz. Finite element analysis was conducted using ANSYS software package to determine the cantilever beam dimensions that can meet the stiffness requirement. Figure 5 shows the cantilever beam geometry and mesh modeled in ANSYS with Solid 186 elements and table 1 displays the material properties for the analysis. Note that the density of coil housing was adjusted to account for the copper wire within the housing. This adjustment was made by measuring the mass and volume of individual coil housing. The boundary condition for the aluminum beam consisted of clamped-free configuration. Based on the available thickness levels of aluminum and limitations on beam length and width due to the magnet length and width, the beam stiffness was designed to achieve a resonance of 60 Hz. It was determined that by increasing the tip mass dimension one could easily bring down the operating frequency to 50 Hz.

Figure 5. Mesh of cantilever beam geometry modeled in ANSYS. The mesh density within the beam element was 1.12 × 10¹⁰ nodes m−3.
Download figure:
Standard image High-resolution imageTable 1. Material properties used in FEA modeling.
| Aluminum (beam) | Copper (tip mass) | ABS plastic (coil housing) | |
|---|---|---|---|
| Density (kg m−3) | 2700 | 8960 | 6979 |
| Elastic modulus (GPa) | 69 | 117 | 232 |
| Poisson ratio | 0.334 | 0.335 | 0.355 |
The final dimensions of the beam derived from the FEM modeling were found to be 24.1 mm × 53 mm × 1.524 mm. The entire harvesting system holds eighteen 2'' × 1/2'' × 1/4'' neodymium–boron magnets in a rigid ABS plastic base as seen from the backside of the harvester in figure 6(a). Two copper coils consisting of 2600 turns of 38 gauge copper wire connected in series were attached to the cantilever beam. At the tip of the cantilever beam was the copper mass whose position can be adjusted to fine tune the resonance frequency of the beam. Figure 6(b) shows the front view of the harvesting system describing the orientation of the beam, coil, and magnets.

Figure 6. Pictures of the fabricated vibration energy harvester. (a) Front view, (b) side view and (c) back view. The total volume and mass of the energy harvesting system was 1179 cm3 and 1.48 kg.
Download figure:
Standard image High-resolution image3. Impedance matching circuit design
In order to extract the maximum electrical power from the vibration harvester, it is necessary to tune the input impedance of the harvesting circuit. The average power transfer can be given by equation (5),
where the source impedance is Rs + jXs, the load (input) impedance is RL + jXL, and Vs is source voltage. From (5), it can be proven that maximum power transfer occurs when Rs = RL and Xs = −XL. Matching reactive (imaginary) terms for this type of converter typically requires a prohibitively large capacitor, complicates rectification, and may not have a great effect on power transfer at rectification. For these reasons, only the resistive (real) term Rs and RL was matched by the converter. By experimentally applying various resistances over the output leads of the harvester it is possible to find the ideal input resistance. The input impedance of each beam was found to be 8.5 kΩ. The output voltage was fixed at 4.8 V DC and the AC voltage input from the harvester has the potential to be above or below 4.8 V, requiring the use of a full wave rectifier and a buck–boost converter shown in figure 7 (capable of stepping up or down), consisting of an inductor (L) two capacitors (Cin and Cout), an NMOS (M) and a diode (D). A PWM was applied to the gate of the NMOS during normal operation. When the gate of the NMOS is high, the current flows from the positive input to the negative input, charging the inductor. When the gate of the NMOS is low the stored inductor current goes from the negative terminal of the battery to the positive terminal until the stored current is empty. The output of the buck–boost converter was fixed using a 4.8 V Ni-MH battery, operating in discontinuous conduction mode (DCM), with typical current and voltage waveforms as shown in figure 8. Figure 8 shows the PWM applied to the gate VGS, the voltage seen across the inductor VL, as well as the current across the inductor due to charging and discharging IL. IL is triangular in shape because near constant voltages are applied across the inductor, and the basic equation that describes an inductor is . Separating IL into current flowing from the input into the output, we can identify Iin and Iout respectively.


Figure 7. Schematic diagram for the buck–boost converter used in this study.
Download figure:
Standard image High-resolution image
Figure 8. Typical waveforms for DCM operation of buck-boost converter.
Download figure:
Standard image High-resolution imageIn order to match the impedance of the EM coils, it is necessary to analyze the input impedance of the converter shown in figure 7. Equation (6) provides the maximum inductor current ILmax. In this expression, L is inductance, D is duty cycle, Ts is switching period, and Vrect is the input voltage to the buck-boost converter. Using equation (6) and waveforms from figure 8, the average input current can be derived as shown in equation (7). Because the input capacitance acts as a low pass filter, this average current acts as a DC current, despite the fact that the real signal is an intermittent current. Rearranging terms from equation (7) gives the input resistance Rin as shown in equation (8).


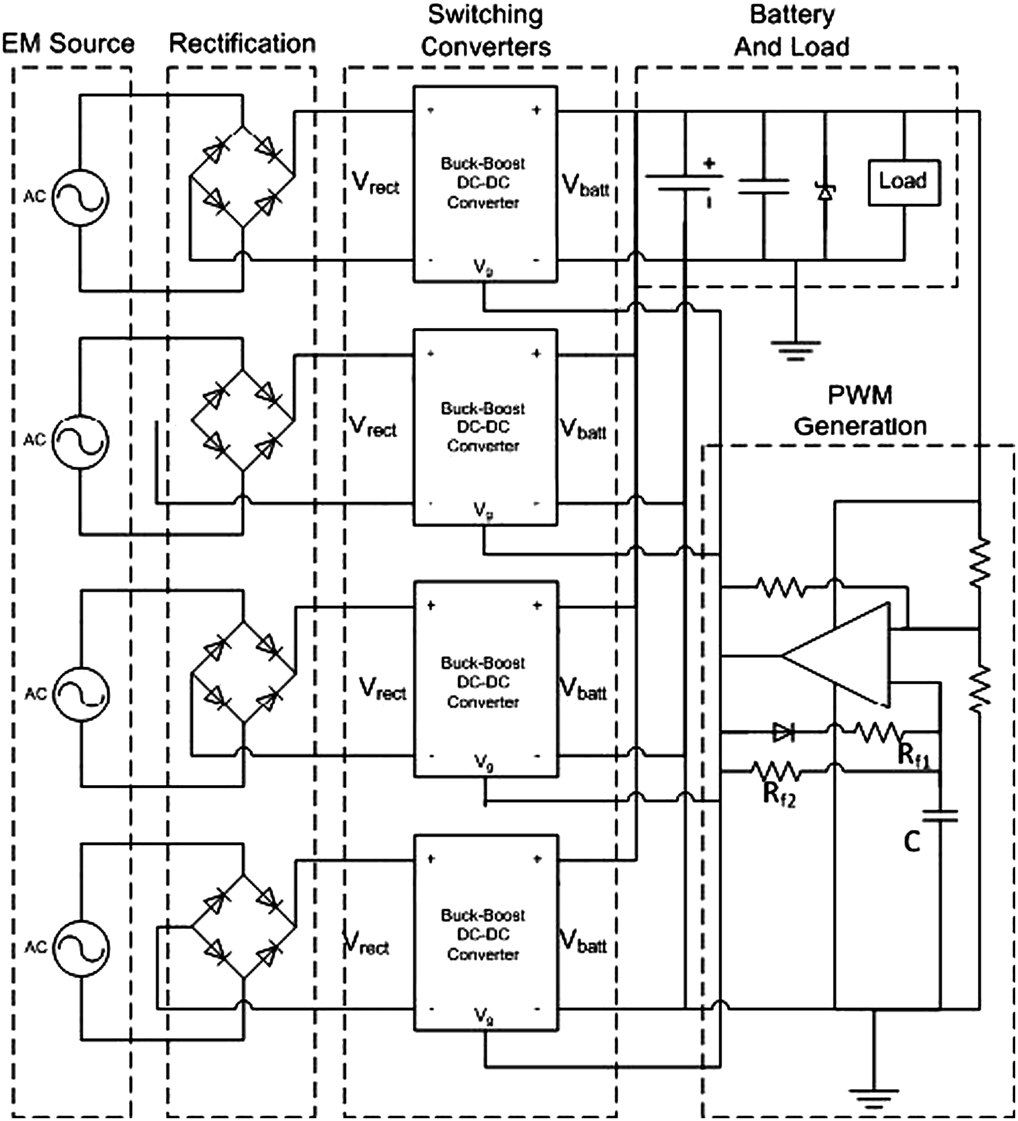
Figure 9 shows the schematic of the circuit and table 2 lists the part numbers of the components used in the circuit. The duty cycle and switching frequency are controlled by a comparator based timing circuit. This timing circuit was chosen because it provides an easily changed pulse width modulation (PWM) with low power consumption. By changing the values of Rf1, Rf2, and capacitor C, it is possible to tune the duty cycle and frequency of the PWM output generated by the comparator to the desired value.

Figure 9. Schematic of impedance matching circuit.
Download figure:
Standard image High-resolution imageTable 2. Components used in circuits shown in figures 7 and 9.
| Component | Part number |
|---|---|
| Rectifier | BAS 3007A |
| MOSFET | NDT3055LCT |
| Schottky diode | B5817WS |
| Inductor | RFB1010-101L |
| Comparator | TLV 3491 |
Equation (9) provides the approximate duty cycle while equation (10) shows the approximate expression for switching period [38]. It should be noted that some tuning based on the experimental observation is typically required to adjust the operating regime.

By design, each of the beams has the same source resistance of 8.5 kΩ, and therefore the same matching resistance. Four switching converters were still required in order to maintain the resonance frequency of each beam, however identical matching resistances allowed for a single PWM to be shared between all the four switching converters. Because the output battery regulates the output voltage, the output current of each buck-boost (and therefore output power) was added without any extra circuitry. Sharing the PWM and control circuitry reduces the power consumption from control by nearly a factor of four, when compared to separate control for each converter. Because the MOSFETs have relatively low gate capacitance, and the switching frequency is low, the comparator is capable of driving all four gates without a gate driver. Using this method, all four switching converters were driven with only 0.45 mW of static power consumption.
4. Experimental results and discussion
4.1. Mechanical system performance
The experimental characterization system is shown in figure 10. The base of the energy harvesting system was mounted on the arm of an electrodynamic shaker (Acoustic Power Systems 113). Acceleration was measured at the base of the energy harvesting system using accelerometer (Piezotronics Inc.). The output signal from the accelerometer was conditioned using a signal conditioner (Piezotronics Inc. Model 482A16). The cantilever beam tip velocity was measured using a digital vibrometer (Polytec PDV 100). Spectral Dynamics Siglab controlled with a MATLAB graphical user interface was used to generate input signals to the electrodynamic shaker to create vibration and also to capture and analyze the output signals from accelerometer and vibrometer. Voltage generated by the harvester was measured by placing various load resistances in series with the coil(s) (Variable Resistance Box Model iET OS-260). The RMS voltage was measured by using a digital multimeter.

Figure 10. Experimental setup used for characterization of harvester performance.
Download figure:
Standard image High-resolution imageFigure 11(a) shows the AC power for each beam as a function of load resistance with an optimum load resistance of 8.5 kΩ. Figure 11(b) shows the AC power for each beam as a function of frequency at the optimum load resistance. The largest difference was between beam 3 and beam 1, where beam 3 was twice as powerful as beam 1. The discrepancy between power levels can be explained through measurement of mechanical damping ratio of each beam. The mechanical damping ratio used for each beam for determining the expected power in figure 4 was 0.008 25. This value was taken from the mechanical damping ratio determined in a previous study for similar beam geometry [3]. In order to determine the mechanical damping ratio an experimental transfer function between beam tip velocity and base acceleration was generated for each beam by using 30–70 Hz sinusoidal sweep at 0.2 G base acceleration. The experimental transfer function between the acceleration at the harvester base Y(s) and the relative velocity between the beam tip and the harvester base X(s) for each beam was fitted using a 2 pole 1 zero curve fit as given by the expression below:
From the analytical transfer function the damping ratio can be calculated by following the method described in detail elsewhere [3]. Table 3 lists the damping ratio of each beam as well as the damping ratio for the beam in the prior study. Also listed in table 3 is the transformation factor, which couples the mechanical energy to electrical energy as shown in equation (4). The slight differences in transformation factor between the four beams can be attributed to the difference in number of windings due to limitations in manufacturing of the coils. The transformation factor for each of the four beams is higher than the previous prototype due to an increase in number of the coil turns from ∼2400 to ∼2600.

Figure 11. (a) Power versus load resistance, and (b) power versus frequency at the optimum load.
Download figure:
Standard image High-resolution imageTable 3. Mechanical damping ratio for each beam.
| Beam # | Mechanical damping ratio (ζm) | Transformation factor (ΦT) T*m |
|---|---|---|
| Beam 1 | 0.011 03 | 22.47 |
| Beam 2 | 0.006 828 | 22.96 |
| Beam 3 | 0.006 84 | 22.6 |
| Beam 4 | 0.009 291 | 23.08 |
| Prior study | 0.008 25 | 19.4 |
Applying the damping ratios and transformation factors, along with the other parameters specified in the design section earlier to equation (4), we can compare the predictions with the experimental measurements. Figure 12 displays the results of the simulation with experimentally determined parameters. Comparing the experimental result shown in figure 11(b) with the simulation result shown in figure 12, it can be found that the model predicts the voltage output with an average error of 6.2%. This confirms that the analytical model for double cell harvester can be used with reasonable accuracy for design of the system assuming that the beams of similar damping ratios can be constructed.

Figure 12. Simulated power output with corrected experimentally measured damping ratio.
Download figure:
Standard image High-resolution imageThe mechanical to electrical power conversion efficiencies were calculated and are shown in table 4. The theoretical mechanical RMS power was calculated based on equation (1). The electrical RMS was measured by applying the optimum load resistance to each beam. It should be noted here that the maximum power conversion efficiency achievable for a vibration generator is 0.5 [8, 41]. In table 4 there is one efficiency value which is above 0.5 which can be attributed to overestimation of the mechanical damping ratio. Alternatively, the power conversion efficiency can be calculated from the ratio between the coil resistance and load resistance as shown below in equation (12) [8]. Error in this calculation can come from the coarseness of the resistance sweep. From the analysis, it is clear that efficiency of the beam lies between 0.45 and 0.5.
Table 4. Generator efficiency.
| Theoretical mechanical RMS power (mW) | Electrical RMS AC power harvested (mW) | Generator conversion efficiency (electrical/mechanical) | Coil resistance (Rs) | Load resistance (RL) | Generator conversion efficiency (0.5(1 − Rs/RL)) | |
|---|---|---|---|---|---|---|
| Prior study | 38.6 | 19 | 0.492 | 748 | 8 080 | 0.454 |
| Beam 1 | 19.9 | 9.86 | 0.495 | 786 | 10 000 | 0.461 |
| Beam 2 | 31.35 | 14.82 | 0.472 | 803 | 8 000 | 0.450 |
| Beam 3 | 30.2 | 18.86 | 0.596 | 790 | 8 000 | 0.451 |
| Beam 4 | 23.3 | 11.28 | 0.484 | 807 | 8 000 | 0.450 |
4.2. Electrical system performance
To evaluate the performance of the electrical system the circuit was initially characterized separately from the mechanical system. There are three primary sources of loss in the electrical system: control losses, rectification losses, and conduction losses. Conduction losses are due to the resistive losses in the buck-boost converter owing to diode voltage drop, MOSFET resistance, and switching losses. Conduction losses are roughly 10% regardless of the input power and are the major source of loss when the converter is harvesting from the intended energy source. Rectification losses are due to power loss across the full wave rectifier before the buck-boost converter. Because this is essentially a constant voltage drop, the per cent loss decreases as the AC input voltage increases. During operation, this loss can vary from 4% to 8%, and typically accounts for less loss at higher input power. Control losses are due to the low power oscillator and the power required for charging and discharging the MOSFET capacitance. Control losses account for a constant 0.45 mW drop during operation. When the system is harvesting the expected amount of power, this loss is less than 1%. However, due to the fact that the loss is constant, this will become relevant when there is little to no energy available, and can even cause power loss if less than 0.45 mW is available for harvesting. The output voltage is well regulated with the parallel combination of a capacitor and a battery, without a significant small signal ripple. However, due to the variation in battery voltage as a function of charge it is possible to have a range of DC operating points around the nominal voltage.
4.3. Combined system performance
As the prime goal of this work was to create a vibration energy harvesting system that can power a sensor with power requirement of 11 mW regulated DC power, we next describe the combined performance of mechanical and electrical systems. Figure 13(a) shows the regulated DC power output as a function of frequency. The energy harvesting system meets the 11 mW power requirement for a 4 Hz bandwidth from 47.75 to 51.75 Hz with an AC to regulated DC power conversion efficiency of 78%. At the center frequency, the system harvests an average power of 19 mW. The excess power generated from this harvester is sufficient to power the transmitter on a wireless sensor node. The Texas Instruments EZ430-RF2500T is commonly used for wireless sensor nodes, and can be programmed to transmit data with the available power. With a 3.3 V power supply, this device consumes 330 μW of power in sleep mode, and 36.3 mW of power when actively transmitting at −12 dB m signal strength and 250 kbps. By cycling between sleep mode and transmission mode at a 10% duty cycle and 1 s period, it is possible to get a 25 kbps link that consumes about 3.9 mW of power with a maximum latency of 1 s. Figure 13(b) shows the AC to regulated DC electrical output power efficiency as a function of frequency. The average efficiency across the 4 Hz bandwidth was 78% which is one of the highest reported magnitudes for electromagnetic vibration harvesting system. Figure 13(c) shows the electrical efficiency breakdown at each stage within the energy harvesting system.

Figure 13. (a) DC Power as a function of frequency, (b) harvester AC mechanical power to DC power output as function of frequency, (c) breakdown of electrical efficiency losses within the energy harvesting system.
Download figure:
Standard image High-resolution imageWhile the harvesting system developed in this study uses a battery and capacitor in parallel to regulate the output voltage, in future battery-free operation is desirable. Future work could use a power converter to regulate a time varying voltage (such as the input) to a constant voltage. The power converter would require a feedback loop to vary the duty cycle and frequency of the switching PWM. Because changing the duty cycle or frequency alters the input impedance as well, it is impractical to use a single switching converter for voltage regulation and impedance matching. A possible solution is to use two cascaded switching converters where the first one matches the impedance and stores the energy in a capacitor, with a second converter that regulates the voltage. The control for this becomes more complicated, and additional efficiency losses will be incurred by the second stage. However, it is possible to remove the need for a battery as an energy storage element in this way.
To compare our prototype to the state-of-the-art, we can calculate a volume figure of merit F0Mv and a bandwidth figure of merit F0MBW [42] as:

where Y0 is the peak amplitude of source displacement, Vol is the total prototype volume, ω is the resonant frequency or center frequency and BW1 dB is the bandwidth 1 dB down from the value at the center frequency. Table 5 shows a summary of the various inductive harvesters reported in literature along with the harvester developed in this study. Given the fact, that we overdesigned our generator to generate excess power at all the operating frequencies, the overall system was found to perform relatively well. As it can be seen from figure 13(a), the power requirement for the sensor can be easily met with just three cantilevers resulting in drastic reduction in volume. In that case the performance of our harvester will be dramatically higher compared to published literature. However, an overdesigned system has advantage in terms of accounting for any random fluctuations that can occur during the deployment.
Table 5. Summary of the state-of-art for inductive energy harvesters.
| Displacement (m) | Volume (m3) | Frequency (Rad) | Power (W) | F0Mv (%) | BW1 dB (Hz) | F0MBW (%) | Reference |
|---|---|---|---|---|---|---|---|
| 2.76 × 10⁻⁴ | 3.75 × 10⁻⁶ | 188.5 | 6.20 × 10⁻⁵ | 0.048 | 6 | 0.009 6 | [43] |
| 5.00 × 10⁻⁴ | 4.00 × 10⁻⁵ | 289 | 0.18 | 0.9 | 2.5 | 0.049 1 | [44] |
| 8.59 × 10⁻⁴ | 7.34 × 10⁻⁶ | 106.8 | 3.89 × 10⁻³ | 2.16 | 0.75 | 0.095 3 | [45] |
| 6.15 × 10⁻⁷ | 2.30 × 10⁻⁴ | 750.8 | 1.70 × 10⁻³ | 0.0385 | 0.8 | 0.000 258 | [21]a |
| 6.90 × 10⁻⁶ | 0.000 17 | 377 | 5.20 × 10⁻³ | 0.124 | 1 | 0.002 07 | [46]a |
| 1.99 × 10⁻⁵ | 0.001 179 | 314.2 | 2.55 × 10⁻² | 0.0276 | 2.38 | 0.001 31 | This work |
| 1.99 × 10⁻⁵ | 0.001 179 | 314.2 | 1.97 × 10⁻² | 0.0213 | 2.26 | 0.000 96 | This worka |
| 3.27 × 10⁻⁶ | 1.46 × 10⁻⁶ | 424.7 | 1.56 × 10⁻⁴ | 3.12 | 0.25 | 0.011 5 | [24] |
| 8.8 × 10⁻⁶ | 0.000 111 | 1058.7 | 1.90 × 10⁻² | 0.0282 | 1.625 | 0.000 272 | [3] |
5. Conclusion
This paper reports the design of an electromagnetic vibration energy harvester system which improves upon the performance of the previous studies in terms of operation bandwidth and mechanical to electrical power conversion. The mechanical and electrical components were integrated into one assembly and experimentally characterized. A continuous output power of 11 mW across a bandwidth of 4 Hz was demonstrated that meets the demands of the sensor power consumption typically used for condition health monitoring. Excess power of 8 mW was continuously generated at the center frequency which is enough to power a wireless transmitter at 10% duty cycle and 1 s period. The average efficiency across the 4 Hz bandwidth was 78% which is one of the highest reported values for electromagnetic vibration harvesting system.
Acknowledgments
The authors gratefully acknowledge the financial support from Pratt & Whitney. ACM acknowledges Darian Andreas Schaab for developing algorithms to improve the analysis of the relationship between magnetic field vectors and coil geometry.