
Abstract
This study introduces a novel generation of 3D splitting and recombination (SAR) passive micromixer with microstructures placed on the top and bottom floors of microchannels called a 'chain mixer'. Both experimental verification and numerical analysis of the flow structure of this type of passive micromixer have been performed to evaluate the mixing performance and pressure drop of the microchannel, respectively. We propose here two types of chain mixer—chain 1 and chain 2—and compare their mixing performance and pressure drop with other micromixers, T-, o- and tear-drop micromixers. Experimental tests carried out in the laminar flow regime with a low Reynolds number range, 0.083 ≤ Re ≤ 4.166, and image-based techniques are used to evaluate the mixing efficiency. Also, the computational fluid dynamics code, ANSYS FLUENT-13.0 has been used to analyze the flow and pressure drop in the microchannel. Experimental results show that the chain and tear-drop mixer's efficiency is very high because of the SAR process: specifically, an efficiency of up to 98% can be achieved at the tested Reynolds number. The results also show that chain mixers have a lower required pressure drop in comparison with a tear-drop micromixer.
Export citation and abstract BibTeX RIS
1. Introduction
Effective mixing is a crucial process in microfluidic systems (Li et al 2010) and the potential applications of micromixers are widespread. Microscale devices have become widely applied in biological systems, medical diagnostic, microreactors for chemical reactions, genetic sequencing, environmental monitoring, MEMS and lab-on-a-chip devices (Bothe et al 2011, Yang et al 2007, 2009, Li et al 2011).
Indeed, microscale devices pose fundamental advantages compared with conventional macroscale systems because of their small characteristic dimensions (Soleymani et al 2008). Microfluidic devices offer many advantages including low energy requirements, faster analysis, reduced reagent and cell consumption, rapid mixing, low cost, rapid heat and mass transfer and portability (Fu and Lin 2007, Sheu et al 2012, Song et al 2012, Scherr et al 2012).
In microfluidic systems, viscosity dominates flow (Wang et al 2003, Yang et al 2008) and mixing is limited to molecular diffusion due to the laminar nature of microflows (Sinton and Coleman 2005, Hong et al 2004, Aubin et al 2005) and the flows tend to form a laminate structure instead of a uniform mixture due to the small Reynolds number (Wang et al 2011). Hence, the focus on this field of research is to propose a device itself and optimizing the geometry to enhance fluid mixing within the microchannel (Matsuyama et al 2010, Shih and Chung 2008, Matsuyama et al 2011).
Micromixers reported in the literature can be classified as either an active or passive (or static) fluid mixer (Hessel et al 2005, Mansur et al 2008, Nguyen and Wu 2005, Bockhorn et al 2010), depending on how they manipulate the fluid to be mixed (Park et al 2010). Active micromixers require external forces (Bhagat and Papautsky 2008), such as periodical variation of pumping capacity, electrokinetic instabilities, acoustically induced vibration, electrowetting-induced merging of droplets, magneto-hydrodynamic action, small impellers, a piezoelectrically vibrating membrane or integrated micro valves and pumps (Liu et al 2003, Glasgow and Aubry 2003). By contrast with active mixers, a passive type requires no external energy and agitation except that associated with producing the flow pressure drop. Passive micromixers are of simple design and in many instances are preferred over active micromixers.
The mixing quality in microscale devices can be characterized using a number of different approaches, for example: (a) direct methods of measurement which are usually experimental essence, flow visualization and mixing performance techniques such as acid–base neutralization with an indicator, radioactive tracer and different optical analytical techniques; or b) indirect approaches from which the degree of mixing can be quantified include Poincare section analysis, residence time distribution and numerical particle tracking method (Solliec et al 2012).
Over the past decade passive micromixers based on a variety of principles have been designed and investigated. Several experimental and numerical investigations have been carried out for different passive micromixers. The mixing of fluids in a passive micromixer is founded on some main principles: a) flow lamination which is used in basic T-mixer and Y-mixer (Kamholz et al 1999, Sullivan et al 2007, Swickratha et al 2009, Bothe et al 2011), in mixers with different geometries: zig-zag, square-wave, rhombic and similar (Hossain et al 2009), in serial multi-stage and multi-layer mixers (Tofteberg et al 2010); (b) chaotic mixing by eddy formation, stretching and folding (Kim and Ansari 2007, Kim et al 2010, Shih and Chung 2008, Xua et al 2011, Cho et al 2011, Yu et al 2011, Zimmerman and Hassel 2006); (c) split-and-recombine concepts (SAR) (Ohkawa et al 2008, Lee and Lee 2008, Chen et al 2009, 2011, Nimafar et al 2012).
According to the latest investigations, in many cases the micromixers based on the SAR principle offer advantages over other types of passive micromixers at small Reynolds number regimes.
Ohkawa et al (2008) developed the σ-type plate static mixer with split and inverse recombination progresses for a small Reynolds number less than 10. Lee and Lee (2008) used the mixer based on SAR with chaotic advection principles for relatively high Reynolds numbers. Chen et al (2009) proposed the tear-drop micromixer and the experimental results demonstrated that mixture uniformity is improved either by accepting a much longer mixing time or by increasing the number of elements, which greatly increases pressure drop.
The high pressure drop is one of the disadvantages of a SAR-type micromixer. The prospect of improving the performance of SAR mixers by using more efficient element geometry is currently the central problem. In the present study, a new type of SAR micromixer called the 'chain micromixer' was designed and investigated experimentally to find out the efficiency and to numerically detect the pressure drop, and results were compared with the mixing performance of known T-, O- and tear-drop micromixers. Two colored water solutions (blue and yellow) are used for mixing. In all cases (T, O, Tear-drop and chain mixers), the microchannel dimensions are as follows: W = 0.4 mm, H = 0.4 mm. The aspect ratio of the channel cross-section is unity (W/H = 1). The channel's length in T, O and tear-drop are L = 21 mm and in chain mixers are L = 25 mm.
2. T-micromixer, O-micromixer and tear-drop micromixer design
Three basic micromixers were constructed to compare the mixing efficiency of the new microdevice presented in this paper. Figure 1 shows the micromixers which were used in this investigation. T-, O-, chain 1 and chain 2- micromixers were designed and fabricated from plexiglas using a computer milling process. Also figure 1(c) illustrates tear-drop micromixer which was designed and fabricated from polycarbonate using a computer milling process. The prototypes were fabricated in I.T.D S.n.c. di Depaoli S. & C. (Turin, Italy) using a CNC Milling and Engraving Machine P20 S, KUNLMANN (Germany). The geometric characteristics were constant for all prototypes. The two species flow into the microchannel by means of two entrances.

Figure 1. Designs of the micromixers: (a) T-micromixer; (b) O-micromixer; (c) tear-drop micromixer; (d) chain 1-micromixer; (e) chain 2-micromixer; (f) structural design of chain 1-micromixer; (1) chain 1 microchannel segments; (2) sequential lamination of layers.
Download figure:
Standard image2.1. T-micromixer
The T-micromixer designed on the basis of Wong et al (2004) is illustrated in figure 1(a).
The T-micromixer is the simplest microfluidic device with a rectangular cross section and it consists of two inlets with a straight channel. As shown in figure 1(a), there is no special geometry along the microchannel. The geometry consists of a mixing channel with 21 mm length and 0.4 mm width and depth. All results given here refer to a microchannel with mentioned cross section dimensions.
2.2. O-micromixer
As mentioned in section 2.1, the T-micromixer is the simplest microfluidic device. Therefore, to show the geometry effect in passive micromixing, an O-micromixer was designed on the basis of Garstecki et al (2006), tested and was shown to be an improved and optimized geometry than a T-micromixer. Figure 1(b) illustrates the O-mixer, whose microchannel is divided into two segments: straight channel and O-segment.
The two species flow into the microchannel through the straight section. Subsequently, the stream is divided into two parts and the two streams connect to each other at the end of the O-segment. This splitting and rejoining induce the molecular diffusion effect to enhance mixing efficiency. This process takes place six times along the microchannel.
2.3. Tear-drop micromixer
On the basis of the investigation presented in Chen et al (2009), a tear-drop SAR micromixer was designed and constructed with polycarbonate using a computerized milling process. The tear-drop micromixer design is shown in figure 1(c).
The channel width and height are 0.4 mm. As can be seen in figure 1(c), the tear-drop mixer has a two-layer structure. The modules of the upper layer and the lower layer are connected by simple vertical channels. The inlet to the mixer is designed as a T-junction element (left side of figure 1(c)).
This method of splitting and recombining the flow provides a way of increasing the number of fluid layers. It is found that the efficiency of this mixer is high and also the required pressure drop is great.
3. Mathematical model
At the continuum level, constitutive governing equations are described with a set of conservation equations.
- 1Continuity (conservation of mass)
- 2Navier–Stokes equation or Newton's second law (conservation of momentum)
Solving above equations will result in two variables: the velocity V and the pressure P. These equations are formulized for a solo phase of homogenous composition.
Continuity (conservation of mass):

Navier–Stokes equation:
Where ρ denotes density, μ the viscosity and p the pressure.
The computational fluid dynamics (CFD) software, ANSYS-Fluent 13.0 was used to solve the governing equations (1) and (2). In this study the value of the ρ and μ are 998 kg m−3 and 0.000 89 kg m−1 s−1 respectively. Also some assumptions such as steady-state flow, no-slip conditions and incompressible fluid are proposed. The required information for numerical calculations are as follows: solver Fluent 13.0.0, mesh nodes for (1) T = 280 000 hexahedral cells; (2) O = 220 480 tetrahedral cells, (3) tear-drop = 379 670 hexahedral cells; (4) chain 1 = 218 810 hexahedral cells and (5) chain 2 = 259 870 hexahedral cells, under relaxation factor: (a) pressure = 0.3; (b) density = 1; (c) body force = 1 and (d) momentum = 0.7, and monitor convergence criteria (a) continuity = 1e-20; (b) x-velocity = 1e-20; (c) y-velocity = 1e-20; (d) z-velocity = 1e-20. Also the boundary conditions used in this investigation are as follows: inlet 1: mass flow inlet (kg s−1); inlet 2: mass flow inlet (kg s−1); outlet: pressure outlet (gauge pressure (Pascal) is equal 0).
4. Materials and method
The test bench layout used for this experimental investigation is shown in figure 2.
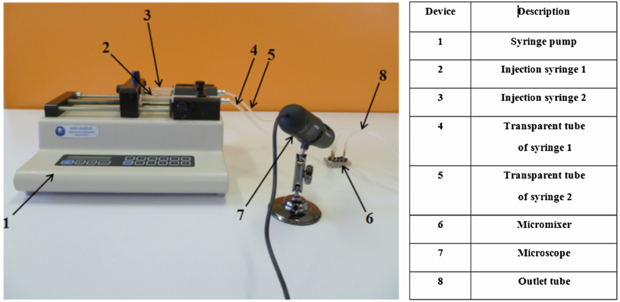
Figure 2. Test bench layout.
Download figure:
Standard imageMicroscope. The microscope used during the mixing process is a Veho model VMS-004D-400x USB microscope, with 400X magnification, 2 Megapixel Cmos lens (interpolated) and measurement software.
Syringe pump. The syringe pump used in this study is a KDS 210 series. The flow rate range for this instrument is from 0.1 µl h−1 (10 µl syringe) to 506 ml h−1 (60 ml syringe) with errors less than 1% (according to the catalog).
Dye. For visualization of the flow, blue and yellow food dyes are diluted in water.
4.1. Chain-micromixers design
A novel generation of 3D passive micromixer concept is introduced. This type of micromixer called the 'Chain micromixer' which is based on the SAR process, meaning that the two fluids to be mixed are split and recombined to optimize the diffusion process. The main working principle for this type of microchannel is to make 90° rotation of a flow, folding the stream and then split and recombine the flow to enhance the efficiency of the microchannel. This process is repeated during the microchannel until achieving the desired degree of mixing. Chain 1- and Chain 2- micromixers were designed and fabricated from plexiglas using a computer milling process. As illustrated in figures 1(d) and (e), the flow follows a 3D path along the microchannel.
Figure 1(d) illustrates the chain 1-micromixer. As shown in figure 1(d), after each vertical part (z direction), the diameter of the new section is 0.6 mm and extended by 0.2 mm rather than the outlet of the vertical part (0.4 mm). This characteristic of the geometry causes the splitting of the flow in the inlet of new part (figure 1(f), segments 3, 5, 7 and 9) and in the central part of the segment the recombination effect takes place. At the outlet of the segment, the diameter is again 0.4 mm like the vertical part (figure 1(f), segments 3, 5, 7 and 9). Indeed, after the extension in the inlet, the flow is constricted while going across these parts and the maximum constriction occurs at the outlet of this section. The maximum width of the microchannel is 0.6 mm and reduces during this part to minimum value of 0.4 mm.
As in the case of the chain micromixer depicted in figure 1, two mixing flows meet at the entrance to the microchannel and move along the entrance part until they reach the vertical part. In the vertical part, the flow moves in the –z direction. At the end of the vertical channel the stream reaches the first chain element.
The black color flow then moves against a wall and the white color flow moves to the central part of the chain segment (3). In this way, the flow is first split and then recombined into a three-layer flow, white and two black flows, as depicted in figure 1(f) segment (4). After reaching the vertical part, where these layers rotate 90°, in the next mixer segment (5) five layers are created, as illustrated in figure 1(b) segment (6). Through the same procedure, after segment 7 nine flow layers are formed. This process continues to the end of the chain-micromixer. In fact, the splitting and recombination processes cause a large number of different layers and with increasing the layers, the thickness of the layers will be smaller and the thickness of the poor mixed zone will be shorter, and part of this zone moves to other mixed zone and this process proceeds. This property enhances the mixing efficiency and homogeneity. Therefore with folding, expansion and constriction along with splitting and recombination, mixing can be improved significantly.
Figure 1(e) illustrates the chain 2 mixer which differs only by one parameter from the chain 1 mixer. As shown in figure 1(e), after each vertical part (z direction), the diameter of the new section is 0.8 mm and extended 0.4 mm rather than the outlet of vertical part (0.4 mm).
Experimental and numerical tests were performed for 'chain 1and 2' micromixers.
5. Experimental procedure
Experimental tests were performed using a microscope with high speed image acquisition. Colored water was used as the mixing species in all tests; specifically, blue and yellow solutions were produced by blending 1 g powder in 0.5 l water. As mentioned before, blue and yellow food dyes are diluted in water as the mixing flow in experimental tests. The mass flow rates of the mixing species are controlled by means of a programmable syringe pump (KDS 210 Series, KD Scientific). The T-, O- and tear-drop micromixers studied in this paper are shown in figures 3(a)–(c).
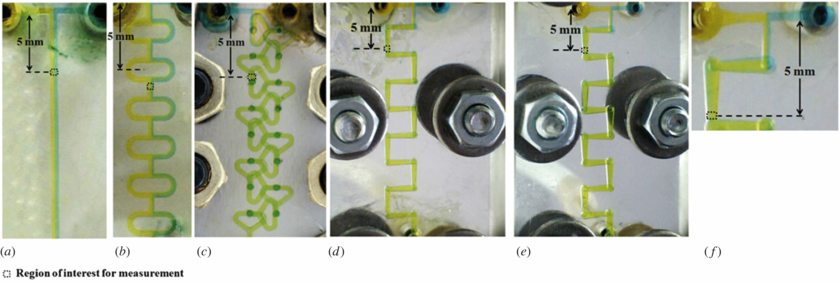
Figure 3. Micromixers after filling: (a) T-micromixer; (b) O-micromixer; (c) tear-drop micromixer; (d) chain 1-micromixer; (e) chain 2-micromixer; (f) chain 2-micromixer, inlet part to 5 mm.
Download figure:
Standard imageDuring the mixing process, several pictures were taken with the microscope from the entrance area to the end of the channel. This was repeated for all Reynolds numbers and also for chain mixers which was used in this study. The chain 1- and chain 2-micromixers studied in this paper are shown in figures 3(d) and (e).
Image-based techniques were used to evaluate the mixing performance of the prototypes, and the gray scale value was applied for post processing. To analyze the image, the captured color images were converted into gray-scale images. To convert any color to gray-scale representation of its luminance, first one must obtain the value of its red, green and blue primaries in linear intensity encoding. Then add together 30% of the red values, 59% of the green values, and 11% of the blue values. In this study Adobe Photoshop software version 12.0 is applied to convert the colored images to gray-scale images. This technique (gray-scale value) is useful for highlighting regions of interest, especially the concentration field in the micromixer (Nguyen 2008).
6. Post processing
To evaluate the standard deviation of concentration, mixing index (MI) and efficiency of the prototypes, three kinds of Matlab M-file code were written (PDF1, PDF2 and Efficiency). Data were analyzed using the following procedure (figure 4):
The microscope's CMOS lens provides a bit depth of 8 and an 8-bit depth describes 256 (28) different gray levels. If the species are black and white, the gray level varies from 0 to 255 respectively, and there is no need to calibrate the program which shows that concentration varies from 0 to 1 in the PDF diagram. Since the species are yellow and blue, the gray level does not vary from 0 to 255 and gray level range reduces (for example: between 60 and 220). Hence, it does need to be calibrated to that concentration which varies from 0 to 1 in the PDF diagram. For this purpose, in the program code we put, for example, 60 (instead of 0) as a minimum value and 220 (instead of 255) as a maximum value. This procedure occurs in PDF 2. Therefore the program (PDF 1) after calibration is ready to analyze the gray-scale image.
Figure 5 presents the probability distribution function in terms of concentration which was calculated and plotted by Matlab program codes (PDF 1 and 2). Subsequently, the probabilities for different concentration values and for various Reynolds numbers were calculated and plotted for chain prototypes.
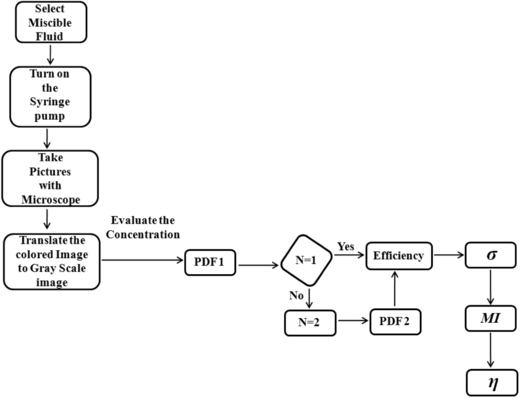
Figure 4. Flow chart for experimental analyzing.
Download figure:
Standard image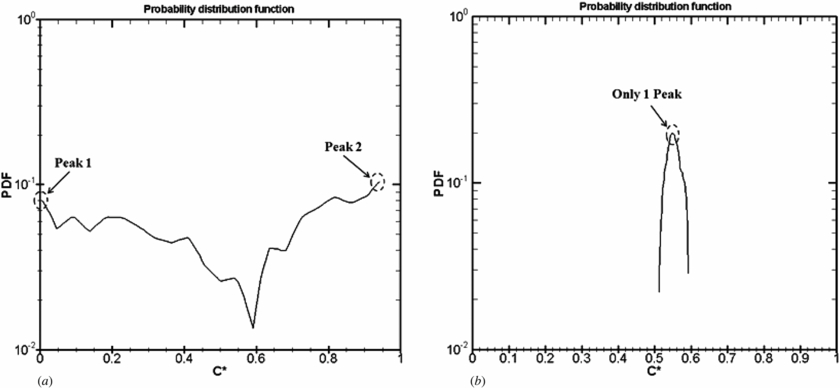
Figure 5. (a) PDF in chain 2-micromixer at Re = 4.166, entrance region; (b) PDF in chain 2-micromixer at Re = 0.416, after 21 mm.
Download figure:
Standard imageThe two species are not mixed in the entrance region of the micromixers, where there are two predominant concentration values resulting in two separate peaks as shown in figure 5(a). In a region of well-mixed fluids, there is one predominant concentration and this value depends on the color of the mixing process that can be seen as the best issue, resulting in a single peak, as illustrated in figure 5(b).
The homogeneity can be represented as the standard deviation (variance) of the concentration:

Where C* is the normalized concentration and  is the expected normalized concentration (depends on the color that can be seen as the best result). The standard deviation can be normalized again by the mean concentration to evaluate the MI:

The MIs are 1 and 0 for the unmixed case and well-mixed case, respectively. The mixing efficiency can be defined through equation (5):

If the two species are fully mixed, mixing efficiency is 1 (100%). An efficiency between 80% and 100% is acceptable for mixing process applications (Nguyen 2008).
At the starting point where two fluids join together, the standard deviation is high, the MI is 1 (or approximately 1) and efficiency is 0% (or approximately 0%). Figure 5(a) illustrates the chain 2-mixer's concentration at the entrance region at Re = 4.166, while figure 6(a) shows σ and η at the same Reynolds number, where efficiency is 1%. Figure 5(b) depicts the chain 2-mixer's concentration at the outlet region at Re = 0.416, while figure 6(b) shows σ and η under the same Reynolds number, where efficiency is 98% (η > 80%).
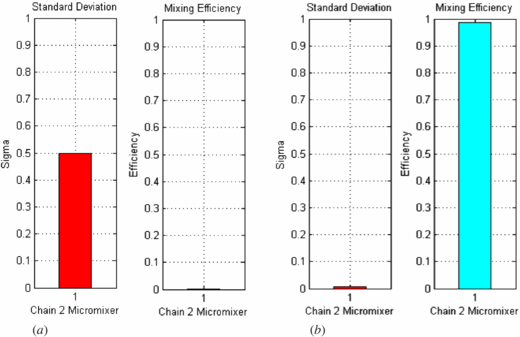
Figure 6. Chain 2-micromixer analysis: (a) Re = 4.166, entrance region; (b) Re = 0.416, after 21 mm.
Download figure:
Standard imageThese processes continue for Reynolds numbers of 0.083, 0.832, 1.666 and 4.166 for all prototypes.
The experimental errors depend on the quality of the pictures and selecting the region of interest in microchannel which would be considered in the post-processing step. The maximum measurement error could be seen when the flow is far from the mixed condition, for example, in the entrance region or in the case of using the poor performance mixer.
7. Results and discussion
In this study, the effects of geometry and various Reynolds numbers on flow field and mixing characteristic along the chain microchannels are examined and mixing efficiencies are compared with T-, O- and tear-drop micromixers. Five different flow rates (ml min−1) were considered. The corresponding average flow velocity and Reynolds numbers, shown in table 1, are calculated for the first part of the devices in all micromixers after two species reach together. In all tested micromixers, the size of the channel width is 0.4 and the channel height is 0.4 mm in the first part (T junction part).
Table 1. Flow rate, Re and velocity values during experimental and numerical investigation.
| Qv (ml min−1) | Qm (kg s−1) | V (mm s−1) | Re |
|---|---|---|---|
| 0.001 | 1.66×10⁻⁸ | 0. 1 | 0.083 |
| 0.005 | 8.31×10⁻⁸ | 0. 5 | 0.416 |
| 0.01 | 1.66×10⁻⁷ | 1 | 0.832 |
| 0.02 | 3.32×10⁻⁷ | 2 | 1.666 |
| 0.05 | 8.32×10⁻⁷ | 5.2 | 4.166 |
Then, the effects of various Reynolds numbers and geometry on pressure drop were examined numerically using CFD code, ANSYS FLUENT-13.0. From this, the numerical results for chain microchannels are compared with well-known basic microchannels.
7.1. Experimental analysis
The results of the experimental investigation of the chain micromixers are presented below. PDF software and equations (3)–(5) are used to calculate and plot standard deviation of concentration σ, mixing index MI and efficiency η at different Re along the microchannel. The mixing efficiency is quantified by evaluating the variance of the mixture in a cross-section which is normal to the flow direction by equation (3). The variance can be normalized again by the mean concentration to get the MI by equation (4). Afterward, the efficiency can be defined based on the MI by equation (5).
Figure 7 illustrates the efficiency versus the distance from the inlet section in chain 1 and chain 2 mixers at Re = 0.083.

Figure 7. Comparison of η in chain 1 and chain 2 mixers at Re = 0.083.
Download figure:
Standard imageAs shown in figure 7, after 5 mm in chain 1 and chain 2, the efficiency under Re = 0.083 is more than 95% and acceptable for mixing processing. Also, it could be seen after first vertical part, the efficiency reach to 80% which shows the effect of split and recombination in the micromixing application.
Figure 8 illustrates efficiency versus Reynolds number for different micromixers. As the diagram shows, efficiency decreases as Reynolds number increases and vice versa. This phenomenon related to the residence time distribution in the microchannel. When the Reynolds number is very low, two species have more time for mixing and by increasing the Reynolds number (velocity) the residence time decreases. Hence, in the Re number range Re < 1, micromixer efficiency is higher than in the range 1 < Re < 5.
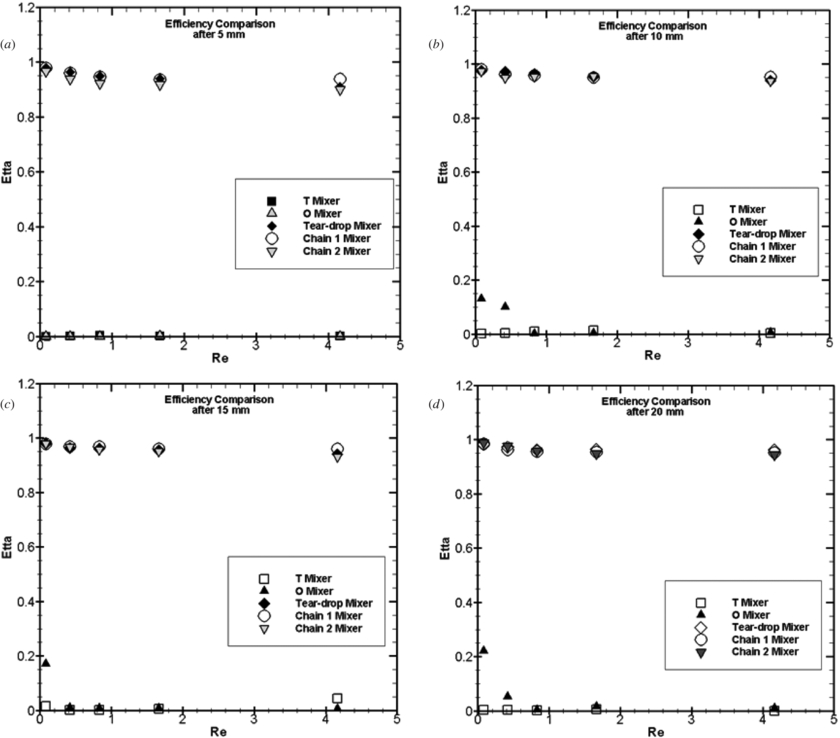
Figure 8. Comparison of η in terms of Re: (a) after 5 mm; (b) after 10 mm; (c) after 15 mm; (d) after 20 mm.
Download figure:
Standard imageAfter 5 mm, tear-drop-, chain 1 and chain 2-mixers efficiencies are acceptable, while in other prototypes the degree of mixing is low (η < 25%), demonstrating the effect of splitting and recombination on micromixer efficiency.
Results for the efficiency comparison after 10 mm are shown in figure 8(b). Since the operations of T- and O-mixers for the Reynolds range (0.083 < Re < 4.166) were found to be invalid for efficient mixing, it is evident that mixers based on the SAR process effects demonstrate efficient mixing at this Reynolds number range. Also, it could be seen after 10 mm the chain and tear-drop mixers efficiencies are over 90% at all tested Reynolds numbers, which shows that the SAR effect is significant in short distance.
The experimental results about the level of mixing after 15 mm are displayed in figure 8(c). As could be seen again, without SAR process, there are poor mixing conditions in the T- and O-microchannels. It is obvious that the separation of mixture's layers and recombining them again due to the geometrical effects leads to fast mixing at low Reynolds number range.
Figure 8(d) shows the efficiency comparison at the end regions of the mentioned micromixers and an overview on the effects of revenue and design on mixing efficiency is presented. With a lamination concept, the novel generation of SAR-based passive micromixers has a significant efficiency, and this can be seen in the efficient mixing from the microchannel. As depicted in figure 8(d), not only is there acceptable and great efficiency at Re < 1, but it is also evident at 1< Re < 4.166, efficiencies are acceptable in tear-drop, chain 1- and chain 2- mixers. It is possible to increase the Reynolds number to achieve the faster and complete mixing in chain micromixer and also reduce the microchannel length.
This new concept for multi-laminated layers and SAR process that occurs in chain 1 and chain 2- micromixers can lead to enhancing the mixing speed. This characteristic is essential and applicable to micro technology.
7.2. Numerical simulation
To analyze the flow and pressure drop in the microchannel the CFD code ANSYS Fluent-13.0 has been used. The fluent solves the continuity and Navier–Stokes equations in steady conditions.
To validate the approximation accuracy of the solver and assumptions which applied in this study, the analytical method is compared with the numerical method in the T mixer.
To find out the pressure drop in analytical method, Darcy's law is applied:
Where μ denotes the viscosity, vthe velocity, p the pressure, and d the hydraulic diameter of the microchannel.
Figure 9(a) demonstrates the differences between the two mentioned methods, which very small and negligible.
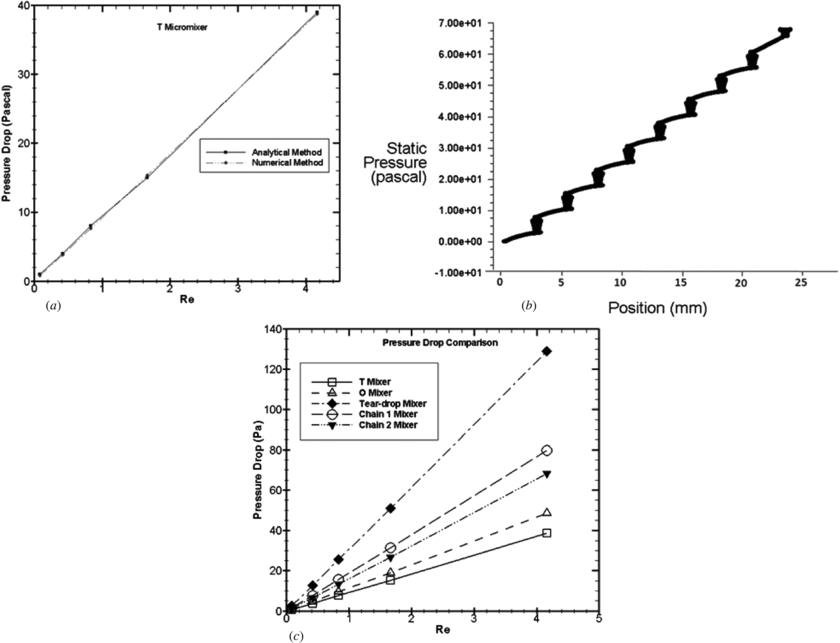
Figure 9. (a) Comparison of pressure drop between analytical method and numerical method for the T mixer; (b) pressure drop in chain 2 micromixer during microchannel at Re = 4.166; (c) pressure drop comparison at different Re.
Download figure:
Standard imageTherefore the CFD calculations with Fluent under the previously mentioned assumptions are reliable for finding the pressure drop. The numerical technique is applied to detect the pressure drop during the microchannel which was found to be accurate in comparison with the analytical method.
Figure 10 illustrates the contour of pressure during the five passive micromixers at Re = 0.083. As could be seen, pressure drops in chain 1- and chain 2 microchannels are 1.55 and 1.32 Pascal respectively, while the pressure drops are 2.53, 0.94 and 0.75 in tear-drop-, O-and T- mixers respectively. It shows that the tear-drop micromixer has a higher pressure drop than the other tested microdevices at Re = 0.083.
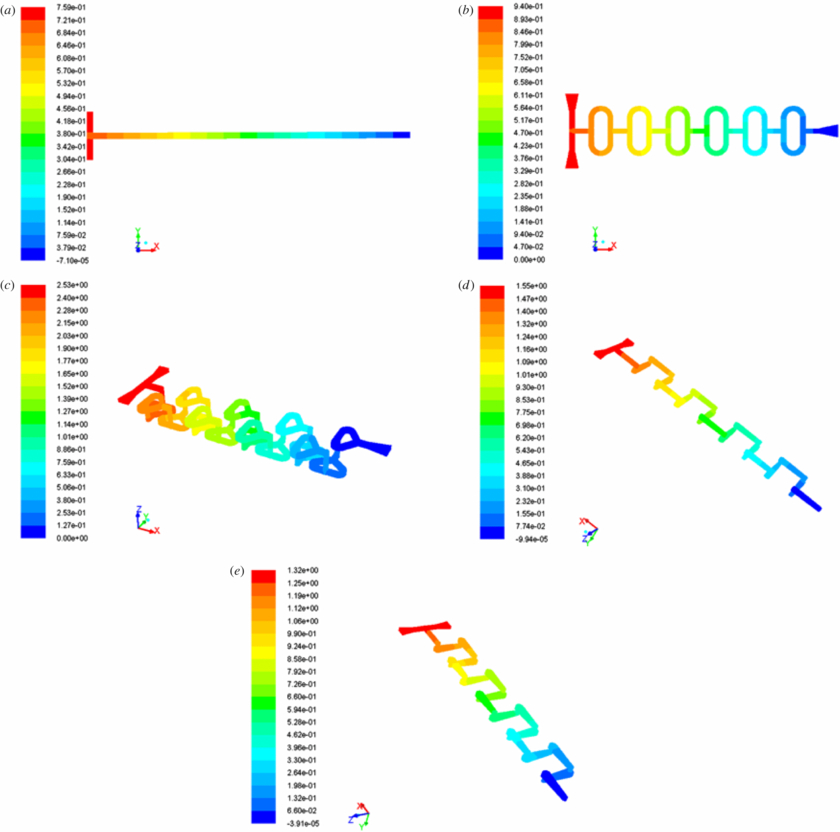
Figure 10. Pressure drop at Re = 0.083: (a) T-micromixer (b) O-micromixer (c) tear-drop micromixer (d) chain 1- micromixer (e) chain 2- micromixer, pressure drop (Pa).
Download figure:
Standard imageAlso, for example figure 9(b) illustrates that the pressure drop in chain 2 micromixer is 68.1 Pa at Re = 4.166. In comparison with figure 10(e), it could be found that pressure drop increases as the Reynolds number increases.
Figures 9(c) and 11 demonstrates that the tear-drop micromixer's pressure drop is significantly higher than that of the chain 1, chain 2, T- and O-micromixers at all tested Reynolds numbers.
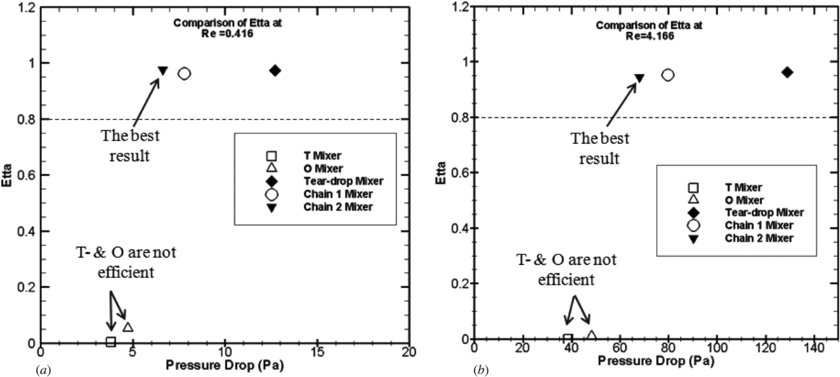
Figure 11. Efficiency comparison versus pressure drop: (a) Re = 0.416; (b) Re = 4.166.
Download figure:
Standard imageAccording to figures 8(d), 9(c) and 11, in comparison with other Reynolds numbers it can be found that with increasing the Reynolds number, the efficiency decreases and the pressure drop increases.
The chain mixers have been designed with the goal of maximizing the mixing efficiency and minimizing the pressure drop associated with the energy consumption. The mixing efficiency of the chain mixers is practically identical with those of the tear-drop mixer, while the pressure drop at the chain mixers is approximately two times less than it is at the tear-drop mixers. The developed chain micromixers offer major advantages by virtue of their higher fluid conductivity of the chain mixer element in comparison with the tear-drop mixer element. Also, figure 9(c) shows that in all of the Reynolds numbers range, the required pressure drop in chain 2 is less than chain 1. This is a good result that with the same (or higher) efficiency, the required pressure drop decreases. Hence, these two new geometries satisfy both of targets in micromixer design which have higher mixing efficiency and lower pressure drop (in comparison with the tear-drop mixer).
9. Conclusion
This paper introduced a novel generation of 3D SAR passive micromixer called a chain micromixer. The mixing characteristics of two species are elucidated via experimental and numerical studies with various inlet flow rates (velocities) and the results are compared with currently well-known micromixers. Chain 1 and chain 2 micromixers are designed and fabricated from plexiglas using a computer milling process and the flow follows a 3D path along the microchannel. It was found that mixing performance is significantly affected by the SAR flows and depends on Reynolds number (inlet velocities).
Experimental results illustrate that the micromixers with SAR process like chain 1-, chain 2 and tear-drop micromixers have outstanding mixing efficiencies compared to those without the SAR characteristic. Indeed, the SAR structures of the flow channels result in the reduction of the diffusion distance of the two fluids and after a short distance from inlet a high mixing efficiency can be achieved.
In chain micromixers, after each vertical channel, the diameter of the new section is extended by 0.2 mm or 0.4 mm in chain 1- and chain 2-micromixers respectively, rather than the outlet of the vertical part (0.4 mm). At the outlet of this part, the diameter is again 0.4 as with the vertical part. After the extension in the inlet, the flow is constricted while flowing across these parts, and the maximum constriction occurs at the outlet of this section and the mentioned properties cause the homogeneity in the mixed layers. Therefore splitting and recombination along the chain 1- and chain 2- micromixers and repeating these processes leads to significantly improved mixing and it was obvious that the efficiency of chain 2 is the same as chain 1 at each desired region. Also, it can be found that with an increase of the Reynolds number, efficiency decreases and the pressure drop increases. As well as the efficiencies of chain mixers and tear-drop mixer being almost quite the same at each desired region, the required pressure drop in the chain mixers is approximately two times less than pressure drop in the tear-drop mixer. Also in chain mixers, the required pressure drop in chain 2 is less than chain 1. This is a particularly good result, that with higher efficiency the required pressure drops decreases. Hence, these new geometries satisfy both of the goals for the micromixer design, which are higher mixing efficiency and lower pressure drop in comparison with the tear-drop micromixer.
These results open new operating windows for rapid mixing in the microchannel to overcome the fluid mixing, which is strongly limited to the laminar regime with a lower required pressure drop. For our future work, the optimization of the chain mixer with the development of new designs would be considered as we expected to find higher efficiency and lower pressure drop in upcoming chain micromixers.