
Abstract
We demonstrate the rapid and label-free capture of breast cancer cells spiked in blood using nanotube-antibody micro-arrays. 76-element single wall carbon nanotube arrays were manufactured using photo-lithography, metal deposition, and etching techniques. Anti-epithelial cell adhesion molecule (anti-EpCAM), Anti-human epithelial growth factor receptor 2 (anti-Her2) and non-specific IgG antibodies were functionalized to the surface of the nanotube devices using 1-pyrene-butanoic acid succinimidyl ester. Following device functionalization, blood spiked with SKBR3, MCF7 and MCF10A cells (100/1000 cells per 5 μl per device, 170 elements totaling 0.85 ml of whole blood) were adsorbed on to the nanotube device arrays. Electrical signatures were recorded from each device to screen the samples for differences in interaction (specific or non-specific) between samples and devices. A zone classification scheme enabled the classification of all 170 elements in a single map. A kernel-based statistical classifier for the 'liquid biopsy' was developed to create a predictive model based on dynamic time warping series to classify device electrical signals that corresponded to plain blood (control) or SKBR3 spiked blood (case) on anti-Her2 functionalized devices with ∼90% sensitivity, and 90% specificity in capture of 1000 SKBR3 breast cancer cells in blood using anti-Her2 functionalized devices. Screened devices that gave positive electrical signatures were confirmed using optical/confocal microscopy to hold spiked cancer cells. Confocal microscopic analysis of devices that were classified to hold spiked blood based on their electrical signatures confirmed the presence of cancer cells through staining for DAPI (nuclei), cytokeratin (cancer cells) and CD45 (hematologic cells) with single cell sensitivity. We report 55%–100% cancer cell capture yield depending on the active device area for blood adsorption with mean of 62% (∼12 500 captured off 20 000 spiked cells in 0.1 ml blood) in this first nanotube–CTC chip study.
Export citation and abstract BibTeX RIS

Original content from this work may be used under the terms of the Creative Commons Attribution 3.0 licence. Any further distribution of this work must maintain attribution to the author(s) and the title of the work, journal citation and DOI.
1. Introduction
In 1869, Thomas Ashworth first observed circulating tumor cells (CTCs) in the blood of a man with metastatic cancer using an optical microscope. He postulated that 'cells identical with those of the cancer itself being seen in the blood may tend to throw some light upon the mode of origin of multiple tumors existing in the same person' [1]. A thorough comparison of the morphology of the circulating cells to tumor cells from different lesions led Ashworth to conclude that 'One thing is certain, that if they (CTC) came from an existing cancer structure, they must have passed through the greater part of the circulatory system to have arrived at the internal saphena vein of the sound leg' [1]. Since then tumor derived cells have been recognized as being present in the circulatory system and number of studies were conducted in the 1950s on CTC detection in peripheral blood [2, 3]. While PCR techniques greatly enhanced the detection of CTCs in 1990s for various cancers, [4–8], the advancement in microfluidic cell capture technologies led to a new paradigm of 'liquid biopsy' that made the isolation, enumeration and study of CTCs possible in large volumes of blood.
The field of isolation and study of CTCs has been growing with many types of devices reported in the recent past based on immunomagnetic methods [9–11], microfluidic chips [12, 13], laser scanning cytometry [14], high-throughput optical-imaging systems [15] fiber optic array scanning technology [16] and nano-Velcro [17] arrays. Each method has advantages and disadvantages in isolation of CTCs. For example, the immunomagnetic methods, while automated, suffer from loss of CTCs, which requires definition of the number of cells captured versus survival in weeks/months [9]. Microfluidic techniques used for CTC isolation, while impressive, are flow rate dependent and require off-chip post-processing [12, 13]. The first generation CTC-chip enabled a capture yield of 25% (at 3 ml h−1 flow rate) to 65% (at 1 ml h−1) depending on how slowly the blood is processed [12]. To improve yield a herringbone chip was invented that yielded ∼80% capture yield at ∼0.12 ml h−1 flow rate and ∼40% capture yield at flow rate of ∼0.48 ml h−1 [13]. Static isolation of CTCs from blood through fractionation of blood into small droplets in a micro-array format has not been investigated for CTC isolation. We report this concept below.
There are several advantages to the static isolation and enumeration method: (1) micro-array format enabling a large volume of blood to be fractionated into smaller portions that may enable better capture sensitivity and enable verifiable and reproducible results as well as the ability to scale the number of sensors; (2) the nanotube-micro-arrays include both detection and capture technology unlike microfluidics which only captures; (3) a wide variety of antibodies can be functionalized on the same nanotube micro-array using 1-pyrene-butanoic acid succinimidyl ester (PASE) functionalization that can fish out CTCs overexpressing different receptors; (4) classification of the detected electrical signals using kernel-based dynamic time warping (DTW) classifiers with high sensitivity and specificity; (5) transfer of cells is not required to do further microscopic analysis thereby minimizing loss of CTCs; (6) the design is tunable to capturing 1–80 000 individual cells/22 500 cell clusters per device by changing the ratio of the area of the active region of the pad to the droplet area; (7) the entire assembly can be automated into a compact handheld device or a laboratory based instrument similar to the immunomagnetic methods of enrichment and capture [9–11]; (8) the captured cells are viable, enabling downstream molecular analysis such as qPCR. These excellent characteristics are encouraging to develop static micro-array isolation of CTCs from blood. We describe the proof-of-concept study in this paper using spiked breast cancer cells in blood.
2. Materials and methods
2.1. CNT-network formation
The first step in the process is assembling the nanotube network. Iso-semiconducting single wall carbon nanotubes (SWNTs) were purchased from Nanointegris LLC. The manufacturer specified diameter was in the range of 1.2–1.7 nm and length was in the range of 100 nm–4 μm. Nanotubes were suspended in surfactant solution at 1 mg/100 ml as received. 600 μl of the stock solution was then mixed with 85 ml of DI water and 15 ml of 1% w/v sodium dodecyl sulfate (Sigma-Aldrich, Cat. No. 436143), for a final concentration of 6 μg/100 ml.
2.2. Vacuum filtration
The 100 ml solution was vacuum filtered over a cellulose membrane, 0.05 μm pore size (Millipore, No. VMWP09025). The vacuum filtration method self-regulates the deposition rate of nanotubes on the membrane to produce an evenly distributed conductive network. The CNT film network was then pressed onto a dry oxidized (300 nm thickness) 4'' silicon wafer for 30 min. Next the wafer was transferred to an acetone vapor bath that dissolved the overlaying filter membrane.
2.3. Clean room processing
Patterning of the nanotube film and electrode and insulating layer fabrication were done by photolithography in the cleanroom. The S1813 photoresist was used to mask the nanotube film areas needed for the sensor elements. Exposed nanotubes were etched away in a March reactive ion etcher for 90 s at 200 W power and pressure of 200mTorr. The S1813 photoresist was also used to mask the electrode pattern. Electrodes, 15 nm Ni and a 90 nm Au layers, were deposited by sputtering in a Leskar PVD 75 system, 300 W DC power. The lift-off process was conducted in an acetone bath to remove the excess Ni/Au layers. Lastly, the sensors were covered with SU8-2005, a 5 μm thick photopolymer layer. A window over each of the nanotube sensor elements was developed, but the electrodes remain insulated beneath the SU8.
2.4. Device functionalization
Finished carbon nanotube sensors were functionalized with anti-EpCAM, anti-Her2 and IgG by a pyrene linker molecule. The pyrene rings of 1-pyrenebutanoic acid, succinimidyl ester adsorb onto carbon nanotube sidewalls by π-stacking. The ester on the other end of the molecule provided an attachment point for antibodies. PASE (AnaSpec, Cat. No. 81238) was dissolved in methanol at 1 mM. Devices were incubated in the PASE solution for 2 h at room temperature, and then rinsed with methanol and dried using a nitrogen air gun. Devices were then incubated in Anti-EpCAM (EMD Bioscience, Cat. No. OP187), anti-HER-2 (Cell Signaling tech., Cat. No 2242S), or IgG (EMD Millipore, Cat. No. 411550), 20 μg ml−1 in 1X PBS, for 2 h at room temperature. After incubation, devices were rinsed in 1X PBS three times. Tween20 was used to block unfunctionalized nanotube sidewalls to minimize non-specific interactions. Devices were incubated with 0.5% Tween20 for 2 h at room temperature. After incubation, devices were rinsed with 1X PBS, then incubated in 20 μl droplets of 1X PBS overnight in a humid chamber at 4°C before testing.
2.5. Cell culture and preparation
The breast adenocarcinoma cell lines MCF7 and SKBR3 (ATCC, Cat. No. HTB-22; HTB-30), was cultured under conditions as recommended by ATCC. MCF10A (ATCC, Cat. No. CRL-10317) is a non-tumorigenic cell line that is EpCAM negative, while MCF7 and SKBR3 are EpCAM positive cell lines. SKBR3 is a Her2 positive cell line. Cells were grown for 3–4 d to reach ∼80% confluence (figure S1, online supplementary information). Cells were then detached from the culture flask using Accutase enzyme solution (Sigma, Cat. No. A6964), centrifuged and suspended in 1X PBS buffer solution and taken for counting using a hemocytometer as presented in figure S1 (online supplementary information). Finally cells for each cell line were prepared at fixed concentrations of 800 000 cells ml−1 and 80 000 cells ml−1 in 1X PBS solution. Next the cell samples were diluted 1:3 in blood for a final spiked cell concentration of 1000 cells/5 μl and 100 cells/5 μl. At this stage spiked blood samples were stored at 4 °C for same day testing. As test samples were injected onto the device at fixed volumes of 5 μl, the total number of the spiked cells injected to each device was fixed at 1000 or 100 accordingly.
2.6. Blood sample preparation
Blood was donated by the first author (FK) of this paper and was the subject of all blood draws. Blood samples used are all traced back to FK as the only source and sole blood donor. This allowed for a control and identified blood source with the least degree of variation in each batch of blood samples. Upon receiving approval from Worcester Polytechnic Institute's (WPI) Institutional Review Board (IRB), IRB#00007374, and completing biosafety, blood-borne pathogen, and standard microbiological practices trainings, the following protocol was developed under the guidance of Environmental Health and Safety department at WPI to collect and handle blood samples for the purposes of the experiments presented here. As the blood sample volume defined for each set of testing are set at 5 μl, the total blood volume needed for each day of testing did not exceed 100 μl. Therefore, the blood draw protocol was generated around the volumes needed to minimize biohazardous waste generation and to maintain the health of the blood donor as the blood draws had to be executed frequently throughout the 21 d of testing. As a result, capillary sampling protocol provided by World Health Organization (WHO), 'WHO guidelines on drawing blood: best practices in phlebotomy', was adopted to generate a protocol to collect blood samples from a finger tip of the subject as presented in figure S2 (online supplementary information). PBS or CTC spiked PBS were diluted 1:3 into collected blood, as described above. This dilution protocol prevented the blood from clotting without the addition of any additional chemicals and allowed for determining an exact concentration of spiked CTCs levels in each sample. Blood sample preparation steps are shown in figure S2 (online supplementary information).
2.7. Confocal microscopy
After experimental data had been collected, the devices were saved and taken for staining and confocal imaging. The devices were first rinsed with PBS to remove excess cells and fragments and then incubated with 4% paraformaldehyde (Santa Cruz Biotechnology Inc., Cat. No. sc-281692). After initial preparation devices were stained with DAPI (Molecular Probes, Cat. No. D1306), anti-cytokeratin (CK19) (Santa Cruz Biotechnology Inc., Cat. No. sc-33119) and anti-CD45 (Santa Cruz Biotechnology Inc., Cat. No. sc-1187) according to the standard confocal staining protocol. A coverslip was placed on top of each device and sealed before imaging. Confocal laser scanning microscopy images were obtained on a Nikon Eclipse T with coverslip corrected objective focused at 600X.
2.8. Device testing
The testing platform was set up on Signatone probe station. An Agilent 4156C semiconductor parameter analyzer equipped with a custom LabVIEW interface was used for monitoring the sensors and data collection. A 100 mV DC bias was applied to source electrodes and 0 V VG was applied using a Ag/AgCl reference electrode via the sample droplet, The source–drain current, ISD, was recorded for the duration of the test. The accuracy of the semiconductor parameter analyzer is 1 fA. The entire probe station assembly is placed on an optical table that is vibration isolated using air on all four legs. A metal box covers the entire assembly to avoid electromagnetic interference. The probes are connected to the parameter analyzer using a triaxial cable that is EM shielded. Throughout the testing the devices were maintained inside a humidified chamber to prevent evaporation of the sample droplet. The testing protocol started with a hydrated device topped by a 20 μl droplet of 1X PBS, which was placed immediately after functionalization. The bias was applied, and the sensor was monitored for the initial 4 min, then 5 μl droplets of the sample solution, plain or spiked blood, were pipetted directly into the standing 20 μl 1X PBS droplets. Devices were monitored for 360 s after addition of the sample solution. The total duration of one test was 10 min long. To compare results among devices, ISD data were normalized to obtain the G/G0 values for conductance. The sensor element was also imaged on an optical microscope to confirm the presence of cancer cells. The spiked donor blood samples consisted of 100 or 1000 MCF7/SKBR3/MCF10A cells per 5 μl per device for these experiments. The surface of the CNT device is capable of interacting with over 20 000 cells at one time, therefore fully capable of capturing 1000 or 100 spiked cells.
2.9. Statistical classifier
Statistical classification was done using DTW package in R. The sensitivity, specificity, and misclassification rate were then computed, considering spiked blood to be a positive test and normal blood to be a negative test. Sensitivity is defined as TP/P where TP denotes the number of positive test outcomes, and P denotes the number of true positives. Specificity is defined as TN/N where TN denotes the number of negative test outcomes, and N denotes the number of true negatives.
3. Results
3.1. The nanotube–CTC chip
Here, we describe a new philosophy in efficient capture of spiked cancer cells in blood using carbon nanotube micro-arrays ('Nanotube–CTC chip'). The chip consists of a 76-element array of carbon nanotube devices that are functionalized with anti-epithelial-cell-adhesion-molecule (EpCAM), anti-human epithelial growth factor receptor 2 (anti-Her2) and non-specific immunoglobin (IgG) antibodies. EpCAM is frequently overexpressed by carcinomas of breast, lung, prostate, colon, head and neck, and is absent from hematologic cells [18–20]. Similarly, Her2 is overexpressed in aggressive breast cancer and is prime candidate for targeted therapy and is absent from hematologic cells [21, 22]. For comparison, a non-specific IgG antibody was also functionalized to distinguish between specific and non-specific interactions.
The nanotube–CTC chip incorporates both detection and capture technology. The semiconducting nanotubes with PASE functionalized antibodies, when in contact with cells, create a change in electrical signature, which is recorded [23]. Figure 1 presents the schematic of the sensing technique.
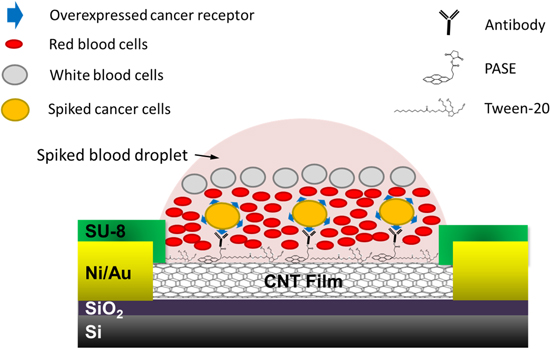
Figure 1. Schematic of the device for capture of cells spiked in blood.
Download figure:
Standard image High-resolution imageBiomolecular reactions are driven thermodynamically by the reduction in free energy of the system. For specific interactions, the reduction in free energy is higher than non-specific interactions [24]. One can use a spectrum of energy domains to transduce the change in the free energy of the specific interactions into mechanics, electricity, thermal or magnetism [24]. The measurement of specific versus non-specific binding events in cells as electrical spikes in a fast manner and the ability to stratify them rapidly in blood using DTW is a new method that enables both detection and capture on chip.

(negative ΔG is favorable).
Since the reduction in free energy is universal for specific and non-specific pairs, we hypothesize that this should be true for detection of specific versus non-specific interactions in cells. Extracellular overexpressed receptors, namely EpCAM and Her2, in breast cancer cells interact with the anti-EpCAM and anti-Her2 antibodies on the nanotube surface. The cooperative specific interaction of thousands of extracellular receptors with specific antibodies on nanotube surface creates spikes in the normalized electrical conductance versus time [23, 25–27]. Most CTC isolation technologies described before use anti-EpCAM antibodies to target the EpCAM receptor for cell capture and thus are examples of specific interaction. Capturing cells based on both EpCAM and Her2 can optimize CTC capture efficiency for breast cancer, as EpCAM expression in CTCs may be transient and dependent upon the local micro-environment [19]. Non-specific samples such as plain blood also create such spikes in the electrical conductance versus time data, with much lower slopes. The philosophy behind this work is whether such spikes in the signals could carry meaningful information about the sample condition/interaction that could then be analyzed using microscopy of captured CTCs [23].
In the nanotube CTC chip we have identified three different electrical signals: (1) the characteristic signals are classified as specific interactions that give rise to an increase in signal conductance followed by saturation at higher level of conductance; (2) non-specific interactions are characterized by a decrease in electrical signal or (3) no change in conductance, or at the same level as buffer. This type of classification enabled us to analytically distinguish between devices that showed positive versus negative responses in an array. A kernel-based classifier employing DTW was then used to classify the signatures that represented specific versus non-specific interactions [23]. These were classified with ∼90% sensitivity and ∼90% specificity in classifying devices specifically based on Her2 signatures for spiked SKBR3 (breast adenocarcinoma) cells in blood. While the classification is used to screen devices, the capture of cells is based on static isolation in a micro-array format followed by microscopy on chip.
The nanotube–CTC-chip uses static isolation technique for the capture of CTCs. At the heart of the chip is the 76-element micro-array that is fabricated using vacuum filtration and film formation of carbon nanotubes [28], clean room processing to form the micro-arrays with independently addressable electrical contacts, and SU8 layer passivation of the devices to expose only the active nanotube elements [23]. Figure 2(a) presents the optical image of the 76-element arrays, and figure 2(b) presents the array with the blood droplet spots. The source, reference and drain electrodes are identified. Figure 2(c) presents the schematic of the electrical test set-up for measuring change in conductance. Finally, figures 2(d) and (e) presents the test-setup with the sample on the probe station; the chip sits inside a chamber to prevent sample evaporation.
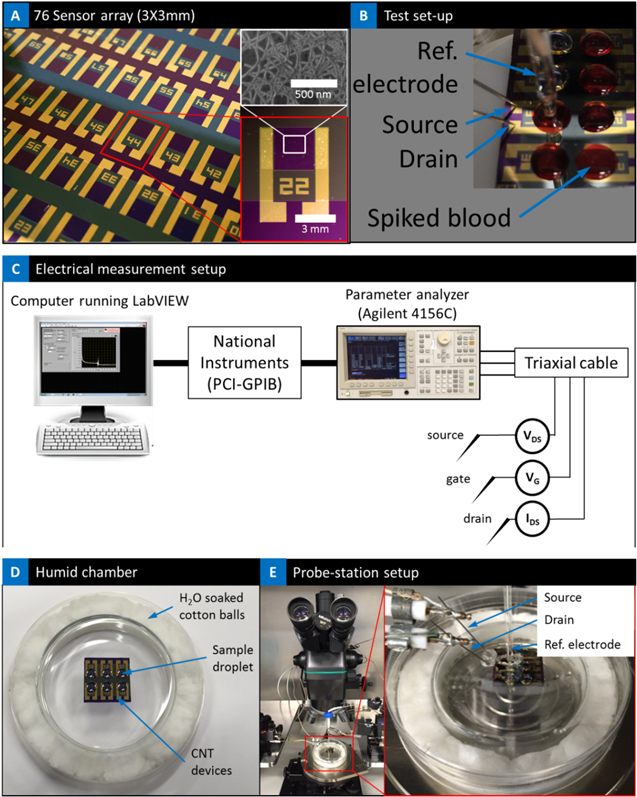
Figure 2. (a) 76-element micro-array; insert is the SEM image of the CNT and optical image of one of the sensors; (b) test set-up showing the blood droplet, source, drain and reference electrode; (c) schematic of the electrical measurement set-up; (d) humid chamber with the chip to prevent evaporation of droplet; (e) entire set-up under the microscope; magnified image shows the probes inserted into the humid chamber where the chip is kept for electrical measurement.
Download figure:
Standard image High-resolution imageThe arrays are fabricated using lithography, reactive ion etching and post-processing. These are described fully in our previous report [23]. We have fabricated three generations of devices consisting of 60-element, 76-element and 240-element arrays. With a 3 mm × 3 mm device size and at the rate of 5–20 μl per device, the 76-element arrays can process anywhere from ∼0.3 to 4.8 ml of blood, large enough to get meaningful information about the sample condition. Here we have used a total of ∼0.85 ml of blood and 170 elements, each analyzing 5 μl per device, in order to get a variety of information from this array using different antibodies. Past studies indicate circulating breast cancer cells in patients at a reported range of 50–300 000 ml [14, 29, 30], so, a drop of 5–30 μl would be expected to contain 1–9000 epithelial cells. It has also been reported that 1 g of tumor tissue (109 cells) sheds about 3–4 × 10⁶ tumor cells into the blood stream per day and thus presents clinical value in their enumeration [31]. The spike concentration of cells was chosen to be relevant to the upper limit of clinical samples, and as a proof of concept of this static isolation approach. The surface of the CNT device is capable of capturing over 80 000 individual cells/22 500 cell clusters at one time, therefore fully capable of capturing 100–1000 spiked cells. Similarly, arrays can be automated to handle more than 100 elements at the same time to enable results within minutes.
The chip consisting of the 76-element array of CNT micro devices was specifically designed for the need to process considerably large volumes of blood compared to the previous generation 60-element array where the active area was only 100 μm × 80 μm [23]. Each device in the 76-element array is 3 mm × 3 mm and can hold about 20 μl of blood. A larger CNT film area was elected to accommodate these tests. Similar to the first generation of CNT arrays [23], the 76-element second generation device consists of a simple two-terminal design at their core with a CNT ultra-thin film network connecting the source and drain electrodes. In this design, the sensing channel consists of a CNT network connecting the two electrodes, 3000 μm in length and 3000 μm in width. As a result, the sensing area of each device is  μm2, allowing for ∼80 000 cells, assuming an average 10–12 μm diameter, to be captured on the device. The sensing area becomes critical when we are considering processing blood samples due to their heterogeneity. CTCs are only slightly larger than leukocytes and therefore one needs to distinguish between them using microscopic techniques. One intriguing and unexpected observation we made in the static isolation device, is that blood cell types in the sample/droplet settle differentially due to the forces of gravity and surface texture, resulting in cells coming in contact and interacting with the carbon nanotube surface. Two elements that determine the cancer cell capture efficiency are the size of the droplet and the size of the active area of the device and the hydrophobicity of the CNT film. The ratio between the areas can enable tunable design of devices to capture a specific number of cells both in large and small volumes. The hydrophobicity of the CNT film can result in localization of the droplet. The initial observations on the optical microscope of cancer cell spiked blood sample droplets on top of the devices (as presented in later part of the paper) showed that the spiked cancer cells as part of their settling process bind directly on top of the CNT network established on silicon dioxide substrate, under a layer of red blood cells (RBCs). This differential settling phenomenon opened avenues to further attempts achieving better efficiency of spiked cancer cell capture in blood by functionalizing the nanotubes.
The 76-element array of nanotube devices used for the testing in blood were fabricated using a 6 μg CNT film. Past devices on 60-element arrays were fabricated using 4 μg film with an active area of 100 μm × 80 μm which gave a uniform distribution of the CNT network [23]. A higher relative film concentration was selected for the 76-element array devices with respect to the device size, 3 mm × 3 mm, to maintain a uniform, continuous, and conductive CNT network. The fabrication process and the characterization of devices with these CNT films are discussed elsewhere [23]. The nanotube elements are highly purified semiconducting CNT (Iso-semiconducting nanotubes, NanoIntegris LLC). The CNT devices had an average resistance of 0.2 MΩ after annealing, and average mobility was calculated for these thin film devices as ∼4.95 cm2 V−1 s−1, with a bandgap of 0.26–0.5 eV. The on–off ratio was determined for these devices using both back-gating configuration, Ion/Ioff = 11.2 (figure S3 in the online supplementary information), and also with electrolyte liquid-gating configuration Ion/Ioff = 134 (figure S3 in the online supplementary information). The on–off ratio decreases with increasing CNT mass and the mobility increases. The results suggest that there is an inherent trade-off between the on–off ratio and mobilities with increasing CNT mass. These suggest high quality of nanotubes and thin film transistor characteristics, in line with previous reports [28, 32].
3.2. Chemical functionalization
In the past, CTC capture techniques have relied on chemical functionalization of antibodies such as anti-EpCAM on top of microbeads [9–11] or microposts [12, 13]. Here we used carbon nanotubes that are highly compatible with functionalization chemistry to manufacture our devices. The nanotube device elements are chemically functionalized using sidewall PASE functionalization [33]. The side wall functionalization enables access to the π orbitals of the carbon nanotubes. The strong π–π interactions between the pyrene fragment of the PASE molecule and the nanotube surface creates a method for stable functionalization of carbon nanotubes [34]. The pyrene rings of the PASE adsorb on to the sidewalls of the SWNT through π stacking and produce a stable nanotube-PASE composite [23]. The succinimidyl ester on the other end of the PASE provides the attachment site for the antibodies [23]. Pyrene interacts strongly with the surface of carbon nanotubes of different chiralities, but the interaction with zigzag nanotubes (semiconducting) is stronger than with armchair (metallic) ones of the same diameter [34]. Recent work by our group has studied the gold nanoparticle targeting of carbon nanotube surface using PASE functionalization in detail and has shown the viability of using this method for antibody attachment and targeting cancer cells in buffy coats [23]. In this study we used the same functionalization method for antibody functionalization and testing in blood. Overall, the PASE enables sidewall functionalization, the ester provides attachment to the antibodies and enables stability over many weeks. Functionalized devices can be kept at 4 °C for 1–2 weeks and still maintain the integrity of the functionalization process.
3.3. Design of experiments
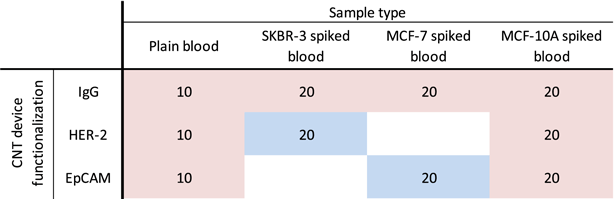
There are two main variables within the design of experiment in the array, sample type (plain blood and blood spiked with MCF7 (mammary gland adenocarcinoma), MCF10A (normal human mammary cells), or SKBR3 (mammary gland adenocarcinoma) cells and device type (IgG, anti-HER-2, or anti-EpCAM antibody functionalized device). In addition, two cell concentrations were defined for each cell spiked sample type, 100 or 1000 cells per 5 μl. Table 1 presents the design of experiments and the number of replicates. Over all there were 10 replicates for each combination, 10 replicates for 100 cells and 10 replicates for 1000 cells for each type of cancer cell spiking. Three cell lines of SKBR3, positive control (over expressing HER-2), MCF7, positive control (overexpressing EpCAM), and MCF10A, negative control normal epithelial cell line (not overexpressing HER2 or EpCAM), were cultured and prepared for these experiments. In addition to these three spiked cell types, plain non-spiked blood was also tested as the fourth sample type, a negative control, with each device type.
Table 1. Design of experiments.
|
CNT devices were divided into three groups; the first batch was functionalized with anti-HER2 antibody, the second batch was functionalized with anti-EpCAM antibody, and the third batch was functionalized with non-specific IgG antibody via PASE linker molecule as presented in figure 3 [23]. Tween-20 non-ionic detergent was adsorbed after functionalization to minimize non-specific adsorption to the non-functionalized CNT surface [23]. Figure 3 illustrates the variations of CNT device functionalization and sample types. In these experiments, there are 17 unique combinations within sample types, device functionalization, and cell concentration, with 170 technical array replicates, each holding 5 μl drops, resulting in 0.85 ml of blood processed in our array. Four combinations were designed as positive cases with specific interactions expected (SKBR3 spiked blood versus HER2 functionalized CNT device and MCF7 spiked blood versus EpCAM functionalized CNT device, both at 100 and 1000 cell concentrations), with 40 overall replicates, shown in blue in table 1. Thirteen other combinations shown in red were designed as negative controls (not spiked) or positive controls with non-specific interactions expected (SKBR-3 spiked blood versus IgG).

Figure 3. Schematic of the device functionalization using PASE; (b) sample types consisting of plain blood, SKBR3 spiked blood, MCF7 spiked blood and MCF10A spiked blood.
Download figure:
Standard image High-resolution image3.4. Electrical detection and zone classification scheme
Figure 4 presents the electrical sensing from specific and non-specific interactions in blood. Three types of signals were identified. SKBR3 spiked blood that was adsorbed on anti-Her2 antibody device produced a characteristic device signature with increase in signal conductance (figure 4(a)). Similarly, MCF7 cells spiked in blood and adsorbed on anti-EpCAM nanotube surface produced a rise in signal conductance (shown in figure 5). On the contrary, MCF10A cells spiked in blood produced a characteristic device signature that was either no change or led to a decrease in electrical signal (figure 4(b)). Finally, plain blood adsorption on the anti-Her2 functionalized device produced a decrease in the device electrical signal or stayed at the buffer level suggesting no change (figure 4(c)). The specific and non-specific signals were visually classified into these three groups: (1) 'Zone1' or an increase in the device electrical signal; (2) 'Zone 2' or no change and (3) 'Zone 3', decrease in device electrical signal.
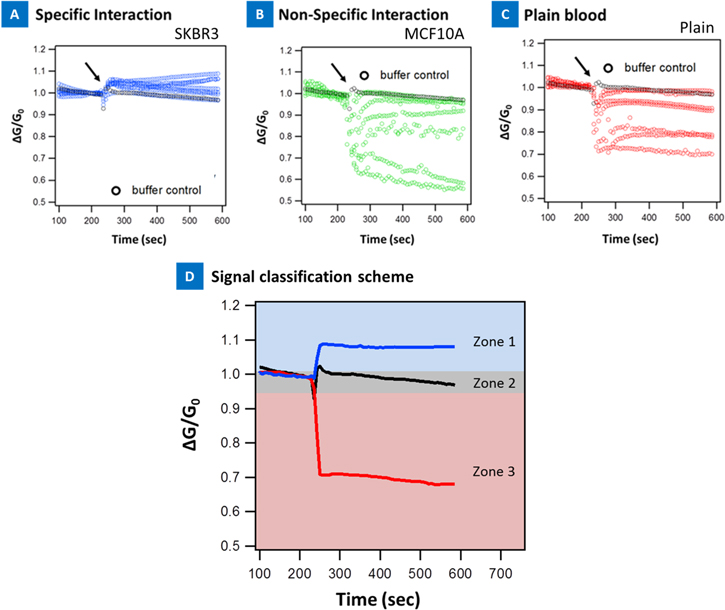
Figure 4. (a) Specific interaction: anti-Her2 functionalized device with 1000 SKBR3 cells spiked in blood; (b) non-specific snteraction: anti-Her2 functionalized device with 1000 MCF10A cells spiked in blood; (c) non-specific snteraction: anti-Her2 functionalized device with plain blood adsorption; (d) zone classification scheme of the electrical signals.
Download figure:
Standard image High-resolution image
Figure 5. Merger of device array data for 1000 cells/5 μl and 100 cells/5 μl variation using the zone classification scheme. The entire data can be divided into different experiments with both specific and non-specific interactions. (a) Data series based on 1000 cells spiked in blood; (b) data series based on 100 cells spiked in blood. Each panel correlates with one combination of sample type and device type with respect to design of experiment, 10 replicates each. Each row correlates to one type of device functionalization such as anti-HER-2, anti-EpCAM, and IgG. The top row represents the type of cells spiked namely SkBr3, MCF7, MCF10A. Plain blood samples are shown in red, MCF-10A in green, MCF-7 in orange and yellow, and SKBR-3 in blue. The control buffer signal is shown as the x-axis. The symbol (+) represents signal increase, (0) represents no change and (−) represents signal decrease.
Download figure:
Standard image High-resolution imageFigure 5 presents electrical signatures of 1000 cells/5 μl cell and 100 cells/5 μl cell concentration variation (all 170 elements classified by device type and sample type), collected during spiked blood experiments and classified according to the proposed scheme presented in figure 4(c). The entire data with all 170 data sets, 17 combinations, 4 positive controls and 13 negative controls, were defined in these experiments as they are presented in figure 5 and can be represented in one map that can enable fast analysis by a technician. For example, the signal rise is indicated by blocks that are in the increasing direction. For no change the blocks are at the x-axis level and for decrease, the blocks go in the negative direction. The data visualized in this manner presents an easy way to analyze the sample condition and is suitable for the clinic. The actual data is presented in figures S4 and S5 (online supplementary information) for the 170 datasets. Again, three types of signals were observed with respect to the buffer control: signal that increased, decreased, or did not significantly change with respect to the buffer control. It was observed that the majority of signals in all four positive controls were located in 'Zone1' showing an increase in device conductance, with respect to the buffer control. On the other hand the majority of the signals, 11 out of the 13, in negative controls landed in 'Zone 3', showing a decrease in their signal, device conductance, after addition of the sample droplet with respect to the buffer control. Online supplementary table S1 summarizes the zone classification results for all the data presented here. Overall, we observed that specific interaction indicated an increase in the device conductance whereas non-specific interaction resulted in a decrease or no change in device conductance. These results show great promise to discriminate spiked cancer cells in blood based on their effect on CNT electrical properties. All these results are also in line with our electrical signatures and classification of spiked cancer cells in buffy coats [23]. In all our experiments we noted that the detection specificity for anti-Her2 devices were better than anti-EpCAM devices in these blood experiments.
We also conducted protein experiments to ascertain our hypothesis using a streptavidin-biotin model system for signal rise. Figure S6 (online supplementary information) presents the normalized live response of six CNT devices, three functionalized with streptavidin (positive control in green) and three non-functionalized bare CNT devices (negative control in red). 5 μl of biotin solution, 1 ng ml−1 in 1 × PBS, was added to each device at 60 s and the electrical current of the device was recorded for the remaining 240 s. The functionalized devices current increased after biotin introduction suggesting negatively charged biotin molecules interacting with streptavidin is equivalent to applying a negative gate voltage, thus increasing the nanotube-complex device conductance [35, 36] while, the bare devices show no significant change. This indicates that the primary effect of the nanotube-streptavidin-biotin binding is a charge-transfer reaction [37].
In general, membrane potential of cancer cells are different from normal cells and recently they have been suggested as a valuable clinical biomarker for tumor detection [38].
Electrophysiological analyses in many cancer cell types have revealed a depolarized Vm that favors cell proliferation and new data suggest level of Vm has functional roles in cancer cell migration [38]. Vm changes because of alterations in the conductance of one or more types of ions. The Goldman–Hodgkin–Katz equation shows the Vm dependency on both the intracellular and extracellular concentrations of major ions (Na+/K+) [39, 40]. Thus interaction of specific antibodies to the extracellular receptors is bound to affect Vm. MCF7, MCF10A and SKBR3 cells have all negative resting potential. For example, the MCF7 potential was reported to vary from −58.6 to −2.7 mV with the cell cycle [41]. Extracellular EpCAM receptors on MCF7 cells interacting with anti-EpCAM antibodies on nanotube surface should thus lead to an increase in conductance of the nanotube-complex similar to negatively charged proteins [35, 36]. These suggests specific interactions are characteristically different compared to non-specific interactions and confirm our hypothesis [23, 25, 35, 36]. These studies are also in line with our previous studies on ƒ-EpCAM protein detection based on nanotube transistor devices [42], as well as cellular studies in PBS and buffy coats [23, 25].
Online supplementary table S1 summarizes the zone classification quantitatively. It is seen that all the specific interactions had maximum of 6/10 signals in 'Zone 1', whereas non-specific interactions had 9/10 signals in combination of 'Zone 2' and 'zone 3'. This suggest that this classification scheme may be highly useful in clinic, where one can define a threshold of at least 5/10 devices in 'Zone 1' as a 'diagnostic gray zone' which may indicate the presence of cancer cells in blood on the device. While online supplementary table S1 presents the quantifiable data, the blocks can also be added in each zone in figure 5 to come to the same conclusion. One can then further analyze the devices for cell capture using optical and confocal microscopy if the threshold exceeds 5/10 devices. It should be noted that some devices for specific interactions do not increase in signal. There could be several reasons such as nanotube network arrangement, poor PASE/antibody functionalization in some devices, devices irreversibly altering their electrical properties during the experiments in PBS and blood, all of which needs to be probed further in the future for better accuracy. We have not taken any of these into account and the results presented are directly from the testing without further modification.
3.5. DTW classification
In the past, we have developed a new philosophy of enabling DTW to classify electrical signatures in cells spiked in buffy coats in a blinded test with 91% sensitivity and 82% specificity [23, 42]. DTW is a dynamic programming algorithm that seeks to find an optimal global or local alignment of two series in the time domain to minimize the total distance between the series with respect to a traditional distance metric such as Euclidean distance metric. The DTW-distance can then be used as dissimilarity metric for developing kernel-based classifiers. A k-nearest neighbors kernel-based statistical classifier was developed using pairwise DTW-distances between samples. We chose to employ a kernel-based learning method as a parametric model for CTC evaluation has not yet been developed. In order to test whether the HER2 functionalized devices could discriminate between SKBR3 spiked blood samples and controls (plain blood and MCF10A spiked blood), a classifier was constructed and the area under the receiver operator curve (AUC) was estimated by 10-fold cross-validation (CV) [43]. Algorithm parameters and series normalization method were also determined by CV. The series normalization methods evaluated were: mean-variance normalization of the entire series, slope correction followed by normalization, and slope correction followed by scaling by the value at a fixed time-point. Mean-variance normalization was defined as  where
where  represents the mean of the ith replicate series and
  represents the standard deviation. Slope correction was conducted by fitting a linear model to the first 75 series sampling points to estimate the machine drift of the devices. In addition to evaluating slope correction followed by mean-variance normalization, slope correction followed by scaling the series by dividing by series value at a standardized time-point (50) was evaluated. Prior to normalization or scaling, the series were truncated to have length 150, with the length symmetric about the time-point of droplet deposition. Both high (1000/5 μl) and low (100/5 μl) concentrations of spiked cells were evaluated, separately. A total of 30 replicates (10 replicates with 1000 SKBR3 cells/5 μl spiked, 10 replicates with no cells added, and 10 replicates with 1000 MCF10A cells/5 μl spiked) were used in the construction of the classifier. To ensure balance between the SKBR3 positive condition and negative condition, a random sample of five replicates with no spiked cells and five replicates with 1000 MCF-10A cells/5 μl spiked was combined as SKBR3 negative. Whether the series observed with anti-HER2 antibody functionalized devices and SKBR3 spiked blood could be discriminated from IgG functionalized devices was then evaluated to determine if the anti-HER2 antibody and SKBR3 spiked blood resulted in a specific as opposed to non-specific antibody–antigen interaction.
CV-estimated AUC for the DTW distance based  classifiers for the high concentration of SKBR3 cells with anti-HER2 functionalized devices are shown in figure S7(a) (suppl.). The highest AUC for this condition was observed for the 1-nearest neighbor classifier with slope corrected normalized series. Class prediction using CV-estimation confusion matrix for high concentration SKBR3 cells is presented in table 2. AUC for discriminating a low concentration condition is shown in figure S7(b) (online supplementary). AUC for the discrimination tests between antibodies (anti-HER2 versus IgG) with SKBR3 cells spiked in blood is shown in figure S7(c) (online supplementary).
Table 2. Dynamic time warping: CV-estimated confusion matrix for 1000 SKBR-3 cells in blood.
| Predicted class | ||
|---|---|---|
| True class | Negatives (not spiked/MCF-10A) | Positives (SkBr3 spiked) |
| Negatives (not spiked/MCF-10A) | 9 | 1 |
| Positive (SkBr3 spiked) | 1 | 9 |
Devices functionalized with anti-HER2 antibody were able to discriminate between blood spiked with a high concentration of SKBR3 cells (1000/5 μl) and control blood (spiked with MCF10A cells, or not spiked, plain blood). 10-fold CV estimated AUC for the 1-nearest neighbor DTW-distance based classifier was 0.90 after slope correction and normalization. Table 2 presents the confusion matrix. One false negative and one false positive out of 10 positives and 10 negatives were observed in the CV procedure, showing a CV estimated sensitivity of ∼90% and specificity of ∼90%. Of the replicates identified as true positives, 6/9 series finished higher, 'Zone 1', after the rebound that followed droplet injection than the initial period, indicating a favorable ΔG; of the replicates identified as true negatives, 7/9 series finished lower, 'Zone 3' after the rebound that followed droplet injection than the initial period. While employing a kernel-based classification method was successful, developing parametric models that incorporate the theoretical patterns corresponding to expected Gibbs free energy change should be further pursued in the future.
Devices functionalized with HER2 antibody were unable to significantly discriminate (>50%) between blood spiked with a low concentration of SKBR3 cells (100 cells/5 μl) and control blood using a kernel-based classifier. However, we could analytically differentiate the signals as presented in table S1 (online supplementary information), suggesting this algorithm may not work well as has been done in many cases before for generating malignancy maps [44] based directly on the sensor signal without the need for an advanced classifier at low cell concentrations. We hypothesize that the deterioration of performance in using kernels based on DTW-distance for discriminating interactions is that at low cell concentrations archetypical patterns do not dominate each kernel in-spite of the existence of overall qualitative patterns. Consequently further studies comparing kernel-based classifiers to parametric models based on expected free energy change.
In general, we achieved good discrimination based on DTW from the cancer cell concentration of 1000/5 μl or 200 000 ml−1, which is at the high concentration end of the real patient range of 50–300 000 ml−1 [14, 29, 30]. In order to improve sensitivity towards more real world applications several solutions are proposed: (1) the device we used here were 3 mm × 3 mm size per device. A much smaller device could be expected to be more sensitive to few cells. Such a device could indeed be part of the array; (2) a parametric model based on change in free energy producing electrical signals could be developed that could be more accurate than DTW. Such a model can then be used in a training set classification and then be optimized for blinded study; (3) another solution to improve the detection sensitivity for low concentration of cells is to integrate the nanotube devices with a heater and investigate the protein denaturation and how they affect electrical signals. Essentially, this would be a nanotube differential scanning calorimeter with an electrical and temperature signal. Differential scanning calorimetry in the past has been applied to identify protein denaturation patterns, or thermograms, in blood plasma samples of cervical cancer versus controls. Plasma thermograms from patients suffering from a variety of diseases appear different in amplitude and denaturation temperature [45]. Cancer samples have been identified from controls in plasma with ∼97% classification accuracy based on Group classification methods compared to standard I-RELIEF method which only gives ∼73% classification accuracy [45]. We believe such a micro-array with integrated heaters and group classification algorithms can further differentiate and improve sensitivity of signal classification at very low cellular concentrations.
Fixing sample phenotype (blood spiked with 1000 SKBR3 cells) allowed for discrimination of antibody functionalization, anti-HER2 versus IgG functionalized device. Tenfold CV estimated AUC for the 1-nearest neighbor DTW-distance based classifier was 0.70 after slope correction and normalization (figure S7 (c) in online supplementary information). Based on the results from fixing the sample phenotype and separately device phenotype, we can suggest that the significant difference seen in electrical signal with our positive controls must be as a result of HER2 receptor, on the cell membrane, interaction with the anti-HER2 antibody on the surface of the nanotube device. These results are also in line with our previous blinded test studies on buffy coats [23] and gives us great confidence in the hypothesis that specific interactions are characteristically different from non-specific interactions and can be classified using nanotube-micro-arrays.
Figure 6(a) presents the heatmap of the between signal DTW distances for the signals used in the classifier employed for discriminating the high concentration of SKBR3 cells. In the margins of this figure a dendrogram of the complete-linkage agglomerative hierarchical clustering of the same is shown [40]. Within the clusters determined by the complete-linkage agglomerative hierarchical clustering there is evidence of sample type confusion however this confusion was reduced when considering 1-nearest neighbor kernels for classification. The kernel-based DTW classifier partitioned the SKBR3 spiked blood and controls (MCF7 spiked blood and non-spiked blood) suggesting specific interactions are quite unique in their electrical signatures compared to non-specific interactions and establishes a relationship between electrical conductance data with biological and possibly proteomic features (presence or absence of cancer cells in blood versus presence or absence of Her2). Figure 6(b) presents the Her2 clustering data. The classifier is thus able to naturally partition the SKBR3 cells in blood data overexpressing Her2. This type of clustering would potentially be useful for the clinic to stratify devices based on Her2/other receptor data.
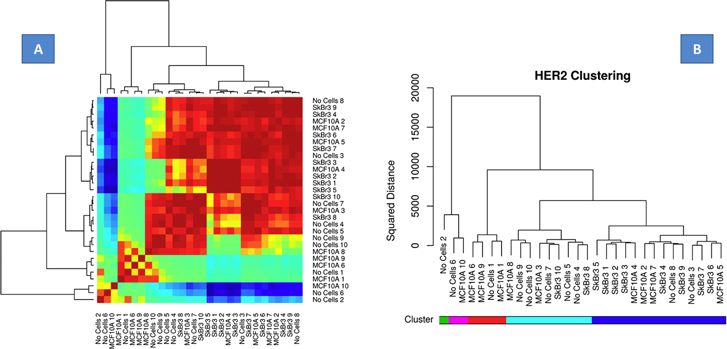
Figure 6. (a) Heat map. Summary of the relationship between electrical signatures and the cellular-proteomic features namely overexpression of Her2. The statistical classifier naturally partitions the blood, MCF10A spiked blood and SKBR3 spiked blood suggesting specific interactions are quite unique in their electrical signatures compared to non-specific interactions and establishes a relationship between electrical conductance data with proteomic features; (b) the Her2 clustering data suggest all SKBR3 cells in blood overexpressing Her2 clustered/partitioned together.
Download figure:
Standard image High-resolution image3.6. Optical microscopy and enumeration of CTCs
In a static blood sample/droplet the cells inside the blood start to settle immediately due to the forces of gravity, resulting in cells coming in contact and interacting with the base substrate surface. One can tune the surface interactions for efficient capture of CTCs. The initial observations on the optical microscope of cancer cell spiked blood sample droplets on top of the devices showed that the spiked cancer cells as part of their settling process get buried under RBCs and on top of the CNT network established on silicon substrate, getting sandwiched in between. Three examples of spiked cancer cell blood samples are presented in figure 7(a) at two different magnifications. Spiked cancer cells are observed in the blood and marked with an arrow, one can clearly observe the cancer cells buried under the RBCs and on top of the substrate. Cells that were imaged in 'Zone 2' in the spiked blood samples are also shown. The size, shape and the number of cells seen in 'Zone 2'is consistent with white blood cells (WBCs). A high concentration of RBCs is apparent on top of the marked cancer cells in 'Zone 1'. In figure 7(b), optical microscopy of plain blood sample is presented at the same two magnifications. There are no spiked cancer cells seen as the microscope is focused in 'Zone 1' plane. On the other hand, when the objective is focused on the 'Zone 2' plane, WBCs are apparent and come into focus in the image (right panel), floating above the RBCs. We have presented a model of differential settling in figure 7(c) in direct identification of spiked cancer cells and distinguishing from leukocytes using nanotube devices in an optical microscopy setting. Our results of the settling of cancer cells to the bottom is also consistent with the rise in electrical signal which could come from the interaction of the cell surface receptors with the antibodies on the nanotube surface. This self-enrichment process needs to be further studied by tuning nanotube network density, hydrophobicity, and functionalization process. Further, enhancement of enrichment can also be enabled through the presence of an electric field to separate the larger cancer cells displacing a volume in blood thereby changing the electric field. While these studies are beyond the scope of the current study, nevertheless these intriguing observations opens up new ideas and areas of study in optical microscopy of cells by tuning the surface interactions for CTC capture.
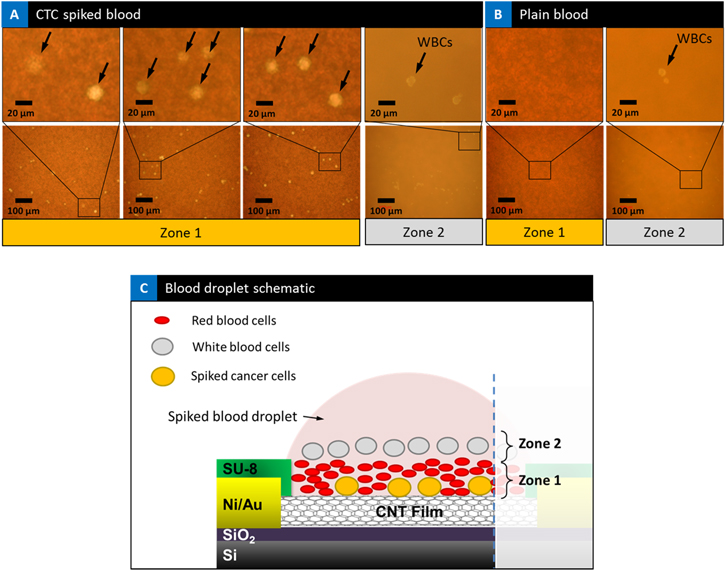
Figure 7. Cell capture: (a) optical microscopic images of spiked blood sample droplets on top of the device. Three devices of spiked cancer cell blood samples are shown. Spiked cancer cells are observed in the blood and marked with an arrow, one can clearly observe the cancer cells buried under the RBCs and on top of the CNT film. High concentration of RBCs is apparent on top of the marked cancer cells in 'Zone 1'. When the objective is focused on 'Zone 2' WBCs are seen in the spiked samples. (b) Plain blood sample. There are no cancer cells or WBCs observed in plain blood samples when the microscope is focused in 'Zone 1' plane. On the other hand when image is focused in the plane of 'Zone 2' WBCs are apparent in the image (right panel), floating above the RBCs. (c) Schematic illustration of mechanism of differential settling of blood sample on device observations under the microscope, showing the approximate arrangement of RBCs, WBCs, and spiked cancer cells and the classification of 'Zone 1' and 'Zone 2' accordingly.
Download figure:
Standard image High-resolution imageAs a result of our observations with regards to blood cell settling as illustrated in figure 7(c), we were able to image 'Zone1' and further analyze the captured spiked cancer cells using optical microscopy. A number of devices with 1000 spiked cells and 100 spiked cell samples were selected and their respective optical microscope images were taken. 20 devices imaged at 20× magnification, and 15 devices, imaged at 5× magnification, were selected for further processing and analysis.
3.7. Spiked breast cancer cell enumeration in blood
Figures S6(a) and (d) (online supplementary information) present an example set of 20× and 5× optical images taken for image analysis. ImageJ software was used to process each image. The histograms in each image presents the number of cells counted in each device. Original optical images were converted to binary images and processed using NIH ImageJ software to distinguish spiked cells, shown in black circles, from the RBCs in the background by using the color threshold function as presented in online supplementary figures S6(b) and (e). Next, ImageJ software's particle analysis function was used to count the number of cells and cell diameter for each set of images knowing the scale bar for each image (online supplementary figures S6(c) and (f). All the data from these analyses, including number of cells per image, cells per unit of area (mm2), diameter of cells, and number of cells per device calculated based on cell counts and total device area, 9 mm2, are presented in the histograms in online supplementary figure S8 and table S2. It should be noted that the imaging was done on only ∼62% active area of the device or the nanotube surface. In these experiments, blood did spread outside the active area of the device in some of the samples and CTCs in those areas were not counted, nor did they contribute to the electrical signal. These devices were initially designed for sensing experiments. An SU8 layer was used to isolate all the electrical layers except the active nanotube layer using an extra photo-lithography step. Even with only ∼62% active area of device imaged and counted, this resulted in anywhere between 342 and 1049 cells captured, using optical microscopy on the active area of the nanotube device, resulting in a capture yield (normalized to 62%) of 55%–100%. Even without normalization, the capture yield still represents 34.2%–100%. The slightly greater than 1000 cells counted is a result of small variations in cells counted in spiking experiments using a hemocytometer. This error is common and has been reported in other CTC reports [13]. The two different magnifications also give the same average number of cells counted per device, suggesting these are indeed spiked cancer cells.
Online supplementary figure S9 shows the reproducibility of our technique from device to device. 15 such devices are presented that were adsorbed with 1000 SKBR3 cells spiked in blood. We can clearly distinguish between 'Zone 1' and 'Zone 2' images. Zone 1 shows the presence of spiked cancer cells in all the devices. Similarly Zone 1 imaging of plain blood, no spiked cells are seen. The WBCs are also seen in the plain blood in 'Zone 2'. The images illustrate that blood does settle in all the devices in the same way and that this effect is reproducible. Online supplementary table S2 presents the quantitative data from these processed images at 20× and 5× magnification respectively. The tables suggest hundreds of cells are captured in each of the devices. In table S2, at 20× magnification anywhere from 342 to 1049 cells were captured in the active area suggesting a normalized capture yield of 55%–100% as mentioned before. The cell count data in table S2 indicate higher resolution and more accurate counts is possible in a small window area at the 20× magnification. The cellular diameters are also more representative. Online supplementary table S3 presents the 5× magnified cell count data. The cell count data in this table indicate one can get a more uniform distribution of the cell counts at the smaller magnification. Here, anywhere from 489 to 808 cells were captured, for a capture yield of 48.9%–80.8%. Since the active area of 62% was only imaged, this would represent a normalized yield of 78.8%–100%. The counts from both magnifications confirm the imaged cells are spiked breast cancer cells. Exceeding 100% is as a result of variation in spiking done manually using a hemocytometer as mentioned before [13]. Similarly, online supplementary figure S10 presents representative images of the cell capture data for 100 SKBR3 spiked cancer cells in blood. All the regions are seen, namely CTC in 'Zone 1' and WBC in 'Zone 2'. The spiked cancer cells were also 10 times sparser than the 1000 SKBR3 spiked blood images. These gives us confidence in the capture yield per device. Online supplementary table S4 presents the cell count data and the diameters of the captured cells. Anywhere between 43 to 107 cells were imaged and counted on the active area of the device, suggesting a normalized capture yield of 69%–100%. It should be noted that while the capture yield of 100% is seen, these are on an individual device level. Summing all the cell counts for the 20 devices presented in online supplementary table S2 suggest capture of 12 478 cells out of 20 000 cells spiked in 0.1 ml of blood or 62.39% capture yield, similar to the first CTC chip [12]. This yield can be further improved over 1 ml of blood quite easily in the future in the next generation device. While we only imaged 20 devices as a demonstration of the potential of this chip, in patient samples, one can image all the devices in 1 ml that can improve efficiency of cell enumeration. One can also improve capture efficiency per device by making the device area pad slightly larger to accommodate the entire 5–20 μl drop. Thus this novel idea presents a new design where capture yield can be controlled by changing the area of the pad to the area of the droplet, similar to controlling the flow rate in microfluidic devices. Finally, it should be mentioned the results in online supplementary tables S2, S3 and S4 suggest that we have achieved 100% yield in both 1000 and 100 cell spiked blood at different magnifications, suggesting that the imaged cells are indeed spiked cells. While we tested only SKBR3 cells spiked in blood for this study, the capture yield may also depend on the type and concentration of cell spiked and the free energy of interaction between antibody and the receptor on cell surface. These need to be investigated in the future.
3.8. Confocal microscopy
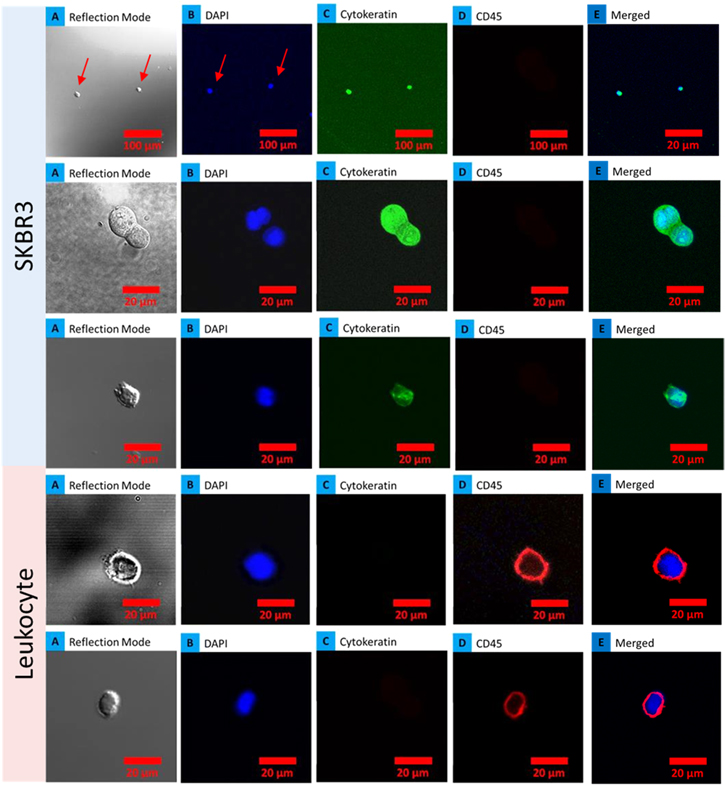
To confirm, the captured cells were indeed spiked breast cancer cells, four anti-HER2 functionalized devices with adsorbed SKBR3 spiked blood that gave positive electrical signatures were further analyzed using confocal microscopy. The samples were washed three times to assess binding of cells and stained for cytokeratin, CD45 and DAPI. Figure 8 demonstrates captured SKBR3 cells on the device stained for cytokeratin (CK-19 positive for epithelial cells and negative for hematological cells) and CD45 (negative for epithelial cells and positive for hematological cells). CTCs captured on the device were identified by staining with 4,6-diamidino-2-phenylindole (DAPI) for DNA content, and using rhodamine-conjugated anti-cytokeratin antibodies for epithelial cells, and fluorescein-conjugated anti-CD45 antibodies for hematologic cells. Cells captured by an anti-Her2 functionalized device that showed positive staining for CK-19 were identified as cancer cells, whereas CD45-positive cells were identified as leukocytes, as presented in figure 8. The morphologic characteristics exhibited by the captured cells were consistent with malignant cells, including large cellular size in the merged image. Single cells could be identified in the merged image, suggesting that the nanotube–CTC chip is a viable technique for identification of CTCs from leukocytes using cytokeratin and CD45 antibodies. In the future, an automated system could snap images of the chip at different places that were stained. Cells can also be removed from the active area of the device that gave positive electrical signatures for confocal microscopy and qPCR. Another way is to stratify all the devices that gave positive electrical signatures and remove all the cells from those devices and do confocal analysis in one step for enumeration. The ability to do staining and identify cancer cells from leukocytes shows the viability of this technology for CTC capture. We also noticed that most of the leukocytes were washed away, with only one or two remaining to be imaged. These results also suggest that the leukocytes were not bound to the nanotube substrate, in line with the model proposed on differential settling of blood.
Figure 8. Cell differentiation using confocal microscopy: SKBR3 cells captured on chips from three devices showing positive staining for DAPI, cytokeratin (CK-19) and negative for CD45 and two images of leukocytes captured showing positive for DAPI and CD45 while negative for cytokeratin. (a) Series of optical images; (b) DAPI nuclear stain; (c) CK19 stain for cancer cell and (d) CD45 for leukocytes and (e) merged image of nuclear and cytoplasmic stains.
Download figure:
Standard image High-resolution image
4. Discussion and outlook
It is well known that tumor cells circulate in the peripheral blood of all major carcinomas but not in healthy subjects or patients with non-malignant disease. Several approaches based on microfluidics and other methods as mentioned before have been reported for CTC capture and analysis. So far passive cell sorting in small droplets of blood in a micro-array format with integrated advanced classifiers has not been attempted to sort and enumerate CTCs in the manner we have proposed. There are several advantages to this type of approach including: (1) micro-array format, (2) on-chip microscopy, (3) analytical and DTW based statistical classification, (4) optical microscopy based enumeration, and (5) live viable cells that can be processed further for downstream analysis such as qPCR. The immuno-magnetic technology was the first to arrive in the market [9–11]. While impressive, the technology suffers from small numbers of CTCs isolated and low yield (∼20%–60% of patients) [9–11]. Compared to immunomagnetic technology, the CTC chip technology asserts ∼65%–80% yield using microfluidic technology based on the flow rate [12, 13]. Our work is new and unique in the introduction of static-micro-array isolation of spiked cancer cells in blood. The CNT is used to achieve electrical sensing as well as hydrophobic surface interactions for droplet localization where blood settles into different layers that can be analyzed using optical microscopy. PASE functionalization is unique to nanotubes and graphene and enables a non-covalent and stable functionalization methodology. Finally, DTW-distance kernel based classification is an advanced technique that shows viability of instant classification of the electrical signals that has not been employed in this area. Therefore this platform is quite unique and has potential for clinical translation.
One advantage is that our work shows the feasibility of classifying samples based on the device electrical signatures in short time frames (within few minutes), an important advantage in the clinic, considering that cells removed from their native microenvironment rapidly change their phenotype. Once classified, devices that gave positive electrical signals can then be sent to a laboratory for further validation such as qPCR. Even our analytical classification technique is quite useful and friendly for the clinic to be able to read the number of positives and negatives directly. With its capability for fast and sensitive cell capture, the nanotube micro-arrays has the potential to become a useful tool for CTC capture and enumeration and also studies related to drug screening and intracellular signaling [23].
Finally the presented nanotube–CTC chip is gentle in nature and allows for isolation of viable cells, whereas magnetic-bead-based approaches can only isolate fixed, non-viable cells [11]. Since this is a static isolation device, no shear forces are applied to the cells, unlike microfluidic devices that can encounter high shear forces at high flow rates. The leukocytes are also washed out quite easily compared to cancer cells on the nanotube–CTC chip, as the cancer cells are bound to the device on the bottom, compared to the leukocytes that settle on the top and therefore not bound to the device. Thus, there is no need to enrich the samples as this is a self-enrichment process. An important aspect of our technology that we have demonstrated is that blood fractionated into smaller volumes in a micro-array format can also give rise to more predictable and accurate results, similar to microfluidic technologies. One can enable a wide variety of experimentation within an array with different types of antibodies, thus potentially paving the way for an advanced device where CTCs expressing different receptors can be fished out in a single array, which cannot be done currently by a single microfluidic device. For example, it has been reported EpCAM expression is approximately 10-fold lower on CTC as compared to primary and metastatic tissues, suggesting that EpCAM expression is transient and dependent upon the local micro-environment [19]. Therefore it becomes important to look for more than one marker apart from EpCAM. The nanotube–CTC chip thus is advantageous in this sense due to the array approach to capture CTCs with different antibodies compared to single microfluidic device. One can also scale this technology even further for higher volumes (7.5–30 ml) by adding more elements to the array/changing device size and automation. The benefit of batch manufacturing is that these devices can be fabricated at low cost. One can also assemble an automated laboratory based system similar to the Veridex CellSearch system where a robotic arm can drop the blood samples simultaneously on number of devices, while measuring the electrical conductivity, instant classification using DTW-distance based/zone classifier, and conducting automated optical/confocal microscopy on chip at different depth of focus. The nanotube–CTC chip thus is capable of enabling higher information content both in detection and capture about the disease status has the potential for clinical translation with further testing in a clinical setting.
In summary, the nanotube–CTC chip is a detection and capture technology that captures large numbers of viable spiked breast cancer cells in whole blood without pre-labeling, pre-fixation, or any other processing steps. Blood can simply be adsorbed and electrical sensing and DTW classification can enable detection and stratification. Classified devices can then be analyzed using optical/confocal microscopy on chip. The techniques described here, namely static isolation in a micro-array format adds to the new philosophy of rare cell capture, which has not been investigated and shows promise for capture and study of CTCs.
Acknowledgments
Funding for this work was provided by the National Cancer Institute through grant R15CA156322 and 7 R15CA156322-02, NSF CMMI 1463869, NSF DMR 1410678; and NSF ECCS 1463987 to BP. Dr S N Rai is supported by Wendell Cherry Chair in Clinical Trial Research and generous support from Dr D M Miller, Director, James Graham Brown Cancer Center, University of Louisville.
Author contributions
FK and BP designed the experiments and wrote the manuscript. FK fabricated the devices inside a clean room and tested the devices for their electrical signatures in blood and spiked blood. FK also did the optical and confocal microscopy. SNR and PT designed and built the statistical classifier. PT and FK worked on classification of signals. GK and EW assisted with experimental concepts and discussions on clinical cancer management and cancer biology respectively.