

Abstract
We present a study on the properties of iron (Fe)-doped and carbon (C)-coated titania (TiO2) nanoparticles (NPs) which has been compiled by using x-ray diffraction (XRD), transmission electron microscopy (TEM), and x-ray photoelectron spectroscopy (XPS). These TiO2 NPs were prepared by using the flame synthesis method. This method allows the simultaneous C coating and Fe doping of TiO2 NPs. XRD investigations revealed that the phase of the prepared NPs was anatase TiO2. Conventional TEM analysis showed that the average size of the TiO2 NPs was about 65 nm and that the NPs were uniformly coated with the element C. Furthermore, from the x-ray energy dispersive spectrometry analysis, it was found that about 8 at.% Fe was present in the synthesized samples. High-resolution TEM (HRTEM) revealed the graphitized carbon structure of the layer surrounding the prepared TiO2 NPs. HRTEM analysis further revealed that the NPs possessed the crystalline structure of anatase titania. Energy-filtered TEM (EFTEM) analysis showed the C coating and Fe doping of the NPs. The ratio of L3 and L2 peaks for the Ti-L23 and Fe-L23 edges present in the core loss electron energy loss spectroscopy (EELS) revealed a +4 oxidation state for the Ti and a +3 oxidation state for the Fe. These EELS results were further confirmed with XPS analysis. The electronic properties of the samples were investigated by applying Kramers–Kronig analysis to the low-loss EELS spectra acquired from the prepared NPs. The presented results showed that the band gap energy of the TiO2 NPs decreased from an original value of 3.2 eV to about 2.2 eV, which is quite close to the ideal band gap energy of 1.65 eV for photocatalysis semiconductors. The observed decrease in band gap energy of the TiO2 NPs was attributed to the presence of Fe atoms at the lattice sites of the anatase TiO2 lattice. In short, C-coated and Fe-doped TiO2 NPs were synthesized with a rather cost-effective and comparatively easily scalable method. The presented analysis enables us to predict the excellent efficiency of these NPs for solar-cell and photo-catalysis applications.
Export citation and abstract BibTeX RIS
Introduction
The anatase phase of TiO2 has attracted considerable attention recently due to its excellent photocatalytic properties including high activity, good stability, nontoxicity and low cost [1]. It has also been proved to be a useful material in renewable energy and ecological environmental protection [2]. However, it is a wide band gap semiconductor (energy gap = 3.23 eV), which means that it only exhibits photocatalytic activity under UV light irradiation (λ < 390 nm). Consequently, the photocatalytic efficiency of TiO2 nanoparticles (NPs) with an anatase phase is low, because there is only a small portion of solar energy (approximately 5%) in the UV range compared to visible light (approximately 45%). Hence, an ideal semiconductor for photocatalysis applications will have band gap energy of about 1.65 eV in order to make use of the entire range of visible light. This is why many ways have been explored for improving the photocatalytic efficiency of anatase TiO2 [3, 4]. Most notably, one route has been adapted for improving the light absorption capability of anatase TiO2 by decreasing its band gap energy. The other route relates to retaining the anatase structure of the TiO2 NPs during their high temperature applications.
The doping of anatase TiO2 NPs with transition metals (TMs) is an excellent way to improve its light absorption efficiency. This method can potentially bring the band gap energy of anatase TiO2 as low as close to the lower end of the visible light energy spectrum. In fact, the doping of anatase TiO2 NPs with TMs results in the creation of additional energy states just below the conduction band [5–7]. Consequently, the coordination number of Ti ions in TM-doped TiO2 materials is found to decrease [8]. Nevertheless, this raises the question of which TM should be selected for the doping of anatase TiO2 NPs. There are a number of TM candidates which can be doped in an anatase TiO2 lattice in this regard. However, Iron (Fe) TM is the most promising candidate for this task since it introduces intermediate energy states to the bottom part of the band gap, and hence reduces the energy threshold for photo-ionization [6, 9, 10]. Even though it is well known that the optical band gap of anatase TiO2 NPs decreases with an increasing amount of Fe doping, about 10 at.% of Fe doping represents the upper limit. In fact, more Fe than this can result in the formation of other secondary phases in the TiO2 NPs. As mentioned earlier, the other line of research is focused on improving the photocatalysis efficiency of anatase TiO2 NPs for their high temperature applications. In this regard, the carbon coating of anatase TiO2 NPs provides a couple of advantages [11, 12]. First, it suppresses the phase transformation of anatase TiO2 to rutile TiO2 (r-TiO2) during the high temperature catalysis reactions. Second, it also helps in absorbing more visible light than the uncoated anatase TiO2 due to the porous nature of the carbon layer.
Cost reduction for the synthesis of advanced TiO2-based materials is important for making them viable for potential commercial applications. We have previously reported a cost-effective method for producing high quality anatase TiO2 NPs of different shapes and compositions [13–15]. This method for synthesizing the TiO2 NPs is based on the flame-combustion technique. In this report, we extend the method to the production of anatase TiO2 NPs which are both C-coated and Fe-doped. More importantly, the C coating and Fe doping were achieved along with the synthesis of the NPs. It is pertinent to mention herein that we selected the anatase TiO2 samples that were presumably doped with an upper limit of 10 at.% Fe. Hence, the band gap energy of the TiO2 NPs is supposedly close to 1.65 eV. In this way, the produced TiO2 NPs are expected to absorb light in almost the entire range of the visible spectrum. To confirm the quality of the C coating and Fe doping, characterization of the synthesized NPs was carried out with x-ray diffraction (XRD), a transmission electron microscope (TEM) [16] and x-ray photo electron spectroscopy (XPS). In light of the obtained results, it was concluded that the combination of these analysis techniques offer an excellent opportunity for the characterization of anatase TiO2 NPs.
Experimental methods
The synthesis of the C-coated and Fe-doped a-TiO2 NPs was done using multiple diffusion flames at atmospheric pressure. Titanium (Ti) tetraisopropoxide (TTIP) mixed with ferrocene dissolved in xylene was used to synthesize the C-coated Fe-doped a-TiO2 NPs. The precursor carrier gas flows through a central tube and the evaporator and precursor lines were heated to prevent any precursor condensation [13]. H2 was used as the fuel gas and oxygen (O2) diluted with argon (Ar) as the oxidizing gas. The synthesized NPs were collected on an aluminium (Al) plate downstream from the burner. The target of 10 at.% Fe doping in the a-TiO2 was achieved by using 20 ml h−1 flow of ferrocene mixed with TTIP in a chamber with the help of argon (Ar) as the carrier gas. Furthermore, oxygen (O2) gas was also introduced into the chamber at a flow rate of 2.6 ml h−1 to react with the ferrocene mixed with TTIP to synthesize the carbon-coated and Fe-doped a-TiO2 NPs.
X-ray diffraction (XRD) and TEM analysis of the C-coated Fe-doped TiO2 samples was performed to investigate their morphology, elemental composition and distribution, crystal structure phase, and dielectric and chemical properties. The TEM specimens were prepared by mixing powdered samples in ethanol and placing a small droplet (about 4 μl) onto carbon (C) copper (Cu) grids. These grids were then blotted from the back to remove the ethanol quickly so that clean specimens could be prepared for the TEM analysis. All the TEM investigations were carried out with a Titan 80–300 ST electron microscope (FEI Company) equipped with an extra-brightness field-emission gun, an x-ray energy-dispersive detector (EDS), an electron energy filter and a charge-coupled device (CCD) camera. The analysis was acquired by operating the microscope at 300 keV and involved setting the microscope in various modes, such as bright-field TEM (BF-TEM), high resolution TEM (HRTEM), selected area electron diffraction (SAED), valence electron energy-loss spectroscopy (VEELS), and energy-filtered TEM (EFTEM) modes, to gather specific information about the physical properties of the samples. For instance, a BF-TEM analysis in conjunction with EDS was utilized to determine the average size of the NPs, as well as their overall elemental composition. The BF-TEM and SAED analyses were used to determine the crystal-structure of the C-coated Fe-doped TiO2 NPs. HRTEM analysis allowed us to determine the structure and morphology of the C-layer present on the Fe-doped TiO2 NPs. The core loss EELS method also provided information on the elemental composition of the samples, which was compared with composition numbers determined by the TEM-EDS technique. This analysis also allowed us to analyze the orbital-p to orbital-d transitions occurring in the Ti-L23 and Fe-L23 edges, which provided information on the oxidation state of the Ti and Fe in the NPs [17]. The Ti and Fe oxidation states were determined by core loss EELS analysis and the acquired results were confirmed by performing XPS analysis on the same samples. The XPS studies were carried out with a Kratos Axis Ultra DLD spectrometer equipped with a monochromatic Al Kα x-ray source (hν = 1486.6 eV) operating at 150 W, a multichannel plate, and a delay line detector under a vacuum of 1 ∼ 10−9 mbar. The measurements were performed in hybrid mode using electrostatic and magnetic lenses, and with the take-off angle (the angle between the sample surface normal and the electron optical axis of the spectrometer) set at 0°. All spectra were recorded using an aperture slot of 300 μm × 700 μm. The survey and high-resolution spectra were collected at fixed analyzer pass energies of 160 eV and 20 eV, respectively. The samples were mounted in floating mode in order to avoid differential charging. Charge neutralization was required for the analysis of the sample. The binding energies were referenced to the graphitic sp2 hybridized (C=C) carbon for the C 1s set at 284.4.0 eV. The data was analyzed with the commercially available software program CASAXPS.
An EFTEM analysis of the samples was carried out to determine the spatial distributions of the Ti, O, C, and Fe elements in the NPs. This was carried out by operating the energy filter in EFTEM-mode, and the so called '3-window' method was employed to generate the elemental maps of the above-mentioned elements [18]. Finally, we applied a VEELS analysis of the samples to investigate the optical and electronic properties of the C-coated Fe-doped TiO2 NPs [19]. It is worth noting that the electronic properties determined by the VEELS analysis depend heavily upon the energy spread of the electron beam. In fact, for reliable results, it is highly desirable to keep the energy spread of the electron beam as low as possible (e.g. below 0.5 eV for 300 keV energy electrons). For this reason, the VEELS experiments reported in this paper were performed on another Titan 60-300 ST microscope, which was equipped with an electron beam monochromator. The electron beam monochromator allowed us to achieve an energy resolution of 0.25 eV. The acquired VEELS datasets were analyzed to determine the band gap, dielectric functions and joint-density of states (JDOS) of the C-coated Fe-doped TiO2 samples. All the TEM datasets were acquired and analyzed with the DigitalMicrograph software package, version GMS 1.85, from Gatan Inc.
Results and discussion
First, XRD and conventional TEM analyses were performed on the samples, and the results obtained from these techniques are shown in figure 1. XRD analysis, shown in figure 1(B), revealed that the diffraction peaks did indeed match the diffraction peaks for the anatase phase of TiO2 (a-TiO2). However, a small fraction (about 4%) of the rutile phase was also found to be present along with the a-TiO2 phase in the samples. Low-magnification TEM analysis was performed by recording the investigations on the sample at several magnifications, as well as by acquiring the corresponding EDS spectra. It was done this way so that a reliable statistical representation regarding the size and composition of the NPs could be established. A typical electron micrograph, along with its corresponding EDS spectrum, is shown in figures 1(A) and (C). The image in figure 1(A) contains several a-TiO2 NPs whose average size turned out to be about 65 nm. It can be noticed in figure 1(A) that the NPs are supported by perforated carbon; hence, the empty parts in the micrograph represent the 'vacuum'. NPs sitting in such places were deliberately chosen for the TEM analysis so as to minimize any contributions from the support carbon in the acquired results. This is why it can be stated with full confidence that the EDS spectra from the NPs in figure 1(A) did not make any contribution to the C-peak from the supporting carbon. The presence of a C-peak in the EDS spectrum presented in figure 1(C) thus confirms the presence of C along with other Ti, O, and Fe elements in the NPs. The presented EDS spectrum also contains a couple of extra peaks—notably at the energies of 8.15 keV and about 9 keV—which emanate from the Cu grids. The quantitative composition of the elements turned out to be 31 at.%, 57 at.%, 4 at.% and 8 at.% for Ti, O, C, and Fe, respectively, which is in agreement with the process parameters used for their synthesis. It was interesting to find out that not even 8 at.% of Fe resulted in the formation of iron-oxide phases such as α-Fe2O3. This is the case because no peak at the d-spacing of 0.27 nm was found to be present in either the XRD or SAED results. The absence of iron oxide formation in our samples was in agreement with the earlier reported studies on similar materials [20]. The ratio of Fe and Ti composition was determined to be close to 1/8, which implies that Fe was very likely present in the a-TiO2 NPs in the form of a Ti7FeO16 compound [6]. The presence of 8 at.% Fe also came close to our target of 10 at.% Fe doping in the a-TiO2 NPs. The presence of 8 at. % Fe in the a-TiO2 NPs hence implies that their band gap energy should be near the ideal value of 1.65 eV. It also indicates that the electronic and chemical properties of these NPs should be optimized with regard to their photocatalysis efficiency.

Figure 1. A BF-TEM and EDS analysis of C-coated Fe-doped TiO2 NPs. (A) A typical micrograph of NPs acquired at a relatively low magnification to show their size-distribution. (B) An XRD pattern from the C-coated and Fe-doped TiO2 NPs along with the reference patterns of both the anatase and rutile TiO2 phases. It can be seen that the experimental XRD pattern from the sample matched the anatase phase of the TiO2. (C) The corresponding EDS spectrum acquired from the region shown in figure 1(A). The acquired EDS spectrum confirmed the presence of both C and Fe along with Ti and O2 in the produced NPs.
Download figure:
Standard image High-resolution imageThe NPs presented in figure 1 were further analyzed at relatively higher magnifications in order to visualize their morphology rather more closely. The corresponding SAED patterns were also acquired and the obtained results are shown in figure 2. It can be noticed there that a C-layer about 3 nm thick exists around the a-TiO2 NPs. The corresponding SAED micrograph in figure 2(B) contains diffraction spots, implying that the synthesized a-TiO2 NPs result in a crystalline phase structure. The distance of these spots from the center represents the crystallographic inter-planar d-spacings and provides a direct way of determining the crystalline phase of the NPs. This analysis was performed on the SAED of figure 2(B), and the distances of these spots were found to be in the range of 0.350 nm, 0.245 nm, 0.193 nm, and 0.172 nm. These d-spacings turned out to closely match the (111), (220), (200), and (311) planes of the anatase phase TiO2 shown in figure 1(B). It can thus be inferred from the SAED results that the presence of about 8 at.% Fe in these NPs does not result in a significant change in the d-spacings of an a-TiO2 phase. It can also be concluded that most of the Fe intercalation in TiO2 NPs takes place at substitution sites as opposed to the interstitial sites. This further implies that the substitutional Fe doping in a-TiO2 NPs very likely results in the formation of a Ti7FeO16 phase of a-TiO2, while no interstitial Fe doping in TiO2 means that the structure of a-TiO2 NPs is closely packed and does not provide a favorable environment for the occurrence of interstitial defects [21]. The overall point noted from the results presented in figure 2(B) was that the high quality synthesis of C-coated and Fe-doped a-TiO2 NPs had been achieved by using flame synthesis.

Figure 2. A BF-TEM and SAED analysis of C-coated Fe-doped TiO2 NPs. (A) A BF-TEM micrograph showing a region that was used in acquiring the SAED. (B) The corresponding SAED pattern containing the diffraction spots, whose analysis shows that NPs possess an anatase phase.
Download figure:
Standard image High-resolution imageThe structure of the C-layer surrounding the NPs was investigated next by using the HRTEM technique, and the corresponding results are presented in figure 3(A), along with the calculated fast-Fourier transform (FFT) in figure 3(B). From the presented results, it was reconfirmed that the a-TiO2 NPs were indeed coated with a continuous and uniform C-layer 2–3 nm thick. Besides this, only with the help of the HRTEM technique was it found that the C-layer was present in the form of a partially graphitized carbon phase. This conclusion was drawn after it was found that the distance between the observed lattice fringes in this layer was close to 0.33 nm, which corresponds to the (002) planes of the graphitized carbon phase. In addition to this, the HRTEM analysis allowed us to visualize the crystal structure of the NPs, showing the excellent quality of their crystalline growth. The spatial frequencies present in the corresponding FFT also matched the d-spacing of the anatase phase of the TiO2, and thus corroborated the observations noted from the SAED pattern in figure 2(B). The observations made in figure 3 underline the fact that the HRTEM analysis not only allowed the determination of the crystal structure of the NPs, but also enabled the direct visualization of the crystalline phase.
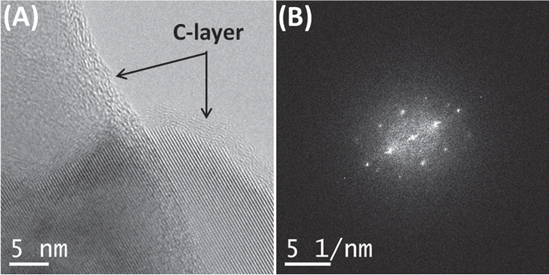
Figure 3. An HRTEM analysis showing the structure of the C-layer and its interface with Fe-doped TiO2 NPs. (A) An HRTEM micrograph showing the C-coating of a couple of Fe-doped TiO2 NPs. (B) The corresponding calculated FFT containing the spatial frequencies was found to match the d-spacings of the anatase TiO2.
Download figure:
Standard image High-resolution imageThe results presented so far provide indirect information on the spatial distribution of all the elements present in a-TiO2 NPs. An accurate determination of the distribution of elements with NPs is important for understanding their photocatalytic properties. The EFTEM method in a TEM allows a direct way to visualize the elemental distributions of the elements in a sample, and was hence also applied to these a-TiO2 NPs. The acquired EFTEM results are shown in figure 4. The presented elemental maps directly prove the uniform elemental distribution of Ti, O, and Fe in the NPs. On the other hand, the distribution of C was only found to surround the NPs. The thickness value of the C layer again matched the value determined using the HRTEM results shown in figure 3. It is important to note that the doping of C atoms on the surface of a-TiO2 NPs is likely—as has been reported earlier [14]—and hence cannot be ruled out in these ones. So, the EFTEM method has limitations in being unable to address the C doping on the surface of a-TiO2 NPs. Nevertheless, it is contended from the results shown in figure 4 that EFTEM mapping analysis is duly capable of providing high quality results on the distribution of elements within their domains.
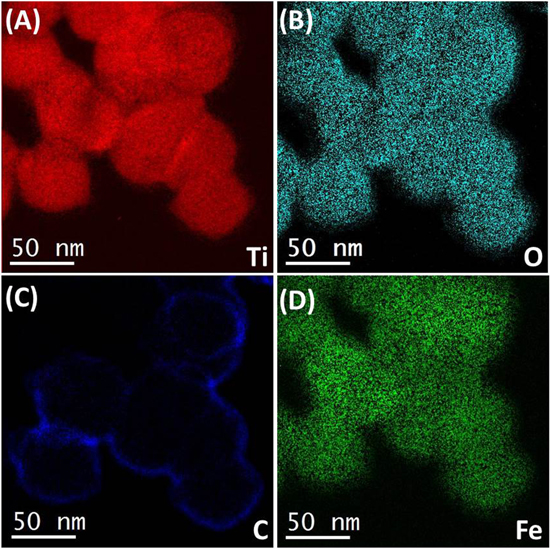
Figure 4. An EFTEM analysis of C-coated and Fe-doped TiO2 NPs given in figure 2(A). (A) Ti elemental generated by using a Ti-L23 edge at an energy loss of 456 eV. (B) O elemental generated by using an O-K edge at an energy loss of 532 eV. (C) C elemental generated by using C-K edge at an energy-loss of 283 eV. (D) Fe elemental generated by using Fe-L23 edge at an energy loss of 710 eV.
Download figure:
Standard image High-resolution imageThe analysis of a-TiO2 NPs introduced so far clearly demonstrates that Fe has been incorporated into the bulk, while C has been coated onto the surface. It is thus highly relevant to enquire about the oxidation state of Fe in the a-TiO2 NPs. The proposed oxidation state analysis would provide information on the environment of the Fe atoms in the unit cells of the TiO2, and could hence help in explaining the physical and chemical properties of a-TiO2 NPs. With regard to the oxidation state analysis of the TM elements, quick but reliable information can be gathered from the core loss EELS spectra containing white lines at their energy loss edges. The core loss EELS analysis thus enabled us to obtain the chemical states of the Ti and Fe metals by analyzing the ratios of their L3 and L2 white lines [17, 19, 22]. It is important, however, to confirm the acquired results of the oxidation states by employing a technique—such as XPS—capable of providing the same results independently. The core loss EELS results, which were acquired by setting the microscope in TEM-diffraction mode, are shown in figure 5. It was done this way because the TEM-diffraction mode enabled us to have superior quality core loss edges in the acquired EELS spectra. The analysis of the core loss EELS spectrum presented in figure 5 provided a couple of findings about a-TiO2 NPs. First, it confirmed the elemental composition of the samples determined earlier by using the EDS analysis of figure 1(C). Second, it allowed us to determine the oxidation states of the Ti and Fe elements in the a-TiO2 NPs. This was done by calculating the ratios of the L3 and L2 white line signal appearing in their L-edges. The analysis of the Ti-L23 white lines present in figure 5(B) was performed in this manner, and the outcome was 0.82, which was compared with the ratio of the white lines reported in the literature [18]. It was found that the oxidation state of Ti was +4 in the a-TiO2 NPs. Similarly, another method described in the literature was followed for the calculation of the Fe-L3 to Fe-L2 ratio [17]. The ratio of Fe-L3 to Fe-L2 peaks turned out to be 3.8, which was attributed to the presence of Fe in the +3 oxidation state. The combined results of the oxidation states of the Fe and Ti metals indicate that the Fe occupies a lattice site in the a-TiO2 crystals, and hence leads to a decrease in the charge state by +1 unit. The Fe+3 atom then acts as an electron trap so that the photo-generated charge carriers are temporarily separated more effectively [23].
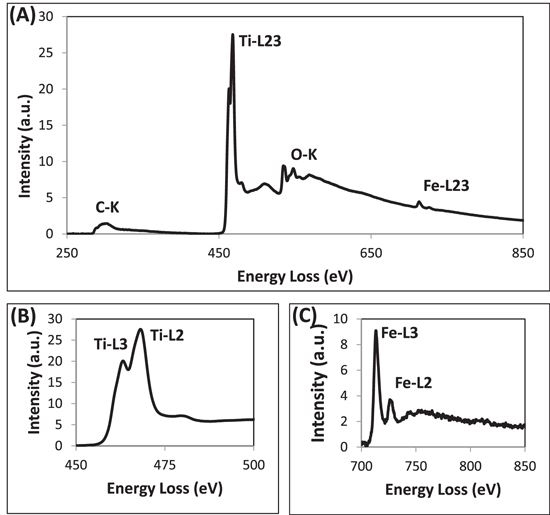
Figure 5. A core loss EELS analysis of the C-coated Fe-doped TiO2 NPs. (A) A typical background-subtracted EELS spectrum which contains the edges of all four elements present in the NPs. (B) A white line analysis of the Fe-L23 edge for determining the oxidation state of Fe. (C) A white line analysis of the Ti-L23 edge for determining the oxidation state of Ti.
Download figure:
Standard image High-resolution imageIt is worth noting that the oxidation states of Ti and Fe determined by the core loss EELS represented regions of about 100 nm in size. Such a small-scale sample of TEM results may lead to incorrect deductions, so the samples must be analyzed with a technique capable of providing results from much larger regions, in order that their bulk-scale properties can be linked to their corresponding nanoscale properties. As mentioned earlier, the XPS technique provides an excellent way of confirming the oxidation states determined by applying the method of core loss EELS. This is why the XPS technique was utilized to determine the Ti and Fe oxidation states in these samples as well. The acquired results are presented in figure 6, and it can be seen that a small amount (<2%) of Ti was in the +3 oxidation state, even though the core loss EELS entirely showed a +4 oxidation state for Ti. This small difference in the EELS and XPS results on the oxidation state of Ti was due to the larger sampling ability of the latter technique. On the other hand, the oxidation state analysis for Fe by using XPS showed only the presence of the +3 value for Fe. This finding nicely matches the EELS results, indicating that Fe was present in the +3 oxidation state in the entire sample.

Figure 6. A high-resolution XPS analysis of the C-coated Fe-doped TiO2 NPs. (A) A peak-fitting analysis of the Ti 2p signal revealing the presence of Ti predominantly in the Ti+4 chemical state. (B) A peak-fitting analysis of the Fe 2p signal revealing the presence of Fe only in the Fe+3 chemical state.
Download figure:
Standard image High-resolution imageOnly the atomic scale properties of the a-TiO2 samples have been addressed so far. The effect of these on the nanometer-scale optical and electronic properties was in fact the main objective of this study, because these underpin the macroscale properties, including photocatalysis. The nanoscale properties are investigated using the valence EELS (VEELS) technique in a different TEM instrument equipped with the ability to monochromatize electron beam energy. In this way, the VEELS experiments were carried out using a monochromatized electron beam, whose energy spread was reduced to 0.25 eV from a typical value of 1.25 eV. Figure 7(A) contains a typical VEELS spectrum acquired with a monochromatized electron beam. The zero-loss peak (ZLP) from the VEELS spectrum was removed by using the reflected tail method for determining the fraction of inelastically scattered electrons (figure 7(B)). The inelastic scattering of electron beams can be expressed with the dielectric-function formulation, which hence allows us to determine the optical and electronic properties at nanoscale. For example, the onset for band-to-band transition in a low-loss EELS spectrum, which is called band gap energy, can be determined from the inelastically scattered signal. It is often extracted by applying the linear extrapolation of the leading edge to the background level. This process is shown in more detail in figure 7(C). It can be seen that the horizontal line 1 sets the background level. Line 2 in figure 7(C), which represents the band gap energy of materials, was at a tangent to the onset of the inelastic signal increase. However, the band gap energy is generally measured by drawing a perpendicular line 3 through the intersection of lines 1 and 2, and this normally results in a more precise number for the band gap energy. By applying this scheme, it was possible to note that the band gap energy of the samples turned out to be around 2.2 eV. This matched nicely with the theoretical prediction of about 8 at.% Fe doping in a-TiO2 in the form of an Fe+3 valence state [6]. It is inferred that Fe doping led to the lowering of the band gap energy of the a-TiO2 NPs by introducing shallow energy states below the conduction band [6]. The band gap energy of 2.2 eV also validated the calculations on the oxidation states of the Fe and Ti elements, determined by utilizing the analyses presented in figures 5 and 6, respectively. In the wake of these observations, it was postulated that the Fe+3 atom replaces the Ti+4 atom in the unit cell of TiO2 and forms a shallow charge trapping site near the conduction band of the TiO2 matrix [24, 25]. This results in the formation of p-type a-TiO2 NPs, which is considered to be useful for photocatalysis applications. Kramers–Kronig analysis (KKA) was generally applied to the inelastically scattered signal in figure 7(B) in order to obtain both the real ( 1) and imaginary (2) parts of the dielectric function (). Moreover, 2 can be used to determine the joint density of states (JDOS) [26]. This analysis was carried out as well, and the determined JDOS as a function of energy loss is shown in figure 7(D). It was learned from these results that the JDOS of C-coated and Fe-doped a-TiO2 NPs obey the same dependence on energy as that of Ti-3d orbitals, although the JDOS in the vicinity of the 2 eV energy loss was somewhat modified from the shape of the Ti-3d orbitals, and this has been attributed to the Fe-3d orbitals.

Figure 7. A VEELS analysis of C-coated Fe-doped TiO2 NPs. (A) The ELF extracted by removing the ZLP from its corresponding VEELS spectrum. (B) The real part of the dielectric function (epsilon-1) calculated by applying KKA to the ELF shown in (A). (C) The imaginary part of the dielectric function (epsilon-2) calculated by applying KKA to the ELF shown in (A).
Download figure:
Standard image High-resolution image
Conclusions
The synthesis of C-coated and Fe-doped a-TiO2 NPs has been achieved by using the flame combustion method. This method allowed the synthesis of the NPs in one step, and is hence expected to be cost effective compared to competing methods. By using this method, we were able to produce high quality a-TiO2 NPs, as confirmed by comprehensive XRD, TEM and XPS analyses. Specifically, the TEM analysis revealed that the synthesis parameters adapted in this paper result in excellent quality a-TiO2 NPs. With the help of an SAED analysis of the NPs, it was proved that they have a high degree of crystallinity. Furthermore, with the help of EDS analysis, it was shown that their elemental composition is close to the target values for all four elements. The EFTEM mapping technique turned out to be essential for determining the elemental distributions of all four elements present in the NPs. Similarly, the core loss EELS technique provided the quantitative results on the elemental compositions with a high degree of accuracy. Moreover, the analysis of the Ti-L23 and Fe-L23 peak ratios present in the core loss EELS spectra provided accurate information on the valence states of the Ti and Fe elements. Finally, the VEELS analysis provided an opportunity to study the optical and electronic properties of the samples. In this way, we were able to correlate the nanoscale properties to the large scale properties of the synthesized samples. Finally, we conclude that the C coating and Fe doping of anatase TiO2 NPs is expected to enhance the ability of a-TiO2 NPs to absorb more light in the visible range. Hence, we propose that C-coated and Fe-doped samples will perform excellently in solar energy and photocatalysis applications.
Acknowledgments
The authors are thankful to KAUST for providing research support. The authors also greatly appreciate Mr N Metge for editing the manuscript in order to enhance its readability.