
Abstract
An activated carbon material derived from waste coffee grounds is shown to be an effective and stable medium for methane storage. The sample activated at 900 °C displays a surface area of 1040.3 m2 g−1 and a micropore volume of 0.574 cm3 g−1 and exhibits a stable CH4 adsorption capacity of ∼4.2 mmol g−1 at 3.0 MPa and a temperature range of 298 ± 10 K. The same material exhibits an impressive hydrogen storage capacity of 1.75 wt% as well at 77 K and 100 kPa. Here, we also propose a mechanism for the formation of activated carbon from spent coffee grounds. At low temperatures, the material has two distinct types with low and high surface areas; however, activation at elevated temperatures drives off the low surface area carbon, leaving behind the porous high surface area activated carbon.
Export citation and abstract BibTeX RIS
Corrections were made to this article on 4th September 2015. Affiliation information was corrected for K Christian Kemp and M Meyyappan.
1. Introduction
The rise in anthropogenic gases is leading to climate change with unknown consequences. Consequently, there is a move towards green fuels with the ultimate goal of a hydrogen economy. Compressed natural gas is a cleaner burning fossil fuel compared to traditional automobile fuels [1, 2]. One component of this compressed natural gas is methane, which has the potential, in its pure form, to be a clean fuel source for vehicles. Additionally, methane can be used in certain types of fuel cells [3, 4]. The use of methane in these applications should lead to a decrease in CO2 emissions, which if widely applied could curb the related climate change [5]. Methane itself is an anthropogenic gas, and as such its storage, capture and use would lead to a reduction in climate change.
Methane is traditionally stored in compressed gas cylinders and this system of storage is dangerous and heavy. Therefore, low-weight adsorptive materials have recently received attention for methane storage at lower pressures; for example, polymers, covalent organic frameworks (COFs), metal organic frameworks (MOFs) and carbon-based materials [6–9]. Among them, carbon-based materials are ideal candidates for methane and other gas capture/storage as they are light, durable and relatively cheaper to produce [10–12]. In fact, the cost of carbon-based materials used in methane adsorption can be further reduced if the carbon source is readily available and of no inherent value, i.e. waste material. This has been demonstrated by multiple groups, who have used various carbon sources such as waste tires [13], lignin [14], cocoa shells [15], siriguela seeds, and grape seeds [16] to prepare activated carbons for the adsorption of SO2, H2S, methane, α-lactalbumin, bovine serum albumin, organic dyes, etc.
Here, we discuss the use of activated carbon derived from spent coffee grounds for stable methane storage. The KOH infiltration method employed is a one-pot method which does away with the need for filtration of excess KOH from the sample, thereby saving time and chemical costs. We show that coffee grounds chemically activated using KOH at 900 °C under an Ar atmosphere (AMC-900) exhibit the maximum methane total adsorption capacity as well as a maximum BET (Brunauer, Emmett and Teller) surface area of 1040.3 m2 g−1. Interestingly, this AMC-900 material displays an almost constant maximum total adsorption capacity of ∼4.2 mmol g−1 over a 20 K temperature range (288.15 to 308.15 K) at 3.0 MPa. Additionally, the AMC-900 material shows an impressive H2 total adsorption capacity of 1.75 wt% at 77 K and 100 kPa. Lastly, we present a temperature-dependent mechanism for the formation of activated carbon from the source coffee grounds.
2. Experimental section
2.1. Chemicals
Spent coffee grounds (Kirkland, 100% Colombian coffee, dark roast fine ground) were obtained in house. KOH was purchased from DeaJung Chemicals and used without further purification. All gases used in this study were obtained from Linde and were of high purity (99.99%). Deionized water was used to prepare all KOH solutions as well as for washing purposes.
2.2. Synthesis
Approximately 100 g of spent coffee grounds were added to 100 ml of a 7 M KOH solution. The mixture was stirred at 65 °C for 24 h and the resulting viscous solution was poured into a crystallization dish. The solution was then heated at 100 °C to drive off excess water to leave a well-mixed coffee grounds/KOH solid which was stored for activation.
The solid product was activated by annealing under an Ar atmosphere for 1 h at the desired temperature (700–900 °C), designated AMC-700, AMC-800 and AMC-900. The ramp rate used for all activation experiments was 7 °C min−1. Attempts to activate the sample at higher temperatures (1000 °C) to possibly obtain higher surface area lead to the destruction of the quartz tube. Subsequently, oxygen entering from the atmosphere into the system resulted in combustion of the sample. The reasons for this destruction process are not fully known and were not investigated further, but the destruction was possibly due to the dissolution of the quartz framework by molten KOH [17, 18]. After activation, the sample was suspended in deionized water and then filtered. The as-obtained precipitate was subsequently washed twice with deionized water to ensure removal of excess KOH. This sample was dried overnight in an oven at 80 °C and then stored for further analysis.
2.3. Material characterization
Raman spectra were obtained using a Bruker Senterra Raman microscope with a 532 nm laser excitation source. SEM images were obtained using a FEI (USA) Nanonova 230 with 10.0 kV electron beam and 10 mA emission current. FTIR spectra were obtained using an Agilent (USA) 670-IR; the samples were prepared by pelletizing them in a KBr matrix and the FTIR spectra were measured over a wavenumber range from 400 to 4000 cm-1. XRD patterns were obtained using a Bruker D8 Advance with 3 kW x-ray generator power and 2θ range of 10° to 60°.
2.4. Gas adsorption measurements
CH4 and H2 adsorption/desorption measurements were performed using a Belsorp mini II (Japan) device. The samples were treated at 200 °C under vacuum for 12 h prior to each measurement. BET surface area and pore size were calculated from N2 adsorption–desorption isotherms measured at 77 K. CH4 adsorption/desorption isotherms for all samples were measured at 273 K up to 100 kPa. H2 adsorption/desorption isotherms were obtained at 77 K up to 100 kPa. In addition, just for the AMC-900 sample, methane storage was investigated up to 3.0 MPa at 288, 298 and 308 K using the same procedure as above. In all cases, the samples were exposed to two separate adsorption cycles with no pre-treatment between cycling in order to demonstrate the reversibility of the process.
3. Results and discussion
3.1. Sample characterization
SEM images of the as-prepared AMC samples, which are shown in figure 1, exhibit a morphology typical of other activated carbon materials [16]. The samples at all activation temperatures show a similar morphology, which indicates that variations in gas adsorption capacity are probably due to textural factors not discernible in SEM images (see table 1 on porosity characteristics to be discussed later). The observable pores in figure 1 and the characteristics in table 1 suggest that this material may also be useful in capacitors or Li-ion battery devices [19–21].
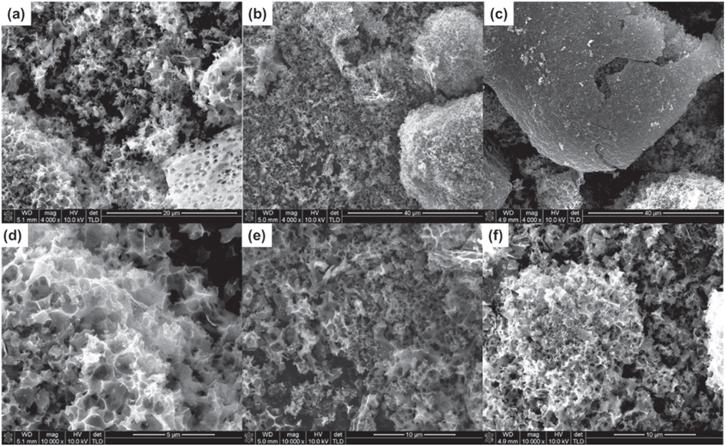
Figure 1. SEM images of the AMC samples (a), (d) AMC-700, (b), (d) AMC-800 and (c), (e) AMC-900.
Download figure:
Standard image High-resolution imageTable 1. Textural properties of the activated carbon samples.
| SA (BET) | Vtota | Vmicrob | V0.6c | (Vmicro/Vtotal)d | (V0.6/Vmicro)e | |
|---|---|---|---|---|---|---|
| (m2 g−1) | (cm3 g−1) | (cm3 g−1) | (cm3 g−1) | ×100 | ×100 | |
| AMC-700 | 536.5 | 0.320 | 0.286 | 0.218 | 89.4 | 76.2 |
| AMC-800 | 815.2 | 0.498 | 0.437 | 0.238 | 87.8 | 54.5 |
| AMC-900 | 1040.3 | 0.635 | 0.574 | 0.272 | 90.4 | 47.4 |
aTotal pore volume (Vtot) calculated using the BET method. bMicropore volume (Vmicro) calculated using the NLDFT method. cVolume of the 0.6 nm micropores (V0.6) calculated using the NLDFT method. dThe percentage of the total pore volume that is microporous. eThe percentage of the micropore volume that consists of micropores 0.6 nm in diameter.
Raman spectra for the AMC samples are shown in figure 2 where the typical G, D and 2D bands expected for a carbon-based material are seen [22]. However, the bands exhibit overlap with no clear separation of Raman bands as would be expected in disordered activated carbons. This overlap between the D and G bands is partly removed with higher activation temperatures as seen for the AMC-900 sample, yet the peaks are still not clearly separated. For this reason, we conducted deconvolution of the 1000 to 2000 cm−1 region to tease out more information regarding the AMC sample structure (see figure 2 and S1 and table S1) [23]. Deconvolution into two separate bands (figure S1) shows that the D and G bands of the samples are centered around ∼1350 and ∼1577 cm−1, respectively. The calculated ID/IG values from these peaks are 2.45, 2.44, and 1.68 for the AMC-700, AMC-800 and AMC-900 samples, respectively. As the activation temperature increases, the disorder of the sample decreases since graphitization of the sample increases at higher temperatures; this agrees with the values calculated for the IG2/IG1 ratio which can be used to determine the amount of disorder in bond angles [23]. The IG2/IG1 ratio can be calculated by deconvoluting the G and D bands into G1, G2, D1 and D2 bands (figure 2). This ratio decreases as the activation temperature increases due to thermal relaxation, with a large relative IG2/IG1 value indicating a relatively large amount of disorder in the bond angles. Thus, an increase in activation temperature leads to an increase in bond order, which is expected with an increase in graphitization.
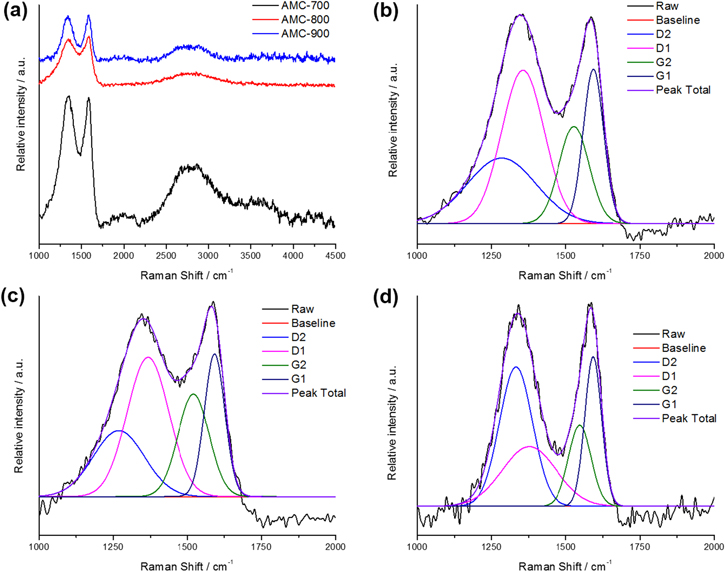
Figure 2. (a) Full Raman spectra for the AMC samples and deconvoluted Raman shift regions for the (b) AMC-700, (c) AMC-800, and (d) AMC-900 sample.
Download figure:
Standard image High-resolution imageXRD and FTIR spectra were obtained to confirm the increase in graphitization with an increase in activation temperature. The XRD spectra in figure 3 shows two broad peaks at angles of ∼21 and ∼42°, which can be assigned to an increase in order in the crystal structure [24, 25]. The peak at ∼21° is more intense in the AMC-700 sample indicating a higher degree of order in this sample; however, this observation contradicts the Raman results and FTIR analysis to be discussed below. Then, the peak at 21° is probably an ordered carbon material of small area that does not take part in the formation of the activated carbon structure at elevated temperatures but is instead burnt off. This reasoning would additionally account for the disappearance of the peak at 21° at higher activation temperatures. It is possible that such disappearance is a result of conversion to another more stable carbon form, but it is unlikely as the peak at ∼42° does not increase with increasing temperature, and also there are no new peaks in the XRD spectra that could provide evidence. This explanation is consistent with a decrease in the D2 Raman band with an increase in activation temperature. These D2 bands have been ascribed to fourfold coordinated bonds, indicating sp3 bonds which are weaker bonds than the sp2 bonds that form upon graphitization [23]. As such, these D2 bands could be the basis for this sp3 ordered small area carbon which gets burnt off at elevated activation temperatures.

Figure 3. XRD spectra for the AMC samples. The guide lines are included to indicate the peaks at θ angles of ∼21 and ∼42°.
Download figure:
Standard image High-resolution imageThe FTIR spectra in figure 4 corroborate the Raman and XRD data by showing no discernible absorption bands in the fingerprint region for the AMC-700 sample. The absence indicates disorder overall in the structure even if an ordered sp3 carbon (small area) exists in the sample. In contrast, upon activation at elevated temperatures (AMC-800 and AMC-900 cases), more discernible fingerprint bands emerge which can be attributed to an increase in order during the graphitization process. Lastly, the existence of an sp3 carbon (small area) can be supported by visual observation of tar formation during the activation process, and this tar-like substance forms near the outlet of the quartz tube at activation temperatures only above 700 °C.

Figure 4. FTIR spectra for the AMC samples.
Download figure:
Standard image High-resolution imageAnalysis of the FTIR, XRD, and Raman data allows us to propose a temperature dependent mechanism for the formation of the high surface area porous AMC-900 samples.


N2 adsorption isotherms were obtained at 77 K up to 100 kPa to obtain the BET surface area of the materials and their pore characteristics. The data in figure 5 reveal a slight hysteresis at higher activation temperatures which is correlated with an increase in mesoporosity. This increase is also observed in the mesopore distribution plots calculated using the DH method and is accompanied by an increase in microporosity as can be seen in the micropore distribution plots calculated using the NLDFF method. The increase in microporosity results in a large surface area of 1040.3 m2 g−1 for the AMC-900 sample. In general, higher activation temperatures lead to an increase in both microporosity and mesoporosity and therefore, we would expect a decrease in overall microporosity as the mesopores become more abundant at higher activation temperatures. Importantly, micropores of 0.6 nm in size are desirable for efficient adsorption of small gas molecules like CH4 and CO2 [26, 27]. For this reason, we believe that an activation temperature of 1000 °C, which leads to the destruction of the quartz tube in the annealing system, may not be beneficial for increased CH4 adsorption as its mesoporosity could outweigh its microporosity with respect to the desired 0.6 nm pore size. This assumption is strengthened by the observation that the percentage of micropores with a diameter of 0.6 nm compared to the total micropore volume decreases from 76.2 to 47.4% with an increase in activation temperature from 700 to 900 °C, respectively. The textural properties of the activated samples are summarized in table 2.
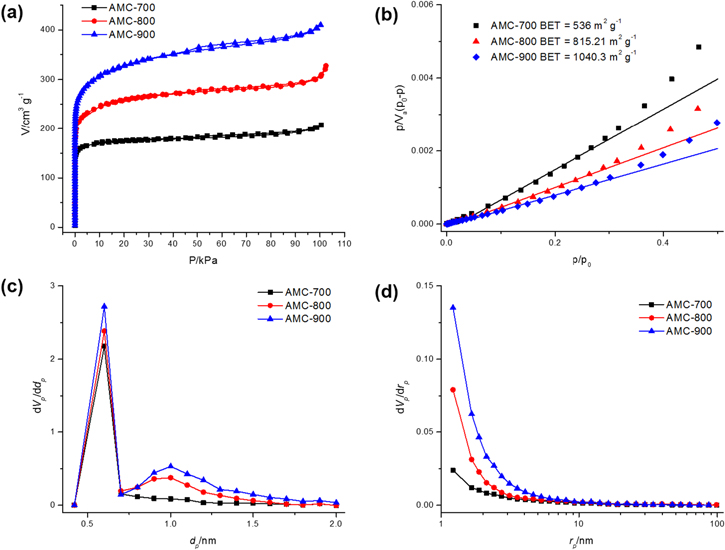
Figure 5. (a) N2 adsorption isotherms, (b) BET surface area plots, (c) micropore distribution plots calculated using the NLDFT method, and (d) mesopore distribution plots calculated using the DH method.
Download figure:
Standard image High-resolution imageTable 2. CH4 and H2 adsorption capacities for the AMC samples.
| CH4a (mmol g−1) | H2b (wt%) | CH4c (mmol g−1) | |||
|---|---|---|---|---|---|
| 288 K | 298 K | 308 K | |||
| AMC-700 | 1.70 | 1.34 | — | — | — |
| AMC-800 | 1.75 | 1.53 | — | — | — |
| AMC-900 | 1.96 | 1.75 | 4.23 | 4.07 | 4.30 |
aMaximum adsorption capacity at 273 K and 100 kPa. bMaximum adsorption capacity at 77 K and 100 kPa. cMaximum adsorption capacity at 3000 kPa.
3.2. Gas adsorption studies
In initial tests, the coffee grounds were carbonized without activation to determine their efficiency as an adsorbent. The poor methane and hydrogen adsorption results from these initial tests (see figure S2), which do not exhibit ideal desorption behavior, revealed that the activated samples are far superior absorbents. For this reason, the as-carbonized samples will not be discussed further.
3.2.1. CH4 adsorption
Based on the textural properties and porosity characteristics discussed above, it is reasonable to expect the largest methane adsorption capacity from the AMC-900 sample due to its large micropore volume and surface area. Indeed, the AMC-900 sample shows a total CH4 adsorption capacity of 1.96 mmol g−1 at 273 K and 100 kPa (figure 6 and table 2). In contrast, both the AMC-700 and AMC-800 samples display an equivalent adsorption capacity of ~1.7 mmol g−1 at 273 K and 100 kPa although the AMC-800 sample has a larger surface area and micropore volume. The interplay between micropore volume and surface area in non-crystalline adsorbents and the resultant influence on gas adsorption capacity is not fully understood at present [8, 10] in contrast to the well-known factors that influence methane adsorption in highly ordered crystalline materials such as MOFs, COFs, etc [6, 28].
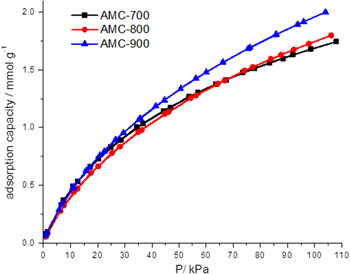
Figure 6. Low-pressure CH4 adsorption data for the AMC samples at 273 K.
Download figure:
Standard image High-resolution imageHigh-pressure adsorption data in figure 7 shows that the AMC-900 sample exhibits an adsorption capacity of ∼4.2 mmol g−1 at 3000 kPa. The CH4 adsorption capacity is constant over a 20 K temperature range, which is beneficial for on-board storage systems as they undergo natural temperature fluctuations. Figure 7 shows the data for two separate high-pressure adsorption experiments to simulate a real-life on-board gas storage system. The samples were not pretreated between these measurements as mentioned in the experimental section. The adsorption data remains relatively stable during filling and degassing, albeit that this experiment was only repeated twice due to time limitations.
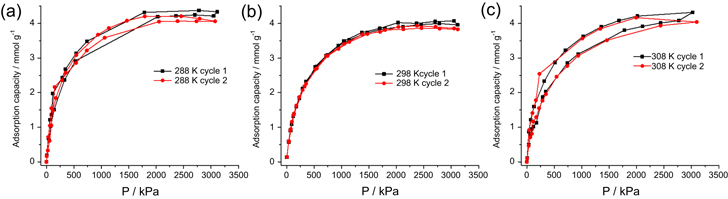
Figure 7. High-pressure adsorption data for the AMC-900 sample at (a) 288, (b) 298 and 308 K.
Download figure:
Standard image High-resolution imageThe isosteric heats of adsorption for CH4 on the AMC-900 sample could be calculated by applying the Clausius–Clapeyron equation to the high-pressure adsorption data (figure S3). The calculated value of 18.5 kJ mol−1 for the AMC-900 sample compares well with previous reports on methane in multiple other microporous systems [6]. As the calculated heat of adsorption is relatively small, we can consider the adsorption to proceed by a pure physisorption process between the gas molecules and the activated carbon surface. The adsorption capacity of AMC-900 is compared in table 3 against reported values in the literature for various other materials. One of the biggest problems encountered when collecting and comparing methane adsorption data is the variety of ways in which gas storage information is reported in the literature, i.e. with a lack of standard format. Though the surface area plays an important role in gas storage with high surface area adsorbents displaying larger adsorption capacity, other factors may have an influence as well; for this reason, the surface areas of other materials from the literature were normalized to that of AMC-900. Table 3 displays adsorptive capacities as reported in cited papers as well as values normalized to the surface area. From all measures, the adsorption capacity of our AMC-900 material compares favorably to and/or exceeds other reported microporous materials. The relative advantages of AMC-900 are its source and cost, as most competing materials such as CNTs, graphene, MOFs, etc have significant costs due to the raw materials and production in addition to the energy footprint associated with their manufacturing.
Table 3. CH4 adsorption capacity: comparison of AMC-900 with reported high surface area adsorbents.
| BET surface area | Adsorption capacity | Adsorption capacity | Adsorption capacity | Adsorption capacity | Reference | |
|---|---|---|---|---|---|---|
| (m2 g−1) | (mmol g−1) | (wt%) | (mg g−1) | (cm3(STP) g−1) | ||
| AMC-900 | 1040.3 | 4.2 | 7.0 | 70.0 | 98.1 | This work |
| SiOC-CDC-1 | 2593 | — | ∼17.5 (7.0)a | — | — | [32] |
| G-W | 2038 | — | — | — | ∼225 (114.8) | [9] |
| GODCsol-800 | 1894 | — | — | ∼150 (82.4) | — | [8] |
| C1050 | 2135 | ∼9.2 (4.4) | — | — | — | [33] |
| DUT-49 | 5476 | — | — | ∼180 (34) | — | [34] |
| PCN-14 | 2176 | — | — | — | ∼200 (95.6) | [35] |
| IRMOF-6 | 2630 | — | — | — | ∼200 (79.1) | [36] |
| PCN-11 | 2442 | — | — | — | ∼217 (92.4) | [37] |
| COF-102 | 3620 | — | — | ∼175 (50.3) | — | [38] |
| poly-BCMBP | 1366 | — | — | — | 123 (93.7) | [39] |
| Maxsorb-A | 3100 | ∼11 (3.7) | — | — | [41] | |
| Com-ACF | 2206 | ∼8 (3.8) | [41] |
aThe number in brackets is adsorption capacity corrected for the surface area relative to AMC-900. For example, for DUT-49: 34 mg g−1 = 180 mg g−1/(5476/1040.3).
3.2.2. H2 adsorption
The H2 adsorption capacity of our AMC materials was determined at 77 K up to 100 kPa as shown in figure 8 and table 2. The AMC-900 sample exhibits the highest adsorption capacity of 1.75 wt% due to its largest surface area among the three cases investigated here. The adsorption capacity of hydrogen at cryogenic temperatures is purely driven by pore volume and surface area factors and therefore, the material exhibits adsorption capacities similar to other materials of equal surface area and pore volume, as seen in table 4 [29, 30]. Ultimately, hydrogen storage will require larger adsorption capacity at ambient temperatures than the values reported to date to be beneficial for on-board storage systems [31].

Figure 8. Low-pressure H2 adsorption data for the AMC samples at 77 K.
Download figure:
Standard image High-resolution image
Table 4. H2 adsorption capacity: comparison of AMC-900 with reported high surface area adsorbents.
| BET surface area (m2 g−1) | Microporous volume (cm3 g−1) | Adsorption capacity (wt%) | Reference | |
|---|---|---|---|---|
| AMC-900 | 1040.3 | 0.286 | 1.75 | This work |
| Carbon C | 1040 | 0.45 | 1.8 | [30] |
| Norit R0,8 | 1320 | 0.54 | 1.6 | [30] |
| AC-C4 | 1308 | 0.52 | 1.25 | [29] |
| AC-C2 | 1488 | 0.60 | 1.7 | [29] |
| ACT-600 | 1790 | 0.89 | 1.7 | [40] |
4. Conclusion
We have presented the application of an activated carbon formed from spent coffee grounds as a methane adsorbent. The use of waste materials to form activated carbons is a promising method for storing anthropogenic gases from industrial processes, as well as for automobile on-board storage systems. The mechanism proposed for the formation of the activated carbon indicates that the material consists of two separate carbon sources at lower temperatures. Activation at elevated temperatures forces out the low surface area carbon source, thereby creating a high surface area material (1040.3 m2 g−1) which is a good CH4 and H2 adsorbent with capacities of ∼4.2 mmol g−1 and 1.75 wt% respectively. The material displays a reversible and stable adsorption capacity over a 20 K temperature range from 288 to 308 K.
Acknowledgments
This work was supported by NRF (National Honor Scientist Program: 2010-0020414).