
Abstract
Titanium dioxide (TiO2) nanorod arrays grown directly on Ti metal foil were prepared by a facile one-step hydrothermal method, in which the Ti foil serves as both substrate and precursor. The nanorods are tetragonal rutile single crystal with growth orientation along the [001] direction. The electrochemical properties of the TiO2 nanorod arrays were systematically investigated by cyclic voltammetry, galvanostatic charge/discharge and electrochemical impedance spectroscopy using a three-electrode system. As a result, the TiO2 nanorod arrays exhibit good areal specific capacitance and excellent cyclic stability by retaining more than 98% of the initial specific capacitance after 1000 cycles. In addition, a good flexibility of the Ti foil with TiO2 nanorod arrays was demonstrated by the stable electrochemical performance under different bending angles, which indicates that TiO2 nanorod arrays grown on Ti foil could be a promising electrode material for flexible supercapacitor application.
Export citation and abstract BibTeX RIS
1. Introduction
Over the past few years, energy storage devices have received tremendous interest due to the increasing demand for sustainable and renewable energy in modern electronic industry [1, 2]. Supercapacitors are considered as one of the most promising energy storage devices because of their high power density and long cycle life [3, 4]. Based on the charge mechanism, supercapacitors can be classified into two categories: electrochemical double layer capacitors (EDLCs) using carbon-based materials, and pseudocapacitors using redox-active materials such as transition metal oxides and conducting polymers. Compared with EDLCs, pseudocapacitors have higher specific capacitance because the fast and reversible surface Faradaic reactions dominate the charge storage; while EDLCs simply utilize the electrical charge at the electrode–electrolyte interface [5]. Therefore, most of recent supercapacitor studies have been focused on the development of redox-active materials, especially metal oxides, with high specific capacitance and good stability for pseudocapacitors [6–13].
Ruthenium oxide (RuO2) is widely recognized as the most promising electrode material for supercapacitors due to its high specific capacitance [6, 7]. However, the high cost and toxicity of RuO2 limits its practical applications. Therefore, other inexpensive and environmental friendly metal oxides (e.g. MnO2 [8, 9], TiO2 [10, 11], NiO2 [12] and Co2O3 [13]) have been investigated as alternatives. Among these candidates, TiO2 shows many advantages such as low cost, natural abundance and environmentally friendly, making it a very promising electrode material for supercapacitors. However, it suffers from poor electrical conductivity and low specific surface area, leading to a relatively low specific capacitance [14]. To overcome such limitations, nanostructures have been demonstrated to be unique in facilitating the fast ion diffusion and electron transfer, thus dramatically boosting the electrochemical performance. Among different nano-architectures, three dimensional (3D) nanostructures, such as nanorod, nanowire and nanotube arrays, exhibit additional advantages such as providing direct pathways for ion/electron transport and large surface area for charge storage enhancement [15]. Different methods have been reported to synthesize 3D TiO2 nanostructures including template sol–gel [16], anodic oxidation [17] and chemical vapor deposition methods [18], although instrumental complexity poses high investment costs as well as limits of scalability. In this respect, low cost solution-based methods are of immense interest for inexpensive mass production. Hydrothermal growth is one of simplest and most cost-effective solution-based synthesis methods, which is capable of achieving not only high-purity nanostructures with high-crystallinity, but also can be easily scaled up for large area nanostructures fabrication for various device applications [19, 20].
In this paper, we demonstrate a facile one-step hydrothermal method to grow TiO2 nanorod arrays directly on Ti metal foil for supercapacitor application. Owing to the unique 3D configuration of TiO2 nanorod arrays, a decent electrochemical property with high specific capacitance and excellent cycling stability was achieved. In addition, the flexible supercapacitor electrode using Ti foils with TiO2 nanorod arrays was also demonstrated.
2. Experimental section
2.1. Synthesis of TiO2 nanorod arrays
TiO2 nanorod arrays on Ti foil was synthesized via a hydrothermal method. Ti foil was first cleaned with acetone, and then etched in 18 wt% HCl solution at 85 °C for 10 min to remove the native oxide layer. In a typical hydrothermal procedure, Ti foil was placed in a Teflon-lined stainless steel autoclave filled with a 2.5 wt% HCl aqueous solution and kept at 180 °C for 12 h. After the synthesis, the autoclave was cooled down naturally to room temperature. After being dried in air, the samples were annealed at 600 °C under argon atmosphere for 1 h.
2.2. Material characterizations
Field-emission scanning electron microscopy (FESEM) images were taken on a Carl Zeiss 1530 VP microscope. Transmission electron microscopy (TEM) experiments were conducted on a JEOL 2010 transmission electron microscope equipped with x-ray energy dispersive spectroscopy (EDS). Cross-section TEM analysis and EDS mapping were conducted on a JEM-2100 F-field emission TEM equipped with Oxford EDS spectroscopy. X-ray photoelectron spectroscopy (XPS) spectrum was recorded with an XPS system (Perkin-Elmer Phi 560) and the binding energy was calibrated using the C 1s photoelectron peak at 284.6 eV as the reference. X-ray diffraction (XRD) patterns were recorded on Philips X'Pert-MPD x-ray diffractometer with Ni-filtered Cu Kα radiation (40 kV, 40 mA).
2.3. Electrochemical measurements
The electrochemical properties were investigated by a Gamry Reference 600 electrochemical workstation. A typical three-electrode experimental cell equipped with a prepared Ti foil served as the working electrode, a platinum foil as the counter electrode, and an Ag/AgCl as the reference electrode was used for measuring the electrochemical properties of the working electrode. Cyclic voltammetry (CV) of the electrode was obtained at different scan rates of 1, 2, 5, 10, 20, 50, 100, 500 and 1000 mV s−1 in the potential range of −0.2 to 0.6 V. Galvanostatic charge/discharge curves were measured in the potential range of 0–0.6 V at different current densities of 10, 20, 50 and 100 μA cm−2. The stability of the electrode was tested by galvanostatic charge/discharge measurement during 1000 cycles at a current density of 100 μA cm−2. Electrochemical impedance spectroscopy (EIS) measurements were carried out at a direct current bias of 0.1 V, with a signal of 5 mV, over the frequency range of 0.1–100 kHz. Mott–Schottky plots were measured at a frequency of 10 000 Hz. All the electrochemical measurements were performed in 1 M Na2SO4 solution at room temperature.
3. Results and discussion
Figures 1(a) and (b) show typical FESEM images of the as-grown TiO2 nanorod arrays on Ti foil after the hydrothermal reaction. As seen in figure 1(a), TiO2 nanorods with clear tetragonal shape were grown from the entire surface of the Ti foil. The inset, enlarged from one nanowire tip, shows pyramid shape with the tetragonal edge arranging from 50 to 200 nm. A cross-sectional view of the TiO2 nanorod arrays is shown in figure 1(b), revealing the nanorods grew out randomly from the Ti foil with length about 1 μm long. The crystal structure of the nanorods was determined by XRD as shown in figure 1(c) and all diffraction peaks are in good agreement with the tetragonal rutile phase (JCPDS No. 88-1175) except the peaks from the Ti foil, as denoted by asterisks. XPS (figure 1(d)) was further employed to confirm the chemical composition and oxide state of the nanorods through photoelectron peaks of Ti and O. The binding energies of Ti 2p3/2 and Ti 2p1/2 peaks observed at 458.8 eV and 463.4 eV, respectively, with a spin–orbit splitting of 4.6 eV (shown in the supporting information, figure S1), match with the values for bare TiO2 [21] very well, suggesting that the oxidation state of the Ti in the nanorods is 4.0.
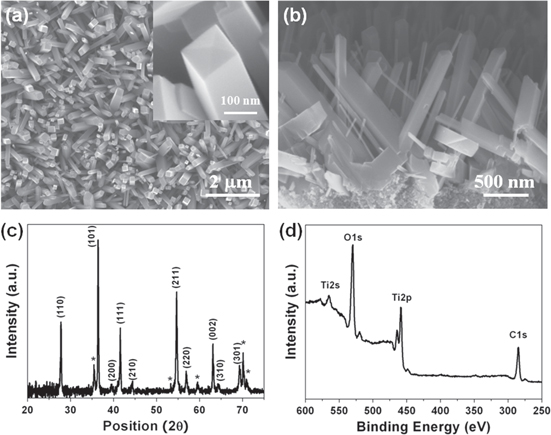
Figure 1. (a) Top view and (b) cross-sectional FESEM images of TiO2 nanorod arrays on Ti foil. The inset in (a) is enlarged images of TiO2 nanorod tip. (c) XRD pattern and (d) XPS survey spectra of TiO2 nanorod arrays.
Download figure:
Standard image High-resolution imageThe morphology and structures of the TiO2 nanorods were further characterized by using TEM. Figure 2(a) is the low-magnification TEM image of a single TiO2 nanorod. The corresponding selected-area electron diffraction patterns (SADPs) taken from [110] (figure 2(b)) and [111] (figure 2(c)) zone axis reveal the single-crystalline feature of the nanorod, which can be indexed to the pure rutile TiO2 phase. From the SADPs, the growth direction of the TiO2 nanorod can be easily determined along the [001] direction, which agrees with the tetragonal crystal shape and pyramid tip observed under FESEM. The EDS spectrum shown in figure 2(d) further confirms the successful synthesis of TiO2 nanorods.

Figure 2. (a) TEM image of an individual TiO2 nanorod. (b) and (c) are SADPs taken from [110] and [111] zone axis, respectively. (d) EDS spectra of an individual TiO2 nanorod. The Cu peak originates from the copper grid for TEM observation.
Download figure:
Standard image High-resolution imageTo better understand the growth mechanism of TiO2 nanorods, a cross-sectional TEM specimen of the TiO2 nanorod arrays was prepared by focused ion beam (FIB). As shown in figure 3(a), a buffer layer between TiO2 nanorod and Ti substrate can be observed. Note the nanorod is much shorter than average length because it has been broken during the FIB process. The detail EDS spectra from each area can be found in figure S2. The corresponding EDS mapping images of Ti and O distribution are displayed in figures 3(b) and (c), respectively, clearly indicating the formed buffer layer between TiO2 nanorods and Ti substrate is composed of Ti and O, whose structure will be further characterized below.

Figure 3. (a) STEM dark field image of Ti/TiO2 interface. (b) and (c) are EDS elemental mappings corresponding to titanium (Ti) and oxygen (O), respectively.
Download figure:
Standard image High-resolution imageFigure 4(a) is a low magnification bright-field TEM image, showing a rough Ti/TiO2 interface. SADPs, performed on different regions of areas b, c and d of the interface, are shown in figures 4(b)–(d), respectively. The diffraction pattern from the substrate (figure 4(b)) can be indexed as pure Ti hexagonal close-packed structure. Besides the diffraction spots from single crystal TiO2 nanorod, denoted in the small rings in figure 4(c), there is also the presence of diffraction rings in the diffraction pattern from the interface. Such diffraction rings can be indexed as rutile TiO2 (simulated with the PCED2.0 program) [22], which further confirms the formation of polycrystalline TiO2 in the buffer layer. Figure 4(d) shows the SADP taken from the area with several small TiO2 nanorods, in which the diffraction rings can be indexed to the rutile TiO2 phase, matching EDS mapping results above. Furthermore, no special growth orientation between the nanorod and the substrate was observed. Based on the above experimental results, the possible growth mechanism of the TiO2 nanorod is detailed as follows.
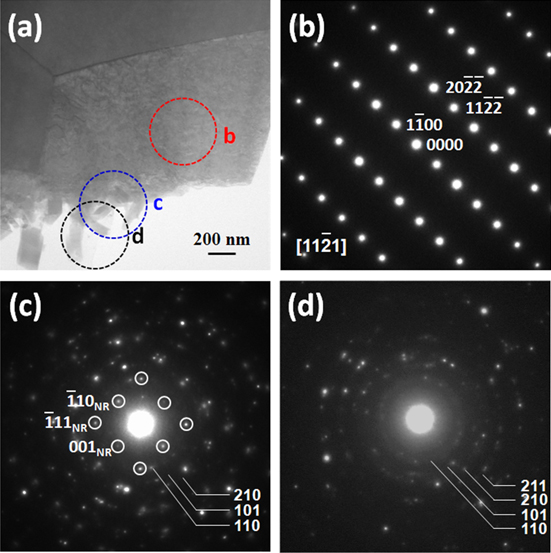
Figure 4. (a) Cross-sectional TEM image of Ti/TiO2 interface. (b)–(d) Diffraction patterns taken from the circled areas b, c and d in figure (a), respectively.
Download figure:
Standard image High-resolution imageSimilar to the reported mechanism of TiO2 nanorods grown on carbon fibers [23], the Ti foil reacts with H+ ions in HCl solution at high temperature and pressure, leading to the gradually dissolving of Ti foil and releasing of the Ti3+ ions. Because Ti3+ ions are not stable in aqueous solution, they are further hydrolyzed and oxidized to TiO2. Apparently, due to the big polycrystalline grains of Ti substrate (figure 4(a)) and different crystal structures between the TiO2 (tetragonal) nanorods and the Ti (hexagonal) substrate, it seems unlikely for TiO2 nanorods to directly grow out from the Ti surface. Instead, TiO2 polycrystalline buffer layer was observed to form on the surface of the Ti substrate (figure 3). It is well known that the growth on the existing seeds is more favorable compared to the formation of new nuclei because the heterogeneous nucleation in solution has a lower activation energy barrier than homogeneous nucleation [24]. Hence, the TiO2 buffer layer can provide initial nucleation sites by reducing the nucleation energy. Since the buffer layer was composed of small randomly oriented TiO2 crystallites, each nanorod tended to grow randomly, which is consistent with the cross-sectional SEM observation shown in figure 1(b). However, the growth rate of rutile TiO2 nanorod follows the sequence of (110) < (100) < (101) < (001) [25]. Therefore, TiO2 nanorods growing along the [001] direction was eventually dominated. The schematic diagram of the formation process is shown in figure S3.
The electrochemical properties of TiO2 nanorod arrays were investigated by CV and galvanostatic charge/discharge measurements in a conventional three-electrode configuration. Figure 5(a) shows the CV curves of TiO2 nanorod arrays on Ti foil at different scan rates. All the CV curves exhibit almost rectangular shapes without obvious redox peaks, indicating ideal supercapacitance behavior and fast charging-discharging process based on good charge propagation. The calculated areal capacitances as a function of scan rate are shown in figure 5(b). The capacitance values of the TiO2 nanorod arrays are in the range of 83.7–856.2 μF cm−2, as the applied scan rate is varied from 1000 mV s−1 to 1 mV s−1, which is substantially higher than the values recently reported for TiO2 nanoparticles (33 μF cm−2 at scan rate of 100 mV s−1) [14] and TiO2 nanorod arrays on FTO glass (85 μF cm−2 at scan rate of 100 mV s−1) [26]. The enhanced electrochemical performance of TiO2 nanorod arrays can be attributed to two major aspects. First, the 3D configuration of single crystalline TiO2 nanorod arrays provided direct pathways for ion and electron transport as well as large surface area for charge storage. Second, direct growth of TiO2 nanorod arrays on Ti foil provided good mechanical adhesion and electrical conduction between the active electrode material and the current collector. In addition, heat-treatment improves significantly the electrochemical performance of the TiO2 nanorod arrays (figure S4) [27]. The electrochemical performance of TiO2 nanorod arrays were further studied by galvanostatic charge/discharge method. Figure 5(c) illustrates the charge/discharge curves at different current densities of 10, 20, 50 and 100 μA cm−2. The charge/discharge curves of the TiO2 electrode show good symmetry and a small internal resistance drop (0.07 V), indicating the TiO2 nanorod arrays have ideal electrochemical capacitance behavior and good redox reaction reversibility [8, 28].

Figure 5. (a) Cyclic voltammetry curves of the TiO2 nanorod arrays at different scan rates. (b) Areal capacitance of TiO2 nanorod arrays as a function of scan rates. (c) Galvanostatic charge/discharge curves of TiO2 nanorod arrays at different current densities. (d) Cycle performance of TiO2 nanorod arrays measured by galvanostatic charge/discharge at a scan rate of 100 μA cm−2 for 1000 cycles. Insert is the typical charge–discharge curves within ten cycles.
Download figure:
Standard image High-resolution imageThe long-term cycling stability is one of the most important characteristics for supercapacitor. The stability of TiO2 nanorod arrays was tested by galvanostatic charge/discharge at 100 μA cm−2 for 1000 cycles, and the results are shown in figure 5(d). The decrease of capacitance after 1000 cycles is less than 1.6%, revealing the TiO2 nanorod arrays have a superior long-term cyclic performance. Meanwhile, as shown in the insert, the typical charge–discharge curves within ten cycles exhibit almost identical sharp triangular curve shapes, indicating a stable redox reaction, which further confirms the outstanding long-term stability.
EIS analysis was also measured to further understand the fundamental electrochemical behavior of TiO2 nanorod arrays. The corresponding Nyquist plots are shown in figure 6(a). The impedance plot, as inserted, is composed of a semicircle arc in the high frequency region followed by a linear response in the low frequency. The high frequency region corresponds to the combined resistances of ionic resistance of electrolyte, intrinsic resistance of substrate, and contact resistance at the active material/current collector interface [29]. The linear part in the low frequency region is related to the frequency dependence diffusive resistance of the ion diffusion at electrolyte/electrode interface. It is noticeable that the Nyquist plot shows a large slope at lower frequencies, indicating the high capacitive behavior of the TiO2 nanorod arrays [30]. Figure 6(b) represents the Mott–Schottky plot observed in the range of positive dc potentials. The correlation between 1/C2 and the applied potential exhibits a positive linear dependence, indicating the n-type semiconductor nature. The carrier density calculated from the slope of this Mott–Schottky plot is 2.1 × 1021 cm−3, which is accordant with the expected values for TiO2 [31].
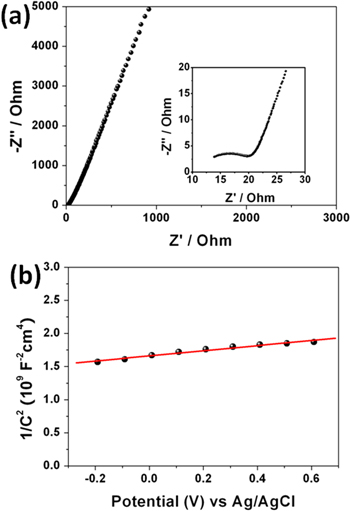
Figure 6. (a) Nyquist plot and (b) Mott–Schottky plot of TiO2 nanorod arrays. The inset in (a) shows the high frequency part of the Nyquist plot.
Download figure:
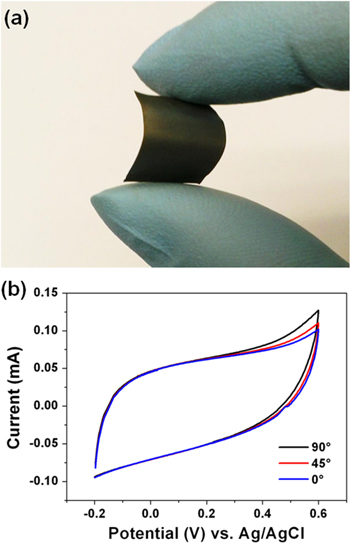
Standard image High-resolution imageTo evaluate the feasibility of this TiO2 nanorod arrays directly grown on Ti foil for flexible supercapacitor application, the CV test under different bending conditions were performed. The foil with as-synthesized TiO2 nanorod arrays shows highly flexibility upon repeated bending (figure 7(a)) and, more importantly, the CV curves collected did not significantly change under different bending angles (figures 7(b) and S5), demonstrating that the TiO2 nanorod arrays on Ti foil have high mechanical flexibility, which can be potentially applied for flexible supercapacitor fabrication.
Figure 7. (a) Optical micrograph of bended Ti foil with TiO2 nanorod arrays. (b) CV curves collected at 100 mV s−1 under different bending conditions.
Download figure:
Standard image High-resolution image
4. Conclusions
In summary, a facile one-step hydrothermal method is developed to directly grow TiO2 nanorod arrays on Ti foil. The TiO2 nanorods are single rutile crystalline with [001] growth involving dissolving of the Ti substrate and growing of the nanorods. The electrochemical performance of the nanorod arrays, used as supercapacitor electrodes, was systematically investigated. The results demonstrate that TiO2 nanorod arrays exhibit an ideal capacitive behavior, such as high specific capacitance and excellent cyclic stability. The TiO2 nanorod arrays was further used as a flexible electrode and showed good stability under different bending conditions, which suggests that TiO2 nanorod arrays grown directly on Ti foil can be employed for flexible energy storage applications as well.
Acknowledgements
This research was financially supported by Louisiana Board of Regents under contract No. LEQSF(2011-13)-RD-B-08. Ms Kayla Tarr thanks the support from LA Board of Regents LaSIGMA and NSF(2010-15)-RII-UNO grants.