Abstract
Heat treatment of carbon nanofibers has proven to be an effective method in removing defects from carbon nanofibers, causing a strong increase in their structural perfection and thermal stability. It affects the bonding states of carbon atoms in the nanofiber structure and causes a significant transformation in the hybridization state of the bonded carbon atoms.
Nanofilled resins made of heat-treated CNF show significant increases in their electrical conductivity even at low concentrations. This confirms that enhancement in the perfection of the fiber structure with consequent change in the morphological features plays a prominent role in affecting the electrical properties. Indeed heat-treated CNFs display a stiff structure and a smooth surface which tends to lower the thickness of the unavoidable insulating epoxy layer formed around the CNF which, in turn, plays a fundamental role in the electrical transport properties along the conducting clusters. This might be very beneficial in terms of electrical conductivity but might have negligible effect on the mechanical properties.
Export citation and abstract BibTeX RIS

Content from this work may be used under the terms of the Creative Commons Attribution 3.0 licence. Any further distribution of this work must maintain attribution to the author(s) and the title of the work, journal citation and DOI.
1. Introduction
In recent years, both academic and industrial researchers have focused on carbon nanoparticle filled epoxy resins because of their potential to improve the thermal, chemical and physical properties of resins. These materials exhibit excellent mechanical properties and great structural stability for many applications such as automotive, aeronautics, marine industry, electronics and others. Carbon-based nanofillers inside epoxy formulations represent one of the key components of an emerging technological revolution. Among the carbon nanostructured forms, carbon nanotubes (CNTs) have spurred many researchers on to develop advanced CNT-based materials in order to transfer some of their excellent physical properties to epoxy matrices [1–9]. CNTs in polymeric matrices offer the possibility to combine complementary interesting properties. As conductive filler with high aspect ratio, CNTs are more effective than traditional carbon black [10–13], which results in nanofilled materials with high electrical conductivity at lower filler concentrations [4, 5]. Despite these benefits, there are still several issues to be considered in the development of innovative CNT-based resins. These issues are related to the high cost and the possibility of achieving an effective dispersion of CNTs in the polymeric matrix due to the very strong interactions among CNTs with respect to the interactions between the nanofiller and epoxy matrix. Functionalization of CNTs performed for the purpose of enhancing the interactions between the polymeric matrix and nanofillers can induce nanotube damage and, depending on the functionalization treatment, can considerably affect both mechanical and electrical properties [14–16]. Many material researchers are looking for answers to overcome these inconveniences by using other nanotubes, such as carbon nanofibers (CNFs) characterized by physical properties comparable to those of CNTs [17, 18]. CNFs can be manufactured with morphological parameters suitable to reduce the interactions among their walls [19, 20]. In fact, unlike CNTs for which van der Waals forces cause the nanotubes to form ropes or reassemble after being dispersed, CNFs are less affected by van der Waals forces and tend to stay dispersed for longer periods of time. In addition, they can be used as effective low cost replacements for carbon nanotubes in high performance resin formulations. The structure of vapor-grown CNFs gives rise to some excellent mechanical properties and very high electrical and thermal conductivity [21–24]. These nanomaterials are very promising for efficient lightning strike protection and mechanical resistance. At room temperature, the intrinsic resistivity of highly graphitic vapor-grown carbon fiber is approximately 5 × 10⁻⁵ Ω cm [25] which is a value comparable to the resistivity of graphite [26]. Due to their particular properties such as low electrical resistivity and high aspect ratio, CNFs allow us to obtain nanofilled thermosetting materials with high electrical conductivity. In such a way, it is possible to produce composites with different electrical resistivity values by controlling their concentration and interaction inside the matrix [26]. This feature is suitable for applications that require variation of the electrical resistivity in different ranges such as electrostatic dissipation (ESD) (106–108 Ω cm), electrostatic painting (104–106 Ω cm), EMI shielding (101–103 Ω cm), and lightning strike protection (<10 Ω cm) [27].
The aim of this work is to study: (1) the potential use of CNF as filler to produce new polymer nanocomposites; (2) the changes in structural ordering of CNF during carbonization and graphitization processes and how these changes will influence the physical properties of the final resins as a function of filler concentration. In such a way it might be possible to overcome some drawbacks related to the electrical properties of typical epoxy-based composites in the field of aeronautic and aerospace materials. In particular, within the family of epoxy precursors, we have chosen a multifunctional epoxy resin based on tetraglycidyl methylene dianiline (TGMDA) which is well established in many aerospace and aircraft carbon fiber-reinforced composites. In order to optimize the dispersion of CNFs inside the epoxy mixture, we have fluidified the initial epoxy precursors with an epoxy reactive monomer which has proven to be very effective in lowering the viscosity of the nanoparticles/resin mixture and therefore in facilitating the nanofiller dispersion step.
2. Experimental details
2.1. Materials
2.1.1. Carbon nanofibers.
Vapor-grown carbon nanofibers in the form of powders used in this study were produced at Applied Sciences Inc. and were from the Pyrograf III family. The pristine CNFs used in this study are labeled as PR25XTPS1100 where XT indicates the debulked form of the PR25 family, PS indicates the grade produced by pyrolytically stripping the as-produced fiber to remove polyaromatic hydrocarbons from the fiber surface and 1100 is the temperature in the process production.
The nanofibers have (a) an average bulk density of product (g cm−3) ranging from 0.0192 to 0.0480; (b) a nanofiber density (including hollow core) (g cm−3) from 1.4 to 1.6; (c) a nanofiber wall density (g cm−3) from 2.0 to 2.1; (d) an average catalyst (iron) content (ppm) <14 000; (e) an average outer diameter (nm) from 125 to 150; (f) an average inner diameter (nm) from 50 to 70; (g) an average specific surface area, m2 g−1 from 65 to 75; (h) a total pore volume (cm3 g−1) of 0.140; (i) an average pore diameter (angstroms Å) of 82.06 and lengths ranging from 50 to 100 μm.
Sample PR25XTPS1100 was heat treated to 2500 ° C to provide the best combination of mechanical and electrical properties, giving the sample the name PR25XTPS2500.
The heat treatment was performed in an atmosphere controlled batch furnace. Approximately 300 g of nanofibers were placed in a ceramic crucible for the heat treatment. The furnace was purged with nitrogen gas for 1 h prior to heating. The heating rate was 100 ° C h−1 and the furnace was held at a temperature of 2500 ° C for 1 h prior to cooling.
2.1.2. Nanofilled epoxy resins.
The epoxy matrix was prepared by mixing an epoxy precursor, tetraglycidyl methylene dianiline (TGMDA) (epoxy equivalent weight 117–133 g/eq), with an epoxy reactive monomer 1-4 butanediol diglycidyl ether (BDE) that acts as a flexibilizer and reactive diluent. These resins, both containing an epoxy, were obtained by Sigma-Aldrich. The curing agent investigated for this study is 4,4'-diaminodiphenyl sulfone (DDS). The epoxy mixture was obtained by mixing TGMDA with BDE monomer at a concentration of 80%:20% (by wt) epoxide to flexibilizer. The hardener agent was added at a stoichiometric concentration with respect to all the epoxy rings (TGMDA and BDE).
Epoxy blend and DDS were mixed at 120 ° C and the CNFs (samples PR25XTPS1100 and PR25XTPS2500) were added and incorporated into the matrix by using an ultrasonication for 20 min. An ultrasonic device, Hielscher model UP200S (200 W, 24 kHz) was used.
CNFs were dispersed within the epoxy resin at loading rates of 0.05, 0.32, 0.64, 0.8, 1.00 and 1.3% by weight. Our experiments show that nanofilled resins with loads beyond 1.3% by weight have difficultly in establishing a homogeneous mixture.
All the mixtures were cured by a two-stage curing cycle: a first isothermal stage was carried out at the lower temperature of 125 ° C for 1 h and the second isothermal stage at a higher temperatures up to 200 ° C for 3 h. These samples are named: TBD for the unfilled epoxy formulation, TBD-PR25XTPS1100(X)(200 ° C) and TBD-PR25XTPS2500(X)(200 ° C) where X is the CNF percentage.
The as-received carbon nanofibers, designated as PR25XTPS1100, and the neat resin were used as a baseline for the study.
2.2. Characterizations
Raman spectra were collected at room temperature with a Renishaw inVia microRaman spectrometer operating with a 514 nm laser source.
X-ray diffraction was performed with a Bruker D8 Advance diffractometer with Ni-filtered Cu Kα radiation (λ = 1.540 50 Å).
The infrared spectra were obtained in absorbance by using a Bruker Vertex 70 FTIR-spectrophotometer with a resolution of 2 cm−1 (32 scans collected).
Thermogravimetric analysis was carried out in air using a Mettler TGA/SDTA 851 thermal analyzer. The temperature range was 25–1000 ° C at a heating rate of 10 ° C min−1.
SEM micrographs were obtained using a field emission scanning electron microscope (FESEM, mod. LEO 1525, Carl Zeiss SMT AG, Oberkochen, Germany).
Some of the nanofilled sample sections were cut from the solid samples by a sledge microtome. These slices were etched before the observation by FESEM. The etching reagent was prepared by stirring 1.0 g potassium permanganate in a solution mixture of 95 ml sulfuric acid (95–97%) and 48 ml orthophosphoric acid (85%). The filled resins were immersed into the fresh etching reagent at room temperature and held under agitation for 36 h. Subsequent washings were done using a cold mixture of two parts by volume of concentrated sulfuric acid and seven parts of water. Afterwards the samples were washed again with 30% aqueous hydrogen peroxide to remove any manganese dioxide. The samples were finally washed with distilled water and kept under vacuum for five days. The nanofilled sample sections were placed on a carbon tab previously stuck to an aluminum stub (Agar Scientific, Stansted, UK). The samples were covered with a 250-Å-thick gold film using a sputter coater (Agar mod. 108 A).
Transmission electron microscopy (TEM) was carried out on a Philips CM-20 model equipped with a 200 kV accelerating voltage and a high brightness LaB6 gun for high coherence and a small probe.
The measurements of the dc volume conductivity were performed on disk-shaped specimens of about 2 mm thickness and 50 mm diameter by using metallized electrodes with a diameter of about 22 mm. The metallization is obtained by employing a silver paint (RS 186-3600) with a thickness of about 50 μm and a surface resistivity of 0.001 Ω cm. The measurement system, remotely controlled by the software LABVIEW®, is composed of a suitably shielded cell with temperature control, a Keithley 6517A multimeter functioning as a voltage generator (maximum ±1000 V), a voltmeter (maximum ±200 V) and a HP34401A ammeter (minimum current 0.1 μA) for samples above the percolation threshold. For samples below the percolation threshold the system is composed only of the Keithley 6517A multimeter functioning as a voltage generator (maximum ±1000 V) and a pico-ammeter (minimum current 0.1 fA). For sensitivity purposes the applied electric field has been 0.5 MV m−1 for samples below the percolation threshold, whereas in order to avoid Joule heating of samples it has been set to 5.0 kV m−1 for samples above the percolation threshold.
Dynamic mechanical properties were performed using a Tritec 2000 DMA (Triton Technology Ltd). DMA experiments were performed to identify transition regions in the formulated resins, such as the glass transition temperature (Tg) and any other small transitions.
Storage modulus E' and damping coefficient, tanδ, given by the ratio between the loss modulus and the storage modulus, are recorded as a function of temperature. The specimens with 30 mm × 10 mm × 2 mm are fixed between a movable and a stationary clamp fixture and then enclosed in a thermal chamber. Frequency and load amplitude and temperature range, appropriate for the tested material are inputted. A sinusoidal oscillatory three points bending (3PB) load is applied to the specimen in a programmed temperature range, which generates a sinusoidal strain. The frequency was fixed at 1 Hz. An oscillation displacement amplitude of 0.03 mm was thus chosen. The ramp experiments were performed at heating rates of 3 ° C min−1 in the temperature range from −90 to 315 ° C.
3. Results and discussion
3.1. Carbon nanofiber characterization
3.1.1. Morphological and structural investigation.
In order to fully understand the influence of heat treatment on the physical properties of nanofilled epoxy resins, the morphologies of both nanofibers and nanofilled samples were characterized. FESEM investigation on the nanofibers was performed to analyze the morphology of the nanofibers before their incorporation into the epoxy precursors. The images shown in figure 1(a) indicate that as-received CNFs are debulked enough to avoid additional treatment.
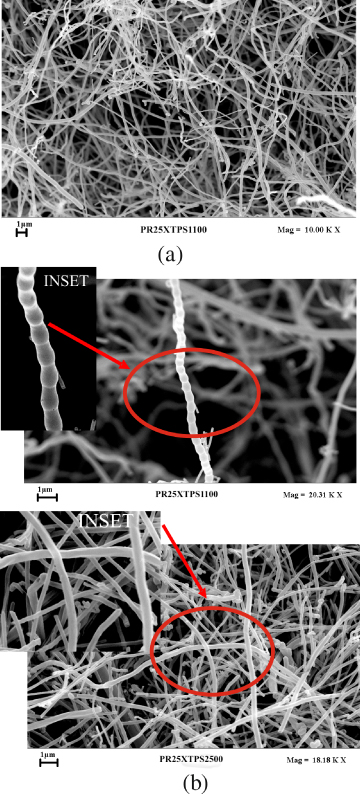
Figure 1. (a) An SEM image of as-received CNFs (PR25XTPS1100); (b) SEM images of as-received CNFs (PR25XTPS1100) and CNFs heat treated at 2500 ° C (PR25XTPS2500); the inset shows higher magnifications for each sample.
Download figure:
Standard image High-resolution imageThe influence of heat treatment on the nanofiber morphology can be seen in figure 1(b) where also the as-received CNFs at the same magnification are shown for comparison. The insets at higher magnification show that the as-received CNFs are characterized by a nested configuration. The heat treatment seems able to statistically reduce this effect; in fact, heat-treated CNFs appear to be characterized by straighter walls where the nested configuration is not clearly visible.
Changes in morphology due to heat treatment can be better analyzed by means of the TEM technique. Figure 2 on the left side shows the TEM micrograph of the CNFs used in this study. The individual pristine nanofiber has a hollow core that is surrounded by a cylindrical fiber comprised of highly crystalline, graphite basal planes stacked at about 25° from the longitudinal axis of the nanofiber. This structure, termed 'stacked cup' or 'herringbone', generates a fiber with exposed edge planes along the entire interior and exterior surfaces of the nanofiber. In the section 3.2.4 on the dynamic mechanical properties of the nanofilled epoxy resins we will see that the exposed edge planes determine stronger interactions with the epoxy matrix than CNFs with straight external walls, leading to a more evident increase in the storage modulus in the entire range of investigated temperatures.

Figure 2. Bright field micrograph of the 'Dixie cup' carbon nanofiber structure on the left side and a cross-sectional view of the CNF.
Download figure:
Standard image High-resolution imageThis particular morphology as also referred to as a nested configuration or as fishbone type. Nested carbon nanofibers have an orientation similar to that of a set of stacked Dixie cups with a hollow core. The Dixie cups of the pristine CNFs are also clearly visible in the inset of figure 1(b) (see PR25XTPS1100 sample).
The as-received CNFs exhibit only local molecular ordering. As they are heat treated, an increase in temperature results in the aromatic molecules becoming stacked in a column structure; after heat treating the pristine nanofibers to a temperature of 2500 ° C, the graphene layers became straight, and the minimum interlayer spacing was reached for the PR25XTPS2500 nanofibers. As shown by the TEM micrograph in figure 3, the layers within the Dixie cup carbon nanofiber have coalesced following heat treatment.
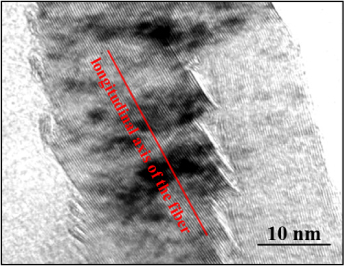
Figure 3. High-resolution imaging of the localized area of the coalesced Dixie cup structure.
Download figure:
Standard image High-resolution imageAt this magnification the inclination angle of each 'cup' is apparent. Within each cup it can be seen that the localized ordering of the graphene planes has been changed due to coalescence resulting in continuous planes. The stacking effect is shown through the use of a gray scale. The walls of the nanofibers are dark due to their high electronic density. The surrounding regions are starkly lighter with low electronic densities.
The graphene layers appear very straight without any disclination defects. However, there is no change in the inclination angle to the central core axis. The edges of any pair of graphene layers have been rounded encapsulating the carbon planes' exposed edge. This allows the exposed graphene planes to attain a level of maximum structural stability.
3.1.2. Structural investigation.
Figure 4 shows that the wide-angle x-ray diffractograms of the two samples further clarify the differences in the structural features of the different heat-treated carbon nanofibers. The profile of the (002) reflection at 2θ = 26° in the pristine CNFs indicates characteristics of the disordered and amorphous carbon; whereas the higher sharp peak of the same reflection in the x-ray diffractogram of the PR25XTPS2500 sample indicates that the heat treatment causes a very high degree of carbon nanofiber graphitization. In addition, the heat treatment increases the 2θ angle of the (002) peak from 26.0° for the as-received PR25XTPS1100 carbon nanofibers to 26.2° for heat-treated PR25XTPS2500 nanofibers with a change in the interlayer spacing d(002) from 0.343 to 0.340 nm.
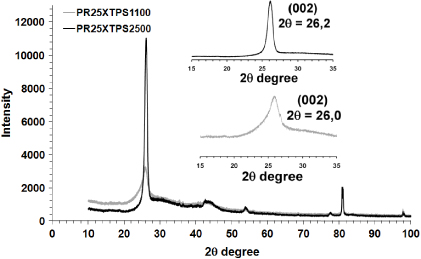
Figure 4. X-ray diffraction patterns of pristine and annealed nanofibers.
Download figure:
Standard image High-resolution imageThis result agrees with the TEM and Raman results, indicating that the graphene layers became more tightly packed and highly graphitic after heat treatment.
3.1.3. Raman and FT/IR spectroscopy.
The Raman spectra collected for samples PR25XTPS1100 and PR25XTPS2500 are shown in figure 5.

Figure 5. Raman spectra of samples PR25XTPS1100 and PR25XTPS2500.
Download figure:
Standard image High-resolution imageGenerally the Raman spectra for carbonaceous material is divided into first- and second-order regions. The first-order region lies in the interval of 1100–1800 wavenumbers. In this region we can observe the main graphite band, the G band at ∼1580 cm−1. This band is observable with different intensities for the two samples. Additional bands at ∼1350–1355 cm−1, at 1500 and 1622 cm−1 are observed for more poorly crystalline graphite. The band at ∼1350 cm−1 is known as the disordered-induced D band (D for defect or disorder) [28] and it is observable when defects are present in the carbon aromatic structure. Also the band 1500 cm−1 observable as a shoulder on the right of the G band in the PR25XTPS1100 sample is attributed to defects outside the plane of aromatic layers like tetrahedral carbons. In the second-order region (from 2200 to 3300 cm−1), we can observe the band at ∼2700 cm−1 (G' band) which is indicative of graphite crystallinities. This band is almost absent in the PR25XTPS1100 sample, indicating a very low crystallinity degree. A very important parameter that can be used for quantifying disorder is the ratio (ID/IG) between the intensities of the disorder-induced D band (1350 cm−1) and the first-order graphite G (1580 cm−1) band [28]. The ID/IG values of the two samples are 0.8 for PR25XTPS1100 and 0.08 for PR25XTPS2500.
An analysis of such characteristics has also been performed in [29]. If we compare the previous data with those reported there we can observe that the R value is the same for the as-received CNFs (0.8), while for the CNFs treated at 2500 ° C it is 0.3 for those employed in [29] and 0.08 for those used in our paper. A good agreement is, indeed, found for the TEM investigation and x-ray diffraction. In fact, the value of d(002) is 0.339 nm in [29] and 0.340 nm in our paper. We may hypothesize that the observed differences could be ascribed to the different treatment times at the considered temperature.
In conclusion the black spectrum shows a profile corresponding to carbon fibers characterized by a high level of order with two intense signals (G and G' bands) characteristic of graphitic sp2 materials, as already evidenced by TEM investigation.
Figure 6 shows the FTIR spectra of untreated and heat-treated CNFs.
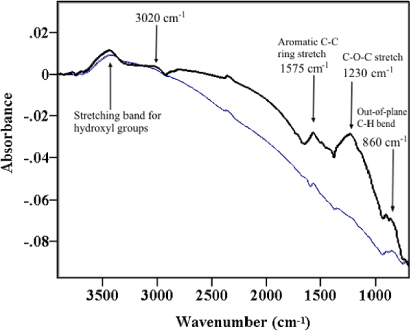
Figure 6. FTIR spectra of the samples PR25XTPS1100 (thick line) and PR25XTPS2500 (thin line).
Download figure:
Standard image High-resolution imageThe heat treatment influences the surface of the nanofibers in several regions of the spectrum. The intensity of the weak broad band corresponding to the hydroxyl groups (–O–H stretching vibration) between 3306 and 3665 cm−1 decreases in the spectrum of heat-treated CNFs; in addition, many bands corresponding to non-aromatic vibrations and aromatic C–H signals reduce their intensity or disappear completely after heat treatment at high temperature. Among these bands there are: (1) the aromatic C–H stretching signal of arenes (several bands at around 3020 cm−1); (2) different small bands at about 1493 and 1443 appearing as shoulders on the right of the band at 1575 cm−1 corresponding to an aromatic C=C ring stretch; these bands can be attributed to the asymmetrical bending vibration of methyl groups that overlap with the scissoring vibration of methylene groups; (3) the –O–H bending (in-plane) between 1380 and 1430 cm−1; (4) the C–O–C and C–O stretch vibrations at 1230 cm−1; (5) the signal corresponding to the out-of-plane C–H vibration at about 860 cm−1 that overlaps with the signal corresponding to the –O–H bend (out-of-plane). These last results agree with TEM, RX and Raman data, and also evidence that a lower number of chemical groups are attached on the wall of heat-treated CNFs.
3.1.4. Thermogravimetric analysis.
Thermogravimetric analysis (TGA) can be used to study the oxidative stability of carbon nanostructured forms. Thermal degradation in air of samples PR25XTPS1100 and PR25XTPS2500, depicted in figure 7, shows that after heat treatment at 2500 ° C, CNFs are more stable toward thermal oxidative destruction than the untreated CNFs. The oxidative stability enhancement is of about 200 ° C; in fact for sample PR25XTPS2500 the beginning of the degradation occurs at about 750 ° C with respect to the temperature of 550 ° C corresponding to the untreated CNFs. The treatment at high temperature reduces the defect density, producing more perfect CNFs and therefore stabilizing the carbon nanofibers toward thermal oxidative destruction.
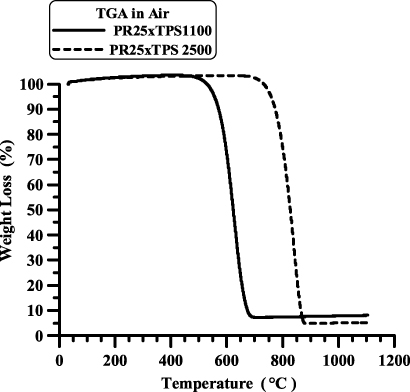
Figure 7. TGA of samples PR25XTPS1100 and PR25XTPS2500.
Download figure:
Standard image High-resolution image3.2. CNF/epoxy resin characterization
3.2.1. Thermogravimetric analysis.
Figure 8 shows the thermogravimetric curves in air of the unfilled epoxy formulation and the same resin filled with PR25XTPS2500 carbon nanofibers.
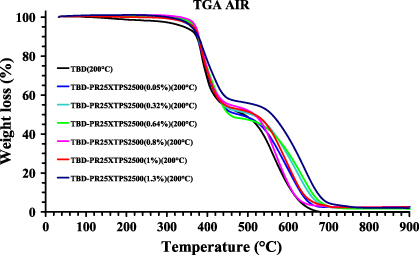
Figure 8. TGA curves of the unfilled and PR25XTPS2500 filled epoxy resins.
Download figure:
Standard image High-resolution imageA two-step thermal degradation process can be observed for all the samples. The first stage of thermal degradation of the nanofilled samples substantially occurs in the temperature range of 380–480 ° C, highlighting a stabilizing effect of the CNFs in the first stage of the degradation; in fact the unfilled sample TBD shows a slight weight loss (∼5%–6%) in the temperature range between 150 and 380 ° C. The end of the first stage at about 460 ° C involves a lower mass loss for samples loaded with a higher percentage of CNFs. The beginning of the first stage is most probably due to degradation processes which do not involve oxygen (dehydration, random scission etc), whereas the second step is strongly dependent on the oxygen availability. This hypothesis is supported by the different trend of the thermogravimetric curves in inert (N2) atmosphere (not reported here). There are two distinct and well-separated turns also for TGA curves in nitrogen; the first step is in the same temperature range, whereas the second step is much slower with respect to the degradation in air. A very interesting result is the different mass loss at the end of the first stage; it is between 60–70% in nitrogen and 45–50% in air, this effect is not influenced by the presence of CNFs.
Very similar results were obtained for the epoxy resins filled with untreated CNFs; the different thermal treatment of CNFs does not have an appreciable effect on the degradation behavior. On the contrary, the electrical properties shown in section 3.2.3 demonstrate the strong influence of the thermal treatment on the conductivity and electrical percolation threshold of the two different samples.
3.2.2. Morphological analysis.
In order to analyze the homogeneity of the nanofiller dispersion in the polymeric matrix, the samples with as-received CNFs and with heat-treated CNFs were investigated by means of SEM. The analysis was carried out on etched samples to remove the resin surrounding the nanofibers, leaving them bare as described in section 2.
Figure 9 shows SEM images of nanofilled epoxy resins at a loading rate of 0.64% by weight. The as-received CNF filled resins are on the left side and those with heat-treated CNFs are on the right side.

Figure 9. Fracture surface SEM images of the nanofilled epoxy resins at a loading rate of 0.64% by weight: as-received CNF filled resins are on the left side, heat-treated CNFs filled resins are on the right side.
Download figure:
Standard image High-resolution imageCareful observation highlights an homogeneous structure for both the samples, in which the CNFs are uniformly distributed in the epoxy matrix.
CNFs heat treated at 2500 ° C seem stiffer with the straight morphology, compared to the as-received CNFs.
3.2.3. Electrical behavior.
Figure 10 shows the measured dc volume conductivity as a function of the CNFs' weight percentage for the as-received CNF nanofilled resin (gray curve) and the heat-treated CNF nanofilled resin (black curve).

Figure 10. DC volume conductivity of the samples versus CNF weight percentage.
Download figure:
Standard image High-resolution imageRemarkable differences between the two samples are evident. In fact, although both samples exhibit a conversion from the behavior of an insulator to that of a conductor with a jump of more than five to six orders of magnitude in the dc electric conductivity, the CNF concentration at which the transition occurs is very different for the two systems. In particular, the CNF concentration for the sample filled with the heat-treated filler is much lower (less than 0.32%) than that pertaining to the sample filled with untreated CNFs for which a more than double value is found. Hence a lower amount of heat-treated filler is enough to obtain higher values in the electrical conductivity of the resin. Moreover, the value reached by the conductivity beyond the percolation region is three orders of magnitude lower for the epoxy matrix filled with the as-received CNFs with respect to the heat-treated CNFs. For example, if the percentage of 1.3% of CNFs is considered, the conductivity is around 1.6 mS m−1 for the PR25XTPS1100-based system, whereas the epoxy matrix filled with PR25XTPS2500 is higher than 1.37 S m−1.
In a previous paper, the authors analyzed the electrical conductivity of resins filled with CNFs subjected to heat treatment at temperatures ranging from 1500 to 3000 ° C [19]. They obtained similar results for a different epoxy matrix and for a CNF concentration of 4%. In particular, they found that heating treatment at a temperature of 3000 ° C causes an increasing in the electrical conductivity from about 10−3 S m−1 (for the untreated CNF loaded sample) to 1.0 S m−1 for the heat-treated CNFs. Generally, the heat treatment leads to resins characterized by higher conductivity. In the same paper, the authors show that when the loading of CNFs was increased at 8% or 12%, no remarkable differences were observed between the untreated and the heat-treated CNF loaded samples.
If the present results are compared with the already published data, it can be deduced that the observed remarkable differences in the conduction properties of the two analyzed systems (PR25XTPS1100- and PR25XTPS2500-based systems) are not associated with different values of the conductivity of the different CNFs but, most probably, to other occurrences which are effective at low filler concentrations.
In particular, the geometrical properties of the two fillers and the characteristics of their distribution inside the matrix may be analyzed for this purpose.
Concerning the geometrical aspects, the theoretical prediction of the electrical percolation threshold (EPT) for randomly dispersed hard particles can be obtained with reference to the excluded volume associated with these objects [30]. According to this theory, the EPT of a resin filled with cylindrical conductive particles of diameter W and length L can be estimated as the inverse of the aspect ratio (AR = L/W), whereas the conductivity of the nanofilled resin beyond the EPT increases with AR. For the pristine CNFs, having L = [20,200] μm and D = [125,150] nm, this theory indicates EPT less than 0.75% (i.e. the EPT obtained for L at minimum and D at maximum value respectively), a value which is very close to the detected one (i.e. EPTPR25XTPS1100∈[0.64,0.8]%). The thermal treatment, leading to the alignment of the fibers, as the SEM images of figures 1(b) and 9 confirm, induces a narrowing of the diameter and an increase of the length of the CNFs which determine a higher value of the AR and a lower EPT.
Moreover, the increased structural order induced by the graphitization after heat treatment at 2500 ° C determines a higher rigidity of the obtained fibers. The increased rigidity is in turn responsible for a lower tendency of the heat-treated fibers to bend with respect to the pristine ones. As far as the percolation mechanism is concerned, the lower curvature determines a greater 'equivalent length' of the heat-treated fibers (the span covered by the fiber inside the resin) which, therefore, may lower the EPT. The same mechanism may also be responsible of the higher conductivity of heat-treated CNFs for the same filler concentration. In fact, a larger number of electrical contacts can be produced by the longer, straight heat-treated fibers.
It is known that in nanofilled resins with a filler concentration over the EPT, the predominant conduction mechanism is the tunneling effect between neighboring conducting structures in which a great role is played by the interaction of the filler matrix. Numerical simulations presented in a recent study [31] show that a variation as large as three orders of magnitude in the conductivity of a nanosized cylindrical filler does not affect the resulting conductivity of the resin when the tunneling effect is considered. This can be modeled with a resistance Rtunnel, depending exponentially on the distance between the conductive filler structures belonging to the percolation path,

In equation (1) h is Planck's constant, A and d are the cross-sectional area and the distance between the filler respectively, e the electron charge, m the mass of an electron and λ represents the height of the barrier which typically takes values of a few eV.
The heat-treated CNFs are characterized by a greater smoothness of the external surface of the fibers (with respect to the pristine fibers). The smoother surface may indeed provide fewer linking points for the epoxy matrix thus inducing a lower thickness of the insulating layer around the fibers. Finally, it can be considered that a good filler dispersion is observed during the production process and is shown in the SEM images of figure 9 for both the nanofilled resins. This suggests that the nanofiber agglomeration does not have a significant impact on the obtained conductivity characteristics.
Summing up, the better conduction performances exhibited by the nanofilled systems based on heat-treated CNF may be reasonably ascribed to their lower tendency to bend due to graphitization and to their smoother surface, which determines a lower thickness of the insulating layer around the fibers, which in turn controls the value of the resistance associated with the tunneling between conducting clusters forming the percolating paths inside the resin. Moreover, it can be observed that the values of electrical conductivity are quite similar to those found for the same epoxy matrix filled with CNTs [32].
3.2.4. Dynamic mechanical properties.
Dynamic mechanical analyses (DMAs) on the nanofilled samples were carried out with the aim of understanding the influence of the different CNFs on the storage modulus and tanδ of the samples. Figures 11(a) and (b) show the storage modulus of the epoxy resin filled with untreated and heat-treated CNFs.

Figure 11. Storage modulus of the epoxy resin filled with untreated and heat-treated CNFs.
Download figure:
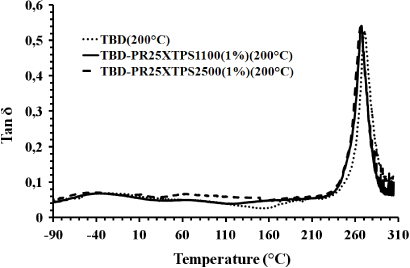
Standard image High-resolution imageWe can observe a value in the storage modulus higher than 2000 MPa up to 110 ° C for all the samples. The principal drop, due to the glass transition, is evident for all the curves in the temperature range of 230–260 ° C. In this range also the tan δ curves show a peak, indicating the main transition ascribable to the glass transition temperature (see figure 12). All the samples show almost identical peak height and position in the loss factor curves. This indicates that the CNFs have no particular effect on the relaxation phenomena leading to the glass transition temperature of the samples. As far as the storage modulus is concerned, heat-treated CNFs show a reinforcing effect up to 60 ° C. Untreated CNFs show a stronger reinforcing effect than the heat-treated CNFs. This effect can be observed in the entire analyzed temperature range (−90–260 ° C). Considering the results related to tanδ curves, this very interesting result is most likely due to the different morphological features of the CNFs; in particular, the exposed edges in the untreated CNFs cause a more efficient interaction of the nanofiller matrix, improving the effectiveness of the load transfer between the two components.
Figure 12. Loss factor (tanδ) of the unfilled epoxy mixture and its resins filled with 1% (weight percentage) of untreated and heat-treated CNFs.
Download figure:
Standard image High-resolution image
4. Conclusions
Graphitization of carbon nanofibers has proven to be an effective method in removing defects from carbon nanofibers, causing a strong increase in their structural perfection and stability. Raman spectroscopy, in fact, shows that the heat treatment strongly influence the degree of structural ordering and therefore the bonding states of carbon atoms in the nanofiber structure. It causes a significant transformation in the hybridization state of the bonded carbon atoms.
TGA shows that nanofibers annealed at 2500 ° C (PR25XTPS2500) are more stable in air than the pristine nanofibers (PR25XTPS1100). The oxidative stability enhancement of 200 ° C was observed.
The presence of defect sites along the fibers highlights the role of the defects on the electrical properties of CNFs/epoxy-amine resins. The enhancement in the fiber structural perfection very positively affects the electrical conductivity of the nanofiber-reinforced resins leading to an increase in the conductivity at very low filler concentration. The investigation on the dc conductivity around the percolation threshold shows a significant difference between the two different nanofibers. The lower percolation threshold and higher conductivity exhibited by the nanofilled resins based on heat-treated CNF can be justified on the basis of their stiffness and smoothness of surface graphitized CNFs which determines a lower thickness of the insulating epoxy layer around the fibers. This hypothesis is also supported by FTIR analysis of untreated and heat-treated CNFs. FTIR data have shown that fewer chemical groups are attached on the wall of heat-treated CNFs. These groups, more numerous on the wall of as-received CNFs, are most probably responsible for covalent and/or non-covalent bonds such as intermolecular forces due to hydrogen bonds. These stronger interactions should favor the mechanical reinforcement and, conversely, decrease the electrical conductivity. The morphological features and the chemical changes on the CNFs walls affect the electrical conductivity and the dynamic mechanical properties, causing a lower reinforcing effect in the storage modulus of the resin nanofilled with heat-treated CNFs than for the samples filled with untreated CNFs.
The heat treatment at high temperature also causes an increase in the oxidative stability of the nanofillers and their loaded resins. The oxidative stability of the reinforced resin tends to increase with increasing nanofiller percentage. A very interesting result observed for CNFs is that the value of the electrical conductivity of the resin filled with CNFs treated at 2500 ° C is the higher value obtained for epoxy resins filled with a low percentage of CNTs. The values of electrical conductivity are only slightly different from those found for the same epoxy matrix filled with CNTs. However, it has to be considered that CNFs/epoxy resins are obtained by an easier production process mainly in the step of nanofiller dispersion inside the epoxy liquid mixture, which is a very difficult step before the curing process.
Acknowledgments
The research leading to these results has received funding from the European Union Seventh Framework Programme FP7/2007–13 under grant agreement no. 313978.